Impact Factor ISSN: 1449-2288

 Global reach, higher impact
Int J Biol Sci 2007; 3(1):12-19. doi:10.7150/ijbs.3.12 This issue Cite
Research Paper
Increased Susceptibility to Metabolic Alterations in Young Adult Females Exposed to Early Malnutrition
María del Carmen Miñana-Solis1, Carolina Escobar1 2 ![]()
1. Departamento de Anatomía, Facultad de Medicina, Universidad Nacional Autónoma de México, México, D. F. 04510
2. Dirección General de Investigación, Universidad Veracruzana, Xalapa Ver.
Received 2006-6-23; Accepted 2006-9-29; Published 2006-10-5
Abstract
Early malnutrition during gestation and lactation modifies growth and metabolism permanently. Follow up studies using a nutritional rehabilitation protocol have reported that early malnourished rats exhibit hyperglycemia and/or hyperinsulinemia, suggesting that the effects of early malnutrition are permanent and produce a “programming” effect on metabolism. Deleterious effects have mainly been observed when early-malnutrition is followed by a high-carbohydrate or a high-fat diet.
The aim of this study was to evaluate whether following a balanced diet subsequent to malnutrition can deter the expression of metabolic disease and lead rats to exhibit metabolic responses, similar to those of well-nourished controls.
Young rats, born from dams malnourished during gestation and lactation with a low protein diet, were provided with a regular balanced chow diet upon weaning. At 90 days of age, the effects of rehabilitation were determined under three different feeding conditions: ad libitum, fasting or fasting-reefed satiated.
Early-malnourished rats showed an increased rate of body weight gain. Males under ad libitum conditions showed an elevated concentration of hepatic glycogen and low values of insulin. In the fasting-reefed satiated condition, only early-malnourished females showed an alteration in glucose response and glucagon level, compared with their well-nourished controls.
Data indicate that a balanced diet along life after early malnutrition can mask the expression of metabolic disorders and that a metabolic challenges due to a prolonged fasting and reefed state unmask metabolic deficiencies in early-malnourished females.
Keywords: nutritional rehabilitation, diabetes, metabolic programming, hormones
1. INTRODUCTION
Malnutrition is a persistent health problem affecting people from many communities in the world, in particular children during their first years of life [1], and it has been intensively studied by many authors during the last 50 years [2, 3]. It is well known that, during the perinatal stage, the different functional systems undergo critical periods of growth and maturing, and cell groups establish strategies for neuronal and endocrine interaction [4, 5, 6]. Evidence indicates that early malnutrition promotes adaptive metabolic strategies, which involve a change in metabolic set points in order to permit survival under critical conditions [7]. Epidemiological studies show that, during adult life, these specially acquired strategies promote faster fat storage and elevate the risk of suffering from glucose intolerance, non-insulin-dependent diabetes mellitus or metabolic syndrome, characterized by hypertension, hyperlipidaemia and, in later life, cardiovascular disease [8, 9]. Among human populations, the mechanisms that link malnutrition and long-term disease are unclear, probably because many environmental variables may influence development and confuse the correlation between disease onset, genetic factors and lifestyle history. Besides this, severity, duration and age during the period of malnutrition are crucial factors in terms of defining its later effects [10].
Studies using experimental models exposed to a low protein diet during gestation and/or lactation have indicated that early malnutrition in life modifies individual growth and metabolism permanently, leading to long-term alterations in organ size and function, especially in the liver and the pancreas [9]. Thus, gestation and lactation are considered critical periods for the development of these organs as in the case of rats, where protein supply to pregnant and lactating females is essential for the development of the pups' β-cells in the pancreas [11].
Many studies have explored the short-term consequences of early malnutrition [12, 13, 14], which are decreased concentration of hepatic enzymes and hormones [15], impaired glucose metabolism [16] and reduced body weight [17].
Other studies have evaluated the effects of nutritional rehabilitation over a short-term period [18]: the deficient diet is replaced by a regular balanced diet shortly after weaning or by using a protocol with cross-fostered mothers during lactation [17]. In the short term, malnourished animals exhibit low glucose values [8, 19, 20], which remain altered after a short-term rehabilitation interval [9, 21, 22, 23], indicating that individuals remain affected, and that the effects of early malnutrition are not reversible by nutritional rehabilitation in the short-term. Alterations in glucose regulation continue into adulthood and may be due to dysfunction of the pancreas or a deficient uptake of the muscle [24, 25]. Additionally differential gender effects of malnutrition on metabolism have been reported, indicating a higher susceptibility for males to suffer from insulin resistance [9] or other metabolic disorders [19], as compared to females.
The present study explores whether a balanced diet from weaning onwards, subsequent to gestation-lactation low protein malnutrition is able to revert the effects of early malnutrition on body weight, on organ growth (liver, stomach, epididymal and retroperitoneal fat pads) and on metabolic balance and hormones [26, 27, 28], in the long term. Besides this, we explored whether in a long term there is a differential response to a balanced diet, depending on gender.
This study explored the metabolic response of young adult rehabilitated rats and their well-nourished controls after 48 h fasting and after 48 h fasting-1.5 h refeeding interval. Both are extreme metabolic conditions, representing a challenge for energy balance, which may unmask metabolic limitations that are not apparent under ad libitum conditions.
2. MATERIALS AND METHODS
GENERAL CONDITIONS
Animals used for this study were 90 day-old Wistar Rattus norvegicus of both sexes (bred at the Faculty of Medicine of the National Autonomous University of Mexico, UNAM). Rats were born and nourished either by a well-fed or a malnourished primiparous female. They were housed in acrylic cages and maintained in a light-dark cycle 14:10 h (lights on 6:00h), at a controlled temperature of 22-24o C, humidity 40-50%, with food and water ad libitum. Experimental procedures were approved by the Biosecurity and Bioethics Committee , Faculty of Medicine, UNAM, according to the Mexican Laws for Animal Care [29], which comply with the Guide for the Care and Use of Laboratory Animals (NIH publication 80-23, revised 1996).
NUTRITIONAL CONDITIONS
Experimental rats were born to 3 month-old virgin females, which were randomly assigned to one of two groups:
- Malnutrition (n=6 reproductive females): Rats had free access to an isocaloric low protein diet 6% protein (Harlan TD 92090).
- Control (n=5 reproductive females): Rats had free access to a standard Rodent Laboratory diet 23% protein (Purina chow 5001).
Females of both groups were maintained with their corresponding diet from 2 weeks previous to mating and throughout gestation and lactation. After following the assigned diet for two weeks, males were introduced into the females' cages for one week. Reproductive units were formed between one male and two females. Pregnancy was confirmed by abdominal palpation and weight increase.
Date of parturition was estimated 22 days after the introduction of the males into the females' cage. Three days before estimated parturition, females were placed in individual cages with sufficient wood shavings for nesting and maintained in these conditions throughout lactation.
On postnatal (P) day 1, litters were standardized to consist of 8 pups (4 males and 4 females), which were immediately weighed. The body weight of the resulting pups corresponded with data published by other groups providing the same diet [28, 30]. On day P25 litters were weaned, sexed and weighed and 4-6 individuals were housed together in groups pertaining to the same nutritional category and sex. Both groups were fed the standard Rodent Laboratory diet with 23% protein, resulting in the formation of two experimental groups:
Control (C): pups from dams fed a standard diet during gestation and lactation continued to be fed a standard diet after weaning.
Early-Malnutrition (E-M): pups from dams fed a low protein diet during gestation and lactation were fed a standard diet after weaning.
Rats were weighed every 10 days until P90. In order to have an early and long-term index of food intake; on days 29-30 and 86-87, the rats' 24h food ingestion was estimated by weighing the food in the feeder for one day. The proportion of ingested food was estimated according to body weight, group and gender.
In order to describe metabolic strategies at 90 days, males and females from both groups; C and E-M rats (n = 4-8) were randomly tested under one of three metabolic conditions:
- Ad libitum (al): rats remained undisturbed with free access to food (Cal, E-Mal).
- Fasting (F): rats were exposed to 48 h of total food deprivation previous to sacrifice (CF, E-MF).
- Fasted-reefed satiated (S): rats were exposed to 48 h of fasting and then fed for 90 minutes in order to allow them to become satiated (CS, E-MS).
All animals were sacrificed between 16:00 h and 17:30 h.
SERUM AND ORGAN SAMPLES
Rats were killed by rapid decapitation and then trunk-blood was collected in 10 ml test tubes containing a clot-forming gel (Vacutainer, Becton Dickinson). Tubes were centrifuged at 2,500 rpm for 15 minutes to obtain blood plasma. Aliquots of 200 μL were coded and frozen at –45oC for subsequent determination of glucose, triacylglycerols, free fatty acids (FFA), insulin and glucagon.
Following blood collection, organs were dissected to obtain wet weight. The stomach was dissected at the level of the lower gastroesophageal sphincter and the pylorus, the liver was dissected at the level of the hepatic portal vein and the suspension ligament. The main liver lobule was frozen at –45o C for subsequent determination of hepatic glycogen. The retro peritoneal and epididymal or ovarian fat pads were bilaterally dissected following Bartness [31].
METABOLITES AND HORMONES
Glucose and triacylglycerols were determined from 10 μL of plasma each, with standard kits of Hycel de México No 70408 and Bayer SERA-PAK ® Plus No B01-4551-0, respectively.
FFA were determined using 100 μL of plasma, according to the Novák enzymatic method, as described elsewhere [32].
Hepatic glycogen was assayed using 1g of tissue, according to the method proposed by Hassid and Abram [33]. The extracted glucose was determined using the same standard kit devised by Hycel.
Insulin and glucagon were evaluated from a sample of 200 μL of plasma with a standard RIA kit of Diagnostic Products Corporation (TKIN1 and KGND1).
STATISTICAL ANALYSIS
Data are reported as mean ± standard error of the mean (sem).
Values of body weight at P6 and P25 were analyzed using a one-way ANOVA for the factor nutritional group (C and E-M). Body weight after weaning was analyzed using a three-way ANOVA, with reference to the following factors: nutritional group (NG), age and gender.
A three way ANOVA for independent samples was used to analyze metabolic variables with reference to the following factors; NG at two levels, gender at two levels, and metabolic conditions (Met) at three levels. Following the ANOVA a Tukey post hoc multiple comparisons test was applied in order to identify differences both within and between groups and significance was set at p<0.05. The statistical analysis was performed using the Statistica program (version 4.5, 1993) and graphics were elaborated using Sigma Plot 2001.
3. RESULTS
BODY WEIGHT
On day P6, the body weight of the E-M group represented 55% of the C group weight and was statistically different (F(1,70)=583.91; p<0.001). At weaning (P25), body weight of the E-M pups represented 39% of the C group. After weaning, both C and E-M groups increased their body weight until 90 days of age. In spite of the balanced diet, males and females of E-M groups did not reach the body weight of the C rats; at 90 days, E-M male rats had reached 79% of their corresponding C group and E-M females had reached 78% of their corresponding C group body weight (Figure 1A).
A) Body weight of rats from weaning to 90 days (n=18). Body weight was significantly different (p<0.001; asterisk) between the control (black circles) and the Early-Malnourished group (white circles). Gender difference was observed in both C and E-M groups (Δ = p<0.001). B) Ratio of body weight increase from weaning to 90 days of age in both groups C and E-M.
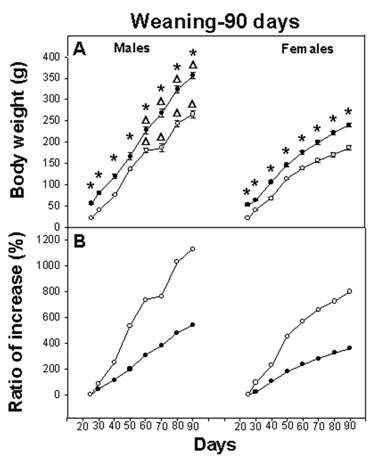
The three-way ANOVA indicated a significant main effect for NG (F(1,68)=436.52; p<0.001), for gender (F(1,68)=324.29; p<0.001), for age (F(7,476)=1149.45; p<0.001) and the interaction of all factors, NG x age (F(7,476)=11.55; p<0.001), NG x gender (F(1,68)=15.61; p<0.001), age x gender (F(7,476)=54.74; p<0.001) and NG x age x gender (F(7,476)=2.73; p<0.001). The post hoc test revealed higher body weight among C groups throughout the experiment, compared with E-M groups (p<0.001). The test also indicated a difference between male and female body weight in both the C and E-M groups, (p<0.001) (Figure 1A).
In spite of the fact that E-M rats remained smaller than their C counterparts, the growth rate varied. The body weight-gain of male C rats from weaning until P90 represented an increase of 539 %, while among the male E-M rats, the weight increment for the same interval represented 1130%. A similar increase in body weight was observed among female C rats, consisting of 359% vs. 800% for E-M rats (Figure 1B). This is relevant because on P30 and P87 meal consumption for both males and females from the C and E-M groups was equivalent and proportionately similar to their body weight (Table 1).
Food ingestion of male and female control (C) and early- malnourished (E-M) rats at 30 and 87 days.
if =ingested food
bw = body weight
* p<0.01; control different from the Early-Malnutrition group
WEIGHT OF ORGANS
The epididymal and retro peritoneal fat pads showed no difference either between nutritional groups under the three metabolic conditions or between genders (data not shown).
The stomach weight in proportion to body weight was similar among C and E-M rats but showed a difference with regard to metabolic conditions. The CS and E-MS showed a higher stomach weight, which represented 6 to 8 times the value of the al libitum and fasting condition (data not shown). The three-way ANOVA did not reveal a statistical difference due to NG (F (1,60=2.02; NS) or gender (F (1,60)=0.00; NS), only a general effect due to the Met (F (2,60)=207.72; p<0.001).
The liver showed a lesser weight (a decrease of 16-24%) in CF, E-MF and CS, E-MS compared with Cal and E-Mal (data not shown). The three-way ANOVA did not indicate an effect due to NG (F (1,60)=1.31; NS) or due to gender (F (1,60)=4.27; NS), however, it indicated a statistical difference due to the Met (F (2,60)=207.72; p<0.001).
SERUM METABOLITES
Triacylglycerols
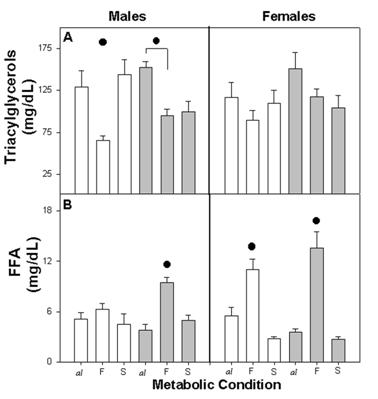
The plasma concentration of triacylglycerols varied according to metabolic condition. Among C male and female triacylglycerols, concentration was high in Cal and CS and low in CF. However among male and female E-M, the concentration in E-MS remained low with similar values as E-MF (Figure 2A).
Plasma concentration of triacylglycerols (A) and FFA (B) in different metabolic conditions: ad libitum (al), fasting (F) and satiety (S) in control (open bars) and Early-Malnutrition (dark bars), male and female rats (n = 4-8 per group). Difference within metabolic conditions is indicated by (•) F ≠ al, F≠ S and or F ≠ al (p≤0.01).
The three-way ANOVA indicated a statistical effect due to Met (F (2,60)=10.62; p<0.001) and the interaction between NG x Met (F(2,60)=4.90; p<0.01), but no effect was evident due to NG (F (1,60)=1.84 NS), gender (F (1,60)=0.00 NS), or their interaction.
Free fatty acids (FFA)
The metabolic pattern of plasma FFA was similar for all groups, with high values for both of the fasted groups (CF and E-MF) and low values for Cal, E-Mal and for CS, E-MS. The response when fasting was higher among females than males, and in C males it showed the least change with regard to metabolic conditions (Figure 2B).
The three-way ANOVA indicated a statistical difference due to the Met (F (2,58)=53.92; p<0.001), interaction NG x Met (F (2,58)=5.55; p<0.001) and Met x gender (F (2,58)=12.14; p<0.001). No statistical effects were found due to NG, gender or their interaction.
Hepatic Glycogen
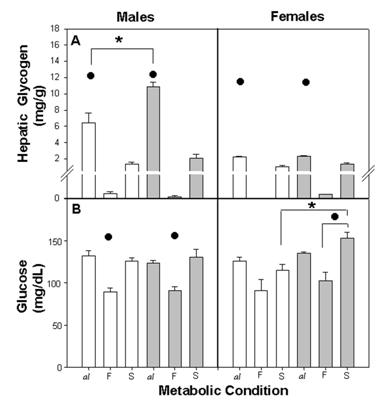
Among all groups, the hepatic glycogen concentration varied according to the metabolic condition. In ad libitum, glycogen concentration was high, while CS, E-MS exhibited low values and CF, E-MF showed minimal values. Besides this, the hepatic glycogen in Cal and E-Mal was higher among males than among females. In CS and E-MS, hepatic glycogen increased, although not significantly, from CF and E-MF (Figure 3A).
Hepatic glycogen concentration per gram of tissue (A) and plasma glucose concentration (B) in control and E-M rats. Difference within metabolic conditions (•) al ≠ F and al ≠ S (p<0.001) and (*) between C and E-M groups (p<0.001). For other details see fig. 2
The three-way ANOVA indicated a statistical difference due to the factors NG (F (1,58)=13.75; p<0.001), Met (F(2,58)=163.5; p<0.001), gender (F (1,58)=84.86 p<0.001) and their interaction NG x Met (F (1,58)=6.90; p<0.002), NG x gender (F (1,58)=9.90; p<0.002), Met x gender (F (2,58)=64.17; p<0.001) and NG x Met x gender (F (2,58)=7.70; p<0.001).
Glucose
The dynamic of plasma glucose was very similar among nutritional groups with similar values for Cal, E-Mal and CS, E-MS and low values during fasting for CF and E-MF. The E-MS females represented an exception, reaching significantly higher values than the CS, after refeeding (Figure 3B).
The three-way ANOVA revealed a difference between NG (F (1,60) = 5.28; p<0.02), Met (F(2,60) = 35.11; p<0.001) and the interaction NG x gender (F (1,60) = 6.17 p<0.01). No significant effects were found due to gender (F (1,60) = 1.51 NS) and the combination of factors NG x Met, Met x gender and NG x Met x gender.
SERUM HORMONES
Insulin
The general pattern of insulin secretion was similar for the different nutritional groups. As expected, initial concentration observed in Cal and E-Mal, decreased in CF and E-MF and increased in CS and E-MS. Cal males exhibited higher insulin levels than the E-Mal males and than the Cal females (Figure 4A).
Plasma concentration of insulin (A), glucagon (B) and insulin/glucagon ratio (C). There were differences within metabolic conditions (•) F ≠ al, F≠ S and al ≠ S (p<0.001) and (*) between groups C ≠ E-M (p<0.04). For other details see fig 2.
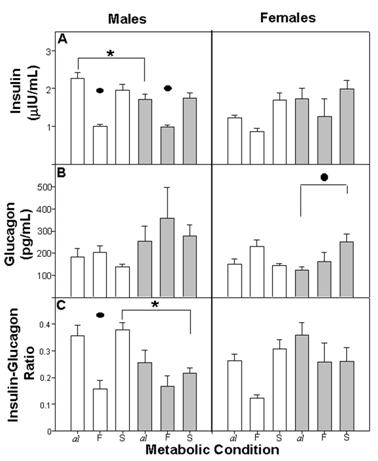
The three-way ANOVA showed differences between Met (F(2,60) = 21.58; p<0.001) and between the combination of factors NG x gender (F(1,67)=8.48; p<0.004), but we could not find any differences between NG (F (1,67)=0.38 NS), gender (F (1,67)=1.89 NS) or the combination of these factors.
Glucagon
Plasmatic glucagon levels were similar for Cal, E-Mal and CS, E-MS. When fasting, the concentration of glucagon recorded high levels for both males and females. However E-M females recorded high levels after the refeeding episode (Figure 4B).
The three-way ANOVA showed a difference between Met (F(2,53)=1.14; p<0.05) and we did not find any differences between NG (F(1,53)=3.57; p<0.06), gender (F (1,53)=3.12 NS) or the combination of these factors.
Insulin/Glucagon ratio
The insulin/glucagon ratio represents the proportion of insulin to glucagon and indicates the catabolic or anabolic tendency in the organism. The general tendency in Cal and E-Mal was an elevated insulin/glucagon ratio in comparison with CF and E-MF, where insulin was decreased in proportion to glucagon. This dynamic was observed among both nutritional groups of males as well as in the C female group. In E-Mal and E-MF females the dynamic was similar to the other groups, but after refeeding the ratio of E-MS remained low and similar to E-MF (Figure 4C).
The three-way ANOVA revealed a difference between Met (F(2,51)=11.71; p<0.001), the combination of the factors NG x Met (F(1,51)=4.69; p<0.01) and NG x gender (F (1,51)=9.21; p<0.001). We did not find differences between NG or gender or the combination of these factors.
4. DISCUSSION
Present data indicate that early malnutrition can affect body weight among rats exposed to a regular diet after weaning, and that at 90 days of age rehabilitated rats do not reach a body weight equivalent to their controls. Effects of early malnutrition were observed specifically in females, where a significantly different metabolic response was observed in a fasted-reefed satiated condition. The differential response was observed in plasma concentrations of glucose and glucagon. This difference was not observed under regular ad libitum conditions, but was evidenced when rats were exposed to a metabolic challenge of 48 hrs fasting and refeeding.
During lactation, early malnourished rats showed a slow increase in body weight and, at weaning, E-M rats showed a significantly low body weight, which represented 39% of their C. Body weight values among E-M rats at weaning are in conformity with previously reported data [28]. At 90 days and after a post weaning period with a balanced diet, E-M rats still exhibited a lower body weight than their C. Similarly, other authors with different rehabilitation protocols have reported that early malnourished animals do not reach the same values as their controls, and have concluded that they were not rehabilitated [17, 22, 34, 35].
However, present data indicate that early malnourished rats exhibited a greater rate of weight gain than their well-fed controls and, due to their initial deficiency; E-M rats did not reach the C body weight at 90 days. It is important to point out that, at 30 and 90 days, the proportion of ingested food for body weight was similar for both groups (Table 1). Thus, the increased weight gain ratio suggests that E-M rats may benefit more from nutrients contained in the same diet and may have a greater propensity towards gaining weight. This propensity of malnourished rats is termed by some authors as the “thrifty phenotype” [6,7], which indicates that early malnourished rats possess a metabolism which allows them to benefit from nutrients and build up energy stores in greater proportion than their C. This may lead E-M rats to become obese, resulting in metabolic disturbances [36].
The wet-weight of the stomach did not vary significantly between nutritional groups, but for the animals of the fasted-reefed condition the organs weighed significantly more due to the food which was ingested during the previous 90 min, while the fasted and al rats exhibited empty stomachs. The average amount of food ingested during this 90 min interval was 15g for C and E-M males, 12g for the C-S females and 9.8g for E-MS females. Although it seems different, in terms of body weight, the proportion of ingested food was not statistically different among the groups and gender.
In general, all the organs (liver, stomach, retro peritoneal and epididymal fat pads) were smaller among E-M rats, but all weights were similar when normalized with their body weights. Present data differ from previously published data which report a difference in the total weight as well as in proportional weight in organ size, in retro peritoneal and gonadic fat pads, when rehabilitated and control rats are compared [10, 17, 35, 37]. In the present study, we did not find a selective difference in proportional organ weight associated with gender.
Plasma concentration of triacylglycerols in both nutritional groups showed a similar pattern during ad libitum and fasting, as reported by Triscari [38]. However E-MS did not show an increase after the meal as was observed in the C group, and as described by Samra [39]. A previous study reported that rehabilitated animals subsequent to diverse protocols of malnutrition show decreased concentrations of triacylglycerols and that this process is more evident in males than in females [40, 41]. Present data indicate similar values between C and E-M groups and a difference only became evident after the fasting-refeeding challenge. According to our estimations for food ingested during the 90 min interval, the amount of food is not a significant factor for determining the difference between CS and E-MS. It is possible that the decreased triacylglycerols value among the E-MS rats subsequent to the meal was due to faster digestion and mobilization in order to replete their fat stores. Besides this, low triacylglycerol levels have been described among a substantial number of animals, submitted to successive fasting intervals [42].
The plasma FFA concentrations in ad libitum conditions were similar among the various nutritional groups and the response to the metabolic challenge of fasting demonstrated an increase as expected [43]. During fasting, females exhibited higher values of plasma FFA than males, in conformity with previous reports [19, 39]. A previous study has reported that early malnourished animals in fasting conditions exhibit a delay in their utilization of FFA as an alternative energy source, probably due to the fact that they store more hepatic glycogen, which is subsequently the first energy source to be mobilized [44]. The present data suggest that E-MF rats mobilize FFA during fasting, and the delay in its utilization may be the reason for the high levels observed among E-M rats. Kabadi et al [45] have suggested that this increased mobilization of FFA is able to promote a long term resistance to insulin and also lead to metabolic imbalance.
The patterns of hepatic glycogen showed similar variations depending on the Met in different nutritional groups. All groups showed very low glycogen values after fasting, partly resulting from the effects of refeeding. Similar values were observed for liver weight, which showed very low values after fasting. We can thus suggest that low values for liver weight during fasting may be due to glycogen depletion. Among early-malnourished rats at 1.5 months of age, a higher storage of glycogen has been previously reported, as well as a delayed mobilization of hepatic glycogen during fasting, when compared to control animals [46]. The prolonged fasting data from the present study do not permit the confirmation of this process. Higher levels of glycogen have been reported among males when compared to females; this gender specificity was reported by Teutsch [47] and Triscari [38] and our data confirm these previous findings.
Similar patterns for plasmatic glucose and insulin concentrations were observed among all groups. Only significantly high glucose values were observed among E-MS females, pointing out the selective deficiency of females for maintaining their glucose balance, especially after a big meal. This may be due to a deficiency in insulin secretion; however, present data do not confirm this. Previous studies have reported low glucose concentrations among early malnourished rats during a glucose tolerance test associated with a high insulin release [5]. Besides this, low insulin levels have been reported at early stages, when rats are exposed to a low protein diet [10, 45]. In the present study no significant differences were detected either in insulin or in glucose levels among E-M rats. We may speculate that, in general, exposure to a balanced diet promotes recuperation of the pancreatic function, although other studies testing effects in the short term did not observe a reversal of effects [48, 49].
Mean glucagon concentrations were also similar for all groups, indicating that the early change of diet, promotes a similar pancreatic response among E-M rats. It is important to point out that, among the E-MS females, the glucagon levels remained elevated after the fasting-feeding episode. It was previously reported that malnourished animals show decreased concentration of glucagon, compared with control animals [10], and a significant increase after fasting [40].
In this study, the ad libitum data do not reflect a significant difference among nutritional groups, thus indicating strong adaptive homeostatic strategies, which are necessary for survival. The use of a metabolic challenge due to prolonged fasting and refeeding revealed the capacities and limits of response among E-M rats, especially among females. Under a fasted-reefed condition, the E-MS female rats exhibited high levels of glucose and glucagon that made evident a deficient capacity for reacting to a metabolic challenge. The high levels of glucagon during fasting-refeeding may exert a strong stimulus for the liver to produce glucose and may mediate the increased glucose level observed after a meal among E-MS females. The differential vulnerability defined by gender for developing hyperglycemia and diabetic-type conditions has been reported previously, and indicates a propensity for insulin resistance among males and low insulin production among females [9]. The factors promoting this differential susceptibility are diverse. This differential vulnerability in females can be explained by a gender dependent liver enzymatic activity, as described by Lee et al [50]. A differential distribution in enzymes involved in glucose production can lead females to a higher propensity to develop diabetes. On the other hand steroid hormones can play a relevant role for building up adipose and thus also influence energy metabolism. A recent study described lower sensitivity in female rats to insulin and higher susceptibility for perturbations in pancreatic islet morphology [51]. Thus, diverse morphological and functional factors may promote this gender dependent susceptibility to metabolic alterations.
Several studies have indicated that a long-term metabolic derangement in early malnourished rats is observed when rats are exposed to high-caloric, high-fat diets mainly in later life [52, 53]. Under such conditions rats develop a metabolic syndrome, characterized by hyperlipidemia, obesity and hypertension [54]. In the present study the balanced diet did not unleash a chain of metabolic disorders or imbalances. However, when rats were exposed to a metabolic challenge, such as prolonged fasting and refeeding, the metabolic deficiencies were unmasked and expressed, especially among females. The mechanisms for these alterations are not yet clear, but apparently malnutrition during critical periods of development modifies metabolic regulatory set-points and produces susceptibility in the individual towards suffering metabolic disorders, which may be unleashed by extreme metabolic conditions or unbalanced diets.
Acknowledgements
This study was supported by grants DGAPA IN-203803 and CONACyT 43950-M.
Authors wish to thank Miss Leticia Parra for technical support and PhD Laura Ongai, Instituto de Fisiología Celular UNAM for support in RIA evaluations. We wish to thank PhD Manuel Angeles Castellanos and PhD Jorge Mendoza Camacho for ideas and suggestions to this manuscript.
CONFLICT OF INTERESTS
The authors have declared that no conflict of interest exists.
References
1. Onis M, Frongillo E, Blössner M. ¿Está disminuyendo la malnutrición? Análisis de la evolución del nivel de malnutrición infantil desde 1980. Bulletin of the World Health Organization. 2000 ;78:1222-1233
2. Joaquin C, Hambraeus L, Vahlquist B. Early Malnutrition and Mental Development. Symposia of the Swedish Nutrition Fundation XII. Sweden: Almqvist &Wiksell. 1974
3. Waterlow JC. Malnutrición Proteico-Energética. Organización Panamericana de la Salud. 1996
4. Levin BE. Metabolic imprinting on genetically predisposed neural circuits perpetuates obesity. Nutrition. 2000 ;16:909-915
5. Prescott J, Read M, Coursin D. Brain function and Malnutrition neuropsychological methods of assessment. New York: John Wiley and SONS. 1975
6. Dobbing J. The late growth of the brain and its vulnerability. Pediatrics. 1974 ;53:2-6
7. Hales CN, Barker DJP. Type 2 (non-insulin-dependent) diabetes mellitus: The thrifty phenotype hypothesis. Diabetologia. 1992 ;35:595-601
8. Phillips DI. Birth weight and the future development of diabetes: A review of the evidence. Diabetes Care. 1998 (Suppl 21):B150-B155
9. Hales CN, Desai M, Ozanne SE. et al. Fishing in the stream of diabetes: From measuring insulin to the control of fetal organogenesis. Biochem Soc Trans. 1996 ;24:341-349
10. Holness MJ, Langdown ML, Sugden MC. Early-life programming of susceptibility to dysregulation of glucose metabolism and the development of type 2 diabetes mellitus. Biochem J. 2000 ;349:657-665
11. Desai M, Crowther NJ, Lucas A. et al. Organ-selective growth in the offspring of protein-restricted mothers. Br J of Nutr. 1996 ;76:591-603
12. Winick M, Fish I, Rosso P. Cellular Recovery in rat tissues after a brief period of neonatal malnutrition. J Nutr. 1995 ;95:623-626
13. Claeyssens S, Lavoinne A, Fresel-Ragot M. et al. Metabolic changes in rats fed a low protein diet during post-weaning growth. Metabolism. 1990 ;39:676-681
14. Perez-Torrero E, Torrero C, Collado P. et al. A paradigm of undernourishing and neonatal rehabilitation in the newborn rat. Nutr Neurosci. 2003 ;6:113-115
15. Rao RH. Adaptations in glucose homeostasis during chronic nutritional deprivation in rats: hepatic resistance to both insulin and glucagon. Metabolism. 1995 ;44:817-824
16. Srinivasan TN. Measuring malnutrition. Ceres. 1983 ;16:23-27
17. Donald P, Pitts G, Pohl SL. Body weight and composition in laboratory rats: effects of diets with high or low protein concentrations. Science. 1981 ;211:185-196
18. Shepherd PR, Crowther NJ, Desai M. et al. Altered adipocyte properties in the offspring of protein malnourished rats. Br J of Nutr. 1997 ;78:121-129
19. Hevener A, Reichart D, Janez A. et al. Female rats do not exhibit free fatty acid-induced insulin resistance. Diabetes. 2002 ;51:1907-1912
20. Dollet JM, Beck B, Max JP. Effect of the duration of malnutrition and of nutritional rehabilitation on blood glucose homeostasis and pancreatic hormones in rats. Br J Nutr. 1988 ;60:69-76
21. Maeda T, Sakita R, Kaihatsu T. et al. Sustained hyperglycemia and insulin resistance induced by dietary restriction. Biol Pharm Bull. 2001 ;24:950-963
22. Woodall SM, Breier BH, Johnston BM. et al. A model of intrauterine growth retardation caused by chronic maternal undernutrition in the rat: effects on the somatotrophic axis and postnatal growth. J Endocrinol. 1996 ;150:231-242
23. Tovar AR, Halhali A, Torres N. Effects of nutritional rehabilitation of undernourished rats on serum insulin-like growth factor (IGF)-I and IGF- binding proteins. Rev Invest Clin. 1999 ;51:99-106
24. Jimenez-Chillaron JC, Hernadez-Valencia M, Reamer C. et al. Β-cell secretory dysfunction in the pathogenesis of low birth weight-associated diabetes. Diabetes. 2005 ;54:702-711
25. Toyoshima Y, Ohne Y, Takahashi S-I. et al. Dietary protein deprivation decrease the serine phosphorylation of insulin receptor substrate-1 in rat skeletal muscle. J Mol Endocrinol. 2004 ;32:519-531
26. Gosby A, Maloney Ch, Phuyal J. et al. Maternal protein restriction increases hepatic glycogen storage in young rats. Pediatr Res. 2003 ;54:413-8
27. Snoeck A, Remacle C, Reusens B. et al. Effect a low protein diet during pregnancy on the fetal rat endocrine pancreas. Biol Neonate. 1990 ;57:107-118
28. Resnick O, Morgane P, Hasson R. et al. Overt and hidden forms of chronic malnutrition in the rat and their relevance to man. Neurosci Biobehav Rev. 1982 ;6:55-75
29. Gaceta Oficial del Distrito Federal. Decreto ley de protección a los animales del Distrito Federal, 26/02/02. Gaceta Oficial del Distrito Federal. 2002
30. Aguilar-Roblero R, Salazar-Juarez A, Rojas-Castaneda J, Escobar C, Cintra L. Organization of circadian rhythmicity and supraciasmatic nuclei in malnourished rats. Am J Physiol. 1997 ;273:1321-1331
31. Bartness TJ. Animal and human fat changes: measurement and interpretation. Feeding and drinking. New York: Elsevier Science Publishers. 1970:463-498
32. Escobar C, Díaz-Muñoz M, Encinas F. et al. Persistence of metabolic rhythmicity during fasting and its entrainment by restricted feeding schedules in rats. Am J Physiol. 1998 ;274:R1309-R1316
33. Hassid WZ, Abraham S. Chemical procedures for analysis of polysaccharides. Methods in Enzymology. New York: Colowick and C Kaplan. 1957:34-50
34. Waterland RA, Garza C. Early postnatal nutrition determines adult pancreatic glucose-responsive insulin secretion and islet gene expression in rats. J Nutr. 2002 ;132:357-364
35. Anguita RM, Sigulem DM, Sawaya AL. Intrauterine food restriction is associated with obesity in young rats. J Nutr. 1993 ;123:1421-1428
36. Petry CJ, Ozanne SE, Hales CN. Programming of intermediary metabolism. Mol Cell Endocrinol. 2001 ;185:81-91
37. Joshi S, Garole V, Daware M. et al. Maternal protein restriction before pregnancy affects vital organs of offsprings in Wistar rats. Metabolism. 2003 ;52:13-18
38. Triscari J, Bryce GF, Sullivan AC. Metabolic consequences of fasting in old lean and obese Zucker rats. Metabolism. 1980 ;29:377-385
39. Samra JS. Regulation of lipid metabolism in adipose tissue. Proc Nutr Soc. 2000 ;59:441-446
40. Ozanne SE, Wang CL, Petry CJ. et al. Ketosis resistance in the male offspring of protein-malnourished rat dams. Metabolism. 1998 ;47:1450-1464
41. Lucas A, Baker BA, Desai M. et al. Nutrition in pregnant or lactating rats programs lipid metabolism in the offspring. Br J Nutr. 1996 ;76:605-612
42. Dullo AG, Girardier L. Influence of dietary composition on energy expenditure during recovery of body weight in the rat: implications for catch-up growth and obesity relapse. Metabolism. 1992 ;41:1336-1342
43. Schmidt RF, Thews G. Fisiología Humana 24a. México: Interamericana. 1993
44. Claeyssens S, Lavoinne C, Vaillant JA. et al. Metabolic changes during early starvation in rats fed a low-protein diet in the postweaning growth period. Metabolism. 1992 ;41:722-727
45. Kabadi UM, Einstein AB, Strack I. Decreased plasma insulin but normal glucagon in rats fed low protein diets. J Nutr. 1976 ;106:1247-1253
46. Desai M, Byrne ChD, Meeran K. et al. Regulation of hepatic enzymes and insulin levels in offspring of rat dams fed a reduced-protein diet. Am J Physiol. 1997 ;273:G899-G904
47. Teutsch HF. Sex-specific regionality of liver metabolism during starvation; with special reference to the heterogeneity of the lobular periphery. Histochemistry. 1984 ;81:87-92
48. Gamallo JLGT, Perry MLS, Trindade VMT. et al. Effect of Pre- and postnatal protein undernutrition on glycemia, ketonemia and liver glycogen concentration in suckling rats. Ann Nutr Metab. 1989 ;33:266-270
49. Dahri S, Snoeck A, Reusens-Billen B. et al. Islet function in offspring of mothers on low-protein diet during gestation. Diabetes. 1991 ;40:115-120
50. Lee VM, Szepesi B, Hansen RJ. Gender-linked differences in dietary induction of hepatic glucose-6 phosphate dehydrogenase, 6-phosphogluconate dehydrogenase and malic enzyme in the rat. J Nutr. 1986 ;116:1547-1554
51. Vital P, Larrieta E, Hiriart M. Sexual dimorphism in insulin sensitivity and susceptibility to develop diabetes in rats. J Endocrinol. 2006 ;190:425-432
52. Holness MJ, Sugden MC. Antecedent protein restriction exacerbates development of impaired insulin action after high-fat feeding. Am J Physiol Endocrinol Metab. 1999 ;39:E85-E93
53. Petry CJ, Ozanne SE, Hales CN. Programming of intermediary metabolism. Mol Cell Endocrinol Metab. 2001 ;185:81-91
54. Reaven GM. Role of insulin resistance in human disease. Diabetes. 1988 ;34:1595-1607
Author contact
![]() Correspondence to: Carolina Escobar, Departamento de Anatomía, Edificio B 40 piso, Facultad de Medicina, UNAM, México, D.F. 04510, México. Tel: (525) 56-23-24-22 Fax: (525) 56-23-24-25 Email: escocarolinacom
Correspondence to: Carolina Escobar, Departamento de Anatomía, Edificio B 40 piso, Facultad de Medicina, UNAM, México, D.F. 04510, México. Tel: (525) 56-23-24-22 Fax: (525) 56-23-24-25 Email: escocarolinacom