Impact Factor ISSN: 1449-2288
- Issue 12; 2026
- Issue 11; 2026
- Issue 10; 2026
- Issue 9; 2026
- Issue 8; 2026
- Volume 22; 2026
- Past Issues
- Advance Articles
- Editorial Board
- Cover Images
- Index & Coverage
- Cover Suggestion
- Special Issues
1. Overview
2. Tools, Techniques and Results...
3. Current Expression Profiling...
4. But What Does It All Mean?...
5. Conclusions
Supplementary Material
Acknowledgements
References
Tables and Figures

 Global reach, higher impact
Int J Biol Sci 2007; 3(3):132-152. doi:10.7150/ijbs.3.132 This issue Cite
Review
Advances in Swine Transcriptomics
Christopher K. Tuggle1 2 3, Yanfang Wang2, Oliver Couture2 3 ![]()
1. Center for Integrated Animal Genomics, Iowa State University, Ames IA, USA
2. Department of Animal Science, Iowa State University, Ames IA, USA
3. Interdepartmental Genetics, Iowa State University, Ames, IA, USA
Received 2006-11-16; Accepted 2007-1-2; Published 2007-2-9
Abstract
The past five years have seen a tremendous rise in porcine transcriptomic data. Available porcine Expressed Sequence Tags (ESTs) have expanded greatly, with over 623,000 ESTs deposited in Genbank. ESTs have been used to expand the pig-human comparative maps, but such data has also been used in many ways to understand pig gene expression. Several methods have been used to identify genes differentially expressed (DE) in specific tissues or cell types under different treatments. These include open screening methods such as suppression subtractive hybridization, differential display, serial analysis of gene expression, and EST sequence frequency, as well as closed methods that measure expression of a defined set of sequences such as hybridization to membrane arrays and microarrays. The use of microarrays to begin large-scale transcriptome analysis has been recently reported, using either specialized or broad-coverage arrays. This review covers published results using the above techniques in the pig, as well as unpublished data provided by the research community, and reports on unpublished Affymetrix data from our group. Published and unpublished bioinformatics efforts are discussed, including recent work by our group to integrate two broad-coverage microarray platforms. We conclude by predicting experiments that will become possible with new anticipated tools and data, including the porcine genome sequence. We emphasize that the need for bioinformatics infrastructure to efficiently store and analyze the expanding amounts of gene expression data is critical, and that this deficit has emerged as a limiting factor for acceleration of genomic understanding in the pig.
Keywords: transcriptomics, microarray, porcine, quantitative PCR, bioinformatics
1. Overview
Dramatic advances in our understanding of the porcine transcriptome have occurred over the past decade, and especially in the past few years. The pig transcriptome has been analyzed to address biomedical, agricultural and fundamental biological questions, using more and more sensitive and comprehensive tools. Few reviews of porcine transcriptional profiling have been published. Blomberg and Zuelke [1] recently outlined several techniques that have been used for porcine profiling, although their focus was on serial analysis of gene expression (SAGE). This review will specifically discuss results in pigs using the major technologies of EST sequencing; PCR-centric screening, analysis and assay approaches; and array hybridization methods. Due to space limitations, in this review we will not describe the technical aspects of each technique in detail; there are many reviews and specialized resources for cDNA library and EST production; differential display PCR; SAGE; suppression subtractive hybridization (SSH); real-time quantitative PCR; and of course microarray based techniques. Further, many reports have been made using techniques such as differential display or microarrays to identify genes differentially expressed in biological states of interest. The majority of these reports use a porcine tissue or cell line to ask questions of biomedical interest, and the use of porcine-derived biological material is not directly relevant to the study. Space limitations require us to describe in detail only those efforts with broad interest to the pig genomics community. All papers found that differential display screening or the use of microarrays in assaying expression in porcine tissues report are listed in Supplementary Tables 1 and 2, respectively. Reports on EST sequencing will be discussed, but we will not discuss publications that focus on physical and/or genetic mapping of such ESTs. Finally, while still in its infancy, we will discuss published and other publicly reported work on the development and use of bioinformatics and databases to analyze porcine gene expression data.
2. Tools, Techniques and Results for Porcine Transcriptome Analysis
Porcine Expressed Sequence Tag Projects describe Significant Portions of the Swine Transcriptome
Soon after Adams and co-workers [2] suggested that the sequencing of random clones from cDNA libraries would be an effective means to obtain human gene sequence data rapidly, researchers have been reporting porcine ESTs [3, 4, 5]. Many groups have now submitted EST sequence data; Table 1 shows the projects with major contributions to global EST sequencing efforts (totaling over 564,000 entries). The NCBI UniGene website for pig (http://www.ncbi.nlm.nih.gov/UniGene/UGOrg.cgi?TAXID=9823) shows over 100 libraries have more than 250 EST sequences deposited (over 150 additional libraries with less than 250 sequences/library have been reported). These sequences come from thirteen categories of tissues, ranging from a low of 3 libraries found for the adipose, brain, and conceptus categories to 31 libraries in the genito-urinary category. In NCBI Build #25 (as of July 30, 2006), the mRNAs (4,410), high-throughput cDNAs (1,153) and ESTs (463,885) have been clustered into 37,861 UniGene sets. On the other hand, a slightly earlier build of the Porcine Gene Index (SsGI Release 12.0; June 20, 2006 (recently moved from TIGR to Dana Farber Cancer Institute; http://compbio.dfci.harvard.edu/tgi/cgi-bin/tgi/gimain.pl?gudb=pig) shows 575,730 ESTs and 6,854 expressed transcripts from a total of 257 cDNA libraries. This release identifies 64,746 tentative clusters (TCs) and 88,117 singleton ESTs and ETs. Many of these ESTs have been submitted within the past three years, showing the great strides taken recently; since January 2004 (Release 8.0), the number of TCs in the Pig Gene Index has nearly tripled. Additional information on these databases and others is discussed in the section on bioinformatics.
Largest Expressed Sequence Tag Projects in Swine
| Institution | Contact Name | Contact information | ESTs Submitted# |
|---|---|---|---|
| USDA-ARS Meat Animal Research Center | Smith TPL | smith-at-email.marc.usda.gov | 197,149 |
| National Institute of Agrobiological Sciences (Japan) | Uenishi H | huenishi-at-affrc.go.jp | 137,092 |
| Roslin Institute (U.K.) | Anderson SI* | www.arkgenomics.org | 56,364 |
| University of Missouri-Columbia | Prather RS | porcine-at-rnet.missouri.edu | 37,806 |
| Institut National de la Recherche Agronomique (France) | Tosser-Klopp G** | tosser-at-toulouse.inra.fr | 24,956 |
| Iowa State University | Tuggle CK | cktuggle-at-iastate.edu | 20,983 |
| Animal Technology Institute (Taiwan) | Lee W-C | wen-chuan-at-mail.atit.org.tw | 14,266 |
| USDA-Plum Island | Neilan JG | jneilan-at-piadc.ars.usda.gov | 14,240 |
| Oklahoma State University | DeSilva U | udaya.desilva-at-okstate.edu | 12,825 |
| Michigan State University | Ernst C** | ernstc-at-msu.edu | 12,804 |
| Nevada Department of Agriculture | Rink A | arink-at-govmail.state.nv.us | 11,556 |
| National Chung-Hsing University (Taiwan) | Huang M-C | mchuang-at-mail.nchu.edu.tw | 9,373 |
| University of Nebraska-Lincoln | Pomp D | dpomp-at-unc.edu | 5,414 |
| University of Minnesota | Murtaugh MP | murta001-at-umn.edu | 3,269 |
| Beijing Genomics Institute (PR China) | Hu S | husn-at-genomics.org.cn | 2,270 |
| STAFF-Institute (Japan) | Hamasima N | hamasima-at-gene.staff.or.jp | 2,155 |
| Danish Institute of Agricultural Sciences | Bendixen C | Christian.Bendixen-at- agrsci.dk | 1,344 |
| Royal Veterinary and Agricultural University (Denmark) | Fredholm M | mf-at-kvl.dk | 1,326 |
| Royal School for Veterinary Studies (UK) | Hopwood PA | info-at-arkgenomics.org | 1,085 |
| Total ESTs submitted | 566,277 | ||
| # Submitters with >1,000 ESTs submitted from libraries with >250 ESTs; as of June 20, 2006 in Dana Farber Cancer Institute SsGI, Release 12.0 | |||
| *Other RI submitter contact: Archibald AL (alan.archibald-at-bbsrc.ac.uk) | |||
| **Other INRA submitter contact: Bonnet A (abonnet-at-toulouse.inra.fr) | |||
| ***Other MSU submitter contacts: Suchyta SP (suchytas-at-msu.edu) and Coussens P (coussens-at-msu.edu) | |||
In addition to the many uses for such sequencing data that can be made in structural biology and in mapping genes, this large amount of data has also been used to estimate the level of expression of a gene by calculating the number of instances when the transcript has been randomly sequenced in a library. While care must be taken in such comparisons to use non-normalized libraries and EST data of sufficient size, several authors have discussed such estimates. Davoli and co-workers [6] used EST sequence frequencies to compare to equivalent data for human transcripts to characterize their skeletal muscle library; similar estimates were performed by Smith and others [7] to identify highly expressed genes in early embryo. Several groups [8, 9, 10] have used data from non-normalized libraries to estimate such “virtual expression patterns” across multiple tissues or developmental stages. Using sequence frequencies, we were able to identify genes that are expressed highly selectively in one tissue, as well as genes changing expression during embryonic development through calculating frequencies in libraries created from different embryonic stages [8]. Jiang and colleagues [9] identified sequence clusters that were over-represented across specific stages of ovarian follicle development and between growing follicles and corpora lutea. Whitworth and others [10] recognized genes showing differential frequency in very early embryogenesis, finding many transcripts with different frequency in comparisons between unfertilized oocytes and 4-cell embryos, and between these embryos and the more differentiated blastocysts. Interestingly they found transcripts with different frequency between in vivo and in vitro produced four cell embryos as well as between in vivo and in vitro blastocysts. Differential frequency has also been used by several groups [8, 11, 12] to determine the efficacy of normalization of cDNA libraries, which is performed to remove the highly expressed (and therefore high frequency) transcripts, allowing for increased efficiency in finding new gene transcripts through random EST sequencing. Finally, both UniGene and SsGI (now the Dana Farber Cancer Institute Pig Gene Index) provide global views of gene expression levels based on EST frequency (see later section).
Through comparison of frequencies of ESTs across species, it is possible to identify species-specific differences in expression. Zhao et al. [13] identified a highly expressed transcript in porcine placenta (1 % of ~4,500 placenta and early conceptus sequences available) which had no ortholog in the human EST database, although hundreds of thousands of placenta sequences had been deposited. A highly similar sequence was present in the human genome, with a conserved open reading frame. Further cDNA sequencing and RACE-based transcript mapping analysis of this gene (PLET1) in human, mouse and pig placenta was performed and it was determined that the human gene is expressed, but not spliced due to mutations in splicing signals, thus very few transcripts for human PLET1 appear in cDNA libraries. This study is one of the first examples of the use of porcine EST frequency data to identify a splicing-defective gene in the human genome [13].
Serial Analysis of Gene Expression in Porcine Tissues
Another sequencing-based method to estimate transcript abundance is serial analysis of gene expression (SAGE). This is a powerful approach whose sole purpose is developing a statistically robust estimate of the relative amounts of expressed sequences in the genome of interest; no cDNA clones or libraries are created. Double-stranded cDNA is digested with specific restriction enzymes, adapters are ligated to cDNA fragments, and the resulting fragments are concatenated and sequenced extensively to obtain sequences for tens to hundreds of thousands of 10-20 bp sequence “tags”. These tags can be mapped back to known cDNA sequence and the resulting data is analyzed for relative abundance. Blomberg and colleagues [14] have applied SAGE to determine the content and expression pattern of developing porcine conceptus at the critical stage of peri-implantation, where the developing conceptus goes through a remarkable morphological elongation stage just prior to implantation. They identified over 400 putative transcripts with differential expression between ovoid (before elongation) and filamentous concepti, and identified several pathways involved in this process, including steroidogenesis and oxidative stress response. In a follow-up paper, they describe the production of SAGE libraries for tubular conceptus and a comparison of non-amplified and amplified SAGE libraries, which showed that amplification, a useful procedure when tissue is limiting, can be used to generate SAGE data accurately reflecting transcript levels similar to non-amplified libraries [15]. They then compared expression patterns between this intermediate conceptus form and the ovoid and filamentous expression patterns, and identified over 600 genes with putative differentially expression between at least two stages. Genes differentially expressed at all stages had GO annotations for involvement in cell cycle, cellular organization, cell-cell interaction and general metabolism. Specific differentially expressed or constitutively expressed genes involved in tissue remodeling, glycolysis, cell cycle and tissue/cell type differentiation were further studied; many patterns, but not all, were confirmed by QPCR. In most cases of dissimilar results between SAGE and QPCR, the QPCR results was in agreement with one but not both stage-differences (ovoid versus tubular but not tubular to filamentous, etc.), and the authors remark that these differences may be due to unknown splicing variants which may be resolved once further information on the porcine genome sequence becomes available [15].
Screening for Differentially Expressed Genes using Differential Display and Suppression Subtractive Hybridization Technology
“Open-ended” techniques such as differential display (DD) and suppression subtractive hybridization (SSH) have been used to profile the transcriptional response to various treatments or to contrast tissues or other variables. Such screening techniques are complementary to “closed” profiling technologies such as microarrays as they allow the discovery of novel, heretofore un-sequenced transcripts. The DD technique uses specific primers to amplify specific subsets (reduced representations) of the total mRNA pool of a cell or tissue, allowing resolution of a limited number of PCR products for each specific primer pair on a sequencing gel. These PCR products can be compared by side-by-side electrophoresis of PCR products amplified from RNAs representing different tissues or treatments to be compared/screened. Research using DD to screen porcine transcripts have been published starting in 1996 and reported from 1-20 differentially expressed products/genes. The majority of these reports (over 20) focused on biomedical research question, using porcine cells or tissues. Due to space limitations, these papers will not be discussed here, although all papers are listed in Supplementary Table 1. On the other hand, papers reporting the characterization of larger sets of genes, from about 50 to 200 or more genes, began appearing in 2001. These reports describe the use of DD to study response to viral infection; liver-specific expression and hepatic response to dietary changes; and gene expression changes in response to selection for improved reproductive traits. These six papers will be summarized here.
Wang and colleagues [16] identified 48 total ESTs that increased (35) or decreased (13) their expression in alveolar macrophage cells as a result of porcine reproductive and respiratory syndrome virus (PRRSV) infection. Differential expression for seven genes was tested and all confirmed by Northern blot analysis of infected or mock-infected macrophages. Of interest was the finding that the majority of the annotated genes in this group were mapped to metabolic and physiological pathways; only one EST was clearly annotated as an immune response gene (inflammatory mediator gene chemotactic factor II) and this gene was down-regulated by PRRSV [16]. In a recent report, also investigating host response to viral infection, Bratanich and Blanchetot [17] used DD to study genes differentially expressed in lymph nodes between healthy piglets and those suffering from porcine multi-systemic wasting syndrome (PMWS). These authors sequenced and confirmed nine DD products that were found only in the affected animals or showed an increase in PMWS animals as compared to controls. Northern analysis of two genes, hyaluronan-mediated motility receptor (RHAMM) and RNA splicing factor, further confirmed the expression response for these two genes [17].
Two groups have successfully applied DD to study liver gene expression. Ponsuksili and co-workers [18] used DD to screen for genes selectively expressed in liver, in order to identify candidate genes for metabolic traits. In a comparison of normal liver and nine other tissues, they found 240 candidate EST fragments that were expressed only in liver or predominately in liver with up to 4 tissues showing expression. These fragments represented 200 known (91) or unknown (109) transcripts. Most of the genes represented by multiple clones were known to encode proteins that are secreted by the liver into the bloodstream. Multi-tissue Northern blot analysis confirmed the expression pattern for complement component 3 (C3), while semi-quantitative PCR confirmed C3 and an additional 14 genes [18]. A second group [19] exploited the DD technique to find genes whose hepatic expression was altered by feeding pigs on a restricted protein diet formulated using either casein (CAS) or soy protein isolate (SPI). This group identified and confirmed 86 differentially displayed PCR products, of which 44% has similarity to known genes. Nearly all of the known genes were annotated to pathways expected to be involved in the restricted diet, including protein and amino acid metabolism, oxidative stress, regulation of gene expression, fat and energy metabolism and others. Schwerin and collaborators further showed that six genes involved in stress response were differentially expressed between pigs fed the two diets, with five of six genes showing higher liver expression in the SPI-fed pigs over the CAS-fed pigs. The authors proposed that one reason for this stress response in the SPI-fed animals is the amino acid imbalance in this diet, as compared to the CAS-based diet [19].
Finally, two reports looking at gene expression changes due to selection for improved reproductive traits were published recently. Gladney and colleagues [20] used DD of ovarian follicles to identify genes differentially expressed in control animals as compared to animals in a population selected for improved litter size based on ovulation rate and embryo survival. Tissue was collected at 2 or 4 days post prostaglandin F2alpha injection, which was used to synchronize follicular development. Overall, 84 DD products were identified and sequenced; the majority of which were predicted to differentially expressed although several equally expressed transcripts were also characterized. Four genes were confirmed as DE by Northern blot. Of interest was the finding that calpain I light subunit (CAPN4) expression was lower in the select line as compared to controls. As the similar small subunit calpain gene ACG-2 has been linked to apoptosis, the authors speculate that a decrease in CAPN4 expression in the select line could lead to decreased apoptosis and to a larger number of follicles available for ovulation [20]. The same group published a companion paper, using DD to look at changes in anterior pituitary expression in the same selection line and controls [21]. Anterior pituitary tissue was collected similarly to the follicles above, and DD analysis was performed on tissue pooled across PGF2alpha treatment days. A total of 162 bands were successfully sequenced, representing 125 distinct sequences, a majority of which (58%) had sequence similarity to annotated genes. Three genes were validated by Northern blot, demonstrating that follicle stimulating hormone beta (FSHB) increased expression in the selection line, while both ferritin heavy chain and G-beta-like protein genes decreased expression relative to controls. The former finding is interesting, as FSHB has a direct role in increasing the development of mature ovarian follicles, and this clearly indicates FSHB may have been a direct target of the selection applied to this population [21].
Another useful approach to gene discovery is SSH. This approach uses hybridization of an excess of “driver” cDNA (from one state/treatment) to remove sequences in the “tester” cDNA (from the other state/treatment) that are present in both populations in similar amounts. Highly differentially expressed sequences can be enriched for by preferential recovery of the resulting set of un-hybridized “tester” cDNAs. The tester and driver cDNA populations can be reversed, to allow screening for both up- and down-regulated genes. This technique was used by Narayanan and co-workers to [22] identify genes with altered abundance at different stages of the conversion of hepatocyte cells in culture into spheroids, an aggregate of cells that is functionally similar to liver tissue. This group identified 65 genes and 14 novel sequences and deposited 70 ESTs; demonstrating the down-regulation of cytochrome P450 family members as well as genes involved in heme biosynthesis, and the up-regulation of acute phase proteins and genes encoding proteins involved in Ca-dependent vesicle trafficking. Ross and co-workers [23] have used SSH to screen for genes differentially expressed during porcine conceptus elongation, a process important for efficient implantation in the pig. This group reported 142 sequences that changed expression levels during elongation; they deposited 16 distinct sequences to GenBank. Decreased expression during elongation was observed for several ribosomal RNAs, and an increase was seen for IL1B, thymosin beta 4, mitochondrial proteins, HSP70 and S-adenosyl homocysteine hydrolase (SAHH). The latter two genes, as well as an un-annotated transcript, were verified by QPCR. SAHH is part of the pathway to generate folate, an essential metabolite for embryogenesis, which is known to increase in the uterine lumen at the elongation stage of conceptus development [23]. Other studies of reproductive biology have used SSH as well. Bonnet and colleagues [24] isolated transcripts responding to follicle stimulating hormone (FSH) treatment of granulose cells in culture. Sixty-four independent sequences predicted to respond to FSH were further analyzed and 25 transcripts were confirmed by Northern or QPCR to be regulated by FSH. Annotation of these 25 genes shows FSH may alter pathways controlling peroxidase activity and chromatin remodeling [24]. To study the mechanism of heterosis, Xu and collaborators [25] exploited SSH to identify genes expressed differently in Longissimus dorsi tissue between Yorkshire dams and their Landrace x Yorkshire offspring. The HUMMLC2B gene was identified and confirmed by semi-quantitative PCR methods to be higher in the dam compared to her cross-bred offspring. The HUMMLC2B gene was expressed equally throughout muscle development (fetal to 6 month old samples were tested) and expression was found primarily in skeletal muscle tissue. As HUMMLC2B has been implicated in Ca+2 dependent signaling pathways, and a down-regulation was seen in the F1 hybrid offspring, these results may indicate Ca signaling influences porcine heterosis traits [25].
Finally, researchers screening for genes responding to Salmonella enterica serotype Choleraesuis (SC) inoculation have reported the use of SSH to identify 88 sequences that change expression at 24-48 hours post-inoculation in mesenteric lymph nodes [26]. Seven SSH-identified and two related genes were selected for further study and all were verified by quantitative real-time PCR. The differential expression of these genes indicate that modulation of cytoskeletal components and heat shock pathways are involved in the host immune response to SC in the porcine mesenteric lymph tissues [26].
Quantitative PCR Methods as the “Gold” Standard in Confirming Differential Expression Results
There have been many reports of quantitative real-time PCR (QPCR) being used to measure the abundance of porcine transcripts. Many recent publications focus on a small number of genes in the context of verifying differential display results [27, 28], as well as microarray or other profiling data (see specific results in the following microarray section), as QPCR has been the standard technique used to validate such results. This comparison is not as direct as one might wish, as properly run QPCR measures the abundance of a single transcript or transcript segment. Thus microarray data, which may result form hybridization of multiple transcript isoforms to a probe or probes on an array, may not be confirmed by a QPCR assay even though the microarray data is not necessarily incorrect. In fact, some microarray-based technologies, such as the Affymetrix platform, have multiple oligonucleotides that interrogate multiple locations along a gene transcript. Thus data may be available to identify differential abundance of different segments of transcripts, allowing measurement of differential expression of splice variants. On the other hand, QPCR is clearly more sensitive and often shows an increase in the level of difference (fold change) between the class or treatments being compared than seen in microarray data. It is therefore important to recognize both the strengths and weaknesses of each of these techniques in such confirmation studies.
QPCR is traditionally not viewed as a high-throughput screening tool, due to lack of a large sets of specific assays available for porcine transcripts as well as the relatively high cost per gene and biological sample assayed. Recently, however, a large number of validated QPCR assays have become publicly available (http://www.ars.usda.gov/Services/docs.htm?docid=6065) through the efforts of a collaborative group headed by Harry Dawson and Joan Lunney at USDA-ARS-Beltsville. This group has developed and tested 474 QPCR assays based on the Taqman fluorescent dual-labeled probe technology (PIN database v. 3.7 as of October 2006; H. Dawson, personal communication). These assays focus on genes in immune and nutrition/metabolic pathways, but include assays for many signaling molecule of general interest. Dawson, Lunney and co-workers have used such high-throughput QPCR to assay expression of many genes responding to pathogenic parasites [29], PRRSV vaccination [30], and have contributed nearly 150 QPCR assays to recent microarray confirmation studies by our group [31, 32, Wang et al., submitted] described below. Other groups have used a significant number of QPCR assays to validate microarray data, including Passerini et al. [33] (27 genes); Ponsuksili et al. [34] (10 genes); and Okomo-Adhiambo et al. [35] (10 genes); these papers are discussed in the microarray section.
The QPCR technique can, of course, be used to measure gene expression independently of microarray confirmation. Examples where 4 or more genes were quantitatively assayed with or without microarray data include measurement of response to LPS [36], to infection [26, 29, 37, 38], or to islet graft rejection [39]; measurement of promoter activity in vitro [40, 41]; assessing expression of gene family transcript isoforms [42]; measuring responses during parthenogenesis [43, 44] or oocyte/conceptus development [23, 45]; brain response to early weaning/isolation [46, 47]; multi-tissue response to carnitine treatment [48] or liver response to dietary treatments [28, 49]; differences across specific muscle types [50]; and differences between stented and unstented arteries [51].
Microarray Hybridization Studies have Dramatically Expanded our Knowledge of the Porcine Transcriptome
The use of miniaturized arrays of individual gene sequences to survey or “profile” the expression levels of hundreds (later; thousands) of transcripts within a cell or tissue was first published by Schena et al. [52], although reports of larger dimension element arrays (dot blots, etc.) had already been published, including early work on porcine muscle EST expression patterns [3]. The main technological advances by Schena and colleagues were 1) the use of robotics to place very small amounts of gene sequences very closely together, minimizing reagent use and allowing the use of standard size glass microscope slides as the solid substrate, and 2) the independent labeling, by fluorescent substrates, of the of the RNA samples to be compared, allowing for simultaneous measurement of hybridization of labeled cDNA to each probe on the array. Initially, the criteria for finding DE genes in the comparison at hand was limited to an intuitive but statistically unsupported two-fold difference in fluorescence levels. Later, additional experimental designs and data analyses became statistically rigorous. Such analytical methods have become a significant field unto themselves [53].
Much of the data and publications described below are in the very early stages of understanding RNA expression profiles, as the field of transcriptional profiling is relatively new, and especially so for work in the livestock species. Many early papers were limited in scope, with relatively few elements and scarce biological replication, which is critical for adequate statistical rigor. Initial insights as to new aspects of tissue and cellular function have been gleaned from pig microarray data, and connections between datasets are made where possible and appropriate. However, an increased depth of data as well as more comprehensive tools will be required to fully comprehend and integrate the massive amounts of data already collected across many different tissues, systems and perturbations. Different platforms for porcine expression profiling have been used; these are listed in Supplementary Table 2 and briefly described below. Most of this work used two-color analyses, labeling RNA samples using fluorescent Cy3 or Cy5 conjugated nucleotides and performing a dye-swap, in which samples are labeled with each dye and used in separate hybridizations to eliminate dye effects. Cy3 and Cy5 have different excitation/emission wavelengths, allowing for independent collection of hybridization data from each sample on the same array element. Further, most work described below used a normalization method called LOWESS, (Locally Weighted Scatterplot Smoothing), which corrects for intensity-dependent variation in data. These methods will serve as the default in the discussions below and are not described; however, if some other system and analysis is used, it is mentioned below. Statistical methods to identify DE genes across treatments vary, although ANOVA methods and corrections for multiple testing using false discovery rate calculations appear to becoming the standard. As these methods greatly affect the results, they are noted in the descriptions of experiments. Finally, annotations of DNA elements on the array are an important and growing area of research. Such annotations are most often based on sequence similarity to genes whose function is known or has been inferred, in turn, from other gene with similar sequence in another species. Functional annotations can also be obtained from curation of available biological data as complied for genes and pathways at NCBI (http://www.ncbi.nlm.nih.gov/Entrez/query.fcgi?db=gene) or at Mouse Genome Informatics; http://www.informatics.jax.org/). At the Gene Ontology (GO) Consortium site (http://www. geneontology.org/), annotation of a gene's function, where in the cell it performs this function, and its involvement in specific biological processes, can be found. Software to assign GO annotation to gene sequences, such as the DAVID software at NIH (http://david.abcc.ncifcrf.gov/), are very useful and many are freely available. Such functional annotation can be especially helpful in annotating a set of gene sequences that respond similarly to specific treatments; such sequence groups or “clusters” can be identified using a number of clustering algorithms; see the review by Quackenbush [53] for a discussion of current work in this area. In the database section below, we discuss some of the methods being used to evaluate the biological knowledge available on specific genes and groups of genes that are found to be co-expressed. Specific methods used by investigators are also noted in the descriptions below.
Every effort was made to include work published that used microarrays to determine porcine expression profiles. Seven different groups also graciously provided summary details of fourteen different unpublished microarray projects (see Supplementary Table 2). These unpublished projects include studies on reproduction (5); muscle traits (3); genetic effects on expression (2), and host response to infection (2), antibody treatment (1), or stress (1).
3. Current Expression Profiling Results in Porcine Tissues and Cells using Microarrays
Muscle Expression Profiling
Microarray studies have been used in several species to better understand the changes in gene expression during livestock muscle growth and development [54], and the pig is no exception. One of the first large-scale profiles of porcine skeletal muscle was published by Moody and colleagues [55]. They used a nylon membrane spotted with human cDNA fragments and hybridized this membrane with human and porcine skeletal muscle cDNA. They found that approximately 48% of the spots provided no signal; however, they also established that the hybridization signals were reproducible within sample for both human and pig RNA, and that concordance of results between species high. As this was a test of cross-hybridization, no expression contrasts were reported, but the authors concluded that cross-hybridization appeared promising [55].
Another group has used a cross-species approach to investigate porcine skeletal muscle gene expression. Lin and Hsu [56] used a human cDNA microarray to identify genes differentially expressed (DE) between Duroc and Taoyuan Longissimus dorsi (LD) tissue. They identified 6,400 DE genes with signal 2.5 fold higher that background for both breeds. They used correlation analysis to show a high level of reproducibility as had been found by Moody et al. Among these expressed genes, 117 were found to differ between breeds (p < 0.05), less that one would find by chance (~ 460 genes). Nevertheless, of the eight genes selected for verification by QPCR, all were confirmed. The majority of DE genes had higher expression in Duroc pigs, including genes for ribosomal proteins, heat shock proteins and myofibrillar proteins, and genes involved in transcription/translation and metabolism-related genes. The authors indicated that the higher proportion of proteins involved in myofibrillar structure in DE genes in Duroc over Taoyuan could explain Duroc higher muscle growth. They further showed that SLIM1, a known myogenesis control factor, was over-expressed in Duroc, providing further clues as to the increased muscle growth rate in Duroc [56].
A different pioneering approach for skeletal muscle profiling was reported by Bai and others [50], where a porcine microarray, consisting of un-sequenced cDNA clones from fetal and neonatal LD tissue libraries, was used for expression profiling of LD (as a white muscle type) as compared to psoas muscle (as a red muscle type). Genes identified as having muscle-type specific expression were defined as those having a normalized psoas/LD ratio of > 2.0 or < 0.7, and these cDNAs were then sequenced and annotated. Genes with a high psoas/LD ration (70 clones) included 16S and 18S ribosomal RNAs and NADH dehydrogenase subunits 3 and 6, fructose-1,6 bisphosphatase and members of the casein kinase 2 complex or targets of that pathway. Many genes highly expressed in LD (50%) included many of the fast isoforms of muscle fiber proteins and about 25% included genes involved in glycolysis such as GAPDH. In the last 25%, the authors highlighted the tumor suppressor gene, bin1, as it has been linked to myoblast differentiation in culture. Four genes predicted to be DE (GAPDH, bin1, MyHC2b and one novel gene) were tested by QPCR and all were confirmed, although bin1 was higher in LD in only 3 or 4 pigs tested. The authors propose that this method of arraying non-sequenced clones is useful in finding genes DE in species with little genome characterization [50]. However, as this lack of information eases, this advantage becomes less important and the inefficiencies on spotting duplicate unknown cDNAs become significant. Members of this group used the same array to investigate the molecular changes in response to dietary restriction (20% less protein, 7% less energy, termed the LPE diet) in porcine LD and psoas muscles [57]. In both muscle types, the LPE diet resulted in higher intra-muscular fat and caused twice as many genes to show higher expression as compared to the control diet treatment. The authors sequenced these DE genes and identified genes involved in turnover of protein, fat and carbohydrate, as well as genes involved in growth, mitochondrial function, translation and glycolysis. QPCR analysis verified the microarray data for several genes and indicated several systems were involved: the increase in intramuscular lipid (phytanoyl-CoA- hydroxylase and delta 9 desaturase); energy (creatinine kinase); fiber type specificity (MyHC2a, 2b); and muscle growth (cbl-b, kc2725, P311). The P311 gene, increased by LPE diet in both muscle types, is interesting as the authors further showed that P311 was increased during C2C12 myoblast differentiation [57].
The use of sequenced porcine ESTs to create an expression profiling tool was first published by Zhao and others [58]. This group initially arrayed known ESTs and tested for detectable hybridization signal using muscle RNA from two fetal ages [day (d) 75 and d105] and two postnatal ages (1 week and 7 week) as targets. The ESTs that provided a clear signal were re-arrayed to generate the test array, which was then used to profile the fetal (d75) and postnatal (1 week) targets. A mixed linear model was employed to identify 28 genes with stage-specific expression (defined as two fold difference in expression between stages with P < 0.01). Of these, 19 genes matched known human genes, and included elongation factor 1 alpha, a number of ribosomal proteins (12), GAPDH, and structural proteins such as vimentin and tubulin. Five of these genes were tested and confirmed by Northern blot analysis of RNA representing seven stages of muscle development, from d45 to 7 week postnatal. The results with intermediate filament (IF) protein family members vimentin and desmin (tested as an additional control) confirmed protein-level data [59] that vimentin expression dramatically decreases during prenatal muscle development while muscle-specific IF protein desmin increases. The authors conclude their membrane and radioactive-labeling approach is a low cost and accurate expression profiling method to find DE genes of biological interest [58].
Two papers that appeared recently studied myogenesis by using an array containing cDNAs selected for their roles in myogenesis, energy metabolism, and myofibrillar structure, as well as additional skeletal muscle ESTs. The first paper [60] reported the expression pattern for these genes during seven stages of gestation, d14 to d91, covering the two stages of myogenesis in the pig (d30-60 and d54-90). Taking advantage of known annotations, genes were divided into functional groups for analysis. Genes both stimulating and inhibiting muscle differentiation as well as muscle structural genes had a peak of expression at d35, and declined thereafter. Genes in the glycolysis pathway decreased early then had a peak of expression at d77. The number of genes showing expression from d14 to d91 increased for the myofibrillar group, while the number of expressing myogenesis-affecting genes and differentiation-stimulating genes decreased from d14 to d49, then increased from d49 to d91. The expression pattern of five genes presenting the major annotation groups (myogenesis: EPO-receptor, beta-catenin, and TGF beta2; energy metabolism: GAPDH; and structural: COL3A1) was tested and confirmed by QPCR, although statistical analysis of these data was not described [60]. In a second paper, Cagnazzo and collaborators used the same microarray and tissue sampling to compare expression between the Duroc and Pietrain breeds [61]. The authors found that energy metabolism genes were consistently higher in Pietrain over Duroc for all ages except d35 in which this ratio was reversed. On the other hand, fatty acid metabolism genes had the opposite profile: higher levels in Duroc from d14 to d49, then higher in Pietrain at later ages. They found myogenesis apparently initiated earlier in Duroc pigs, as the expression of proliferation and differentiation genes was higher at d14 and d35 in this breed; this was reversed at later stages. Muscle structural genes also showed higher expression in early Duroc embryos, and after d49 expression was higher in Pietrain samples. The same five genes as assayed in te Pas et al. [60] were tested by QPCR and all results were consistent with the microarray data, although, as for the te Pas paper, no statistical analysis was discussed. The authors conclude that, as a delay in fiber formation has been associated with higher fiber numbers in other species, their finding that Pietrain myogenesis is delayed relative to Duroc may explain the Pietrain higher adult muscle mass [61].
Two reports have been published looking at porcine heart gene expression as a model for human disease. Lahmers and co-workers [62] used a novel array consisting of 50 mer oligonucleotides representing each of the 363 exons of the enormous human titin gene. They investigated rabbit, mouse, rat, and pig myocardial gene and protein expression from adult left ventricular tissue. In preliminary validation using pig soleus adult tissue, they found that 92% of the exons expressed in human soleus were also expressed in the corresponding pig muscle. For pig myocardium, the authors reported ~20 exons were fetal-specific and these were very similar to human fetal-specific exons [62]. In the second report, Lai et al. [63] used a human cDNA microarray to determine genes whose expression changes during atrial fibrillation. Nearly 500 genes showed DE, with genes annotated in cell signaling and cell communication over-represented, while the second largest group were genes involved in gene regulation. A single gene, MLC-2V, was tested and confirmed by QPCR. The authors indicate that many of these genes had not previously been associated with atrial fibrillation, and thus further study on these genes is warranted [63].
Reproductive Tissue Expression Profiling
A number of papers have been published in the past two years on the use of microarray to study reproductive tissues, primarily the ovary (3) uterus (1) and testis (1), but also on the developing embryo/conceptus (2). As described above in the DD section, Gladney and colleagues [20] have studied the expression profile in ovarian follicles collected from animals selected for improved litter size and in a random-bred control population. In addition to DD, microarray analysis of pooled follicles from these two populations was performed by using two different Incyte UniGEM human cDNA microarrays. Based on two-fold differences only, they identified 33 and 21 DE genes using these microarray platforms, and found little overlap in the two lists of genes. Northern blot analyses of three genes (follistatin (FST); early growth response 1, nuclear family receptor 4A1(NR4A1)) confirmed the microarray results for FST and NR4A1 [20]. This group has built on this early work, using a porcine cDNA microarray to profile the expression pattern of ovary and follicle tissue from the select and control lines of pigs [64]. A mixed-model analysis identified 72 ovary and 59 follicle genes DE between these two lines. In contrast to the data obtained with the human microarrays, 32 genes (about half of the total) were found DE in both tissues, providing a measure of confidence in these results. Northern hybridization using probes for calpain light subunit I and cytochrome p450scc (P450scc) genes were used to confirm the microarray data for both genes. Overall, the lists of DE genes contained both genes known to be expressed during folliculogenesis as well as genes not previously associated with this process. The authors highlighted DE genes involved in steroid biosynthesis (Collagen type I receptor, P450scc, STAR, 3betaHSD, CYP17 and CYP19) and tissue remodeling (PAI1) that could provide mechanistic clues for the difference in ovulation rate seen between these lines, and they indicate further ontogenic studies of these candidates would be helpful in such interpretations [64].
Gene profiling was used successfully to study the process of luteinization by comparing pre-estrous preovulatory ovarian follicles to luteinized follicles on day 2 of estrous prior to ovulation [65]. A custom porcine cDNA microarray was created from clones selected from the ovary EST library project described above [9]. Microarray data collected on these two types of follicle was produced using a reference design; the reference was an RNA mixture from all follicular stages, and data normalization and the Welsh t-test were used to identify 150 DE genes (P < 0.01) between follicle stages. The authors reported the major classifications for the 107 genes decreased from pre-estrous to luteinized post-estrous follicles were cytoskeletal structural and regulatory proteins, chromatin component and nucleic acid-binding proteins, metabolic enzymes, oxidative response proteins, cAMP receptor pathways proteins, and cell proliferation/differentiation pathways proteins. For the 43 genes increased in the same comparison, the major annotation groups were cell adhesion; migration, growth inhibition; and angiogenesis. Some functional categories were observed in both lists, including different genes involved in steroidogenesis, proteolysis and metabolism. In validation work, four genes (CYP17A1, 3beta-HSD, LHCGR, and PLANH1) were tested by QPCR and results showed similar patterns to the microarray data, although statistical evidence was not discussed. The authors note that many genes, whose function and expression patterns were known previously to be involved in folliculogenesis, were identified in this analysis and this further validates their results. Many of the identified genes were novel with respect to luteinization, however, and are interesting candidates for future study of this process [65].
Two manuscripts have been published on expression profiling in the developing porcine embryo. Lee et al. [66] used a custom cDNA membrane array to initiate microarray studies on the elongating, peri-implantation embryo, a morphological transition critical for successful implantation. Concepti from four stages of this transition (small spherical, large spherical, tubular and filamentous forms) were collected and profiled using the above array. The minimal quantities of embryo tissue available required an amplification step; preliminary hybridizations with un-amplified and amplified material indicated amplification did not introduce bias. Nine genes were declared as DE using three criteria. Two genes met the stringent Bonferonni test for multiple testing, four genes were DE at p <0.001, while the remaining three genes had p < 0.01 and at least a two-fold difference in expression between stages. Four genes covering these three categories (STAR, TGFbeta3, interleukin 1 beta (IL1B), and thymosin beta 10) were selected for QPCR confirmation and all four showed statistically significant differential expression in both QPCR and hybridization data. The IL1B results confirm reported SSH [23] and EST frequency data [7, 8] and the thymosin beta 10 results agreed with data reported by Smith et al. [7]. Further, the STAR gene has been shown to increase in expression by SAGE data [14] and by follow-up Northern, QPCR and protein level analysis by the same group [15]. These confirmations verify the results of the Lee et al. study [66], which contributed additional genes for understanding of the rapid transition spherical to filamentous conceptus which is nearly unique to the pig.
Whitworth and others [67] developed a custom cDNA array containing genes collected from cDNA libraries from ovary, embryo, oocyte, oviduct, uterus, conceptus and fetus, to determine genes DE across several stages and modes of embryogenesis. These included in vivo produced germinal vesicle oocytes (pgvo), four cell embryos (p4civv) and blastocysts (pblivv), as well as in vitro produced four cell embryos (p4civp) and blastocysts (pblivp). An ontogenic study from oocyte to blastocysts (all in vivo samples) showed ~ 2,000 to 4,500 DE genes. A comparison of in vivo to in vitro embryos identified 1,409 (p4civv versus p4civp) and 1,696 (pblivv versus pblivp) DE genes. False discovery calculations for the latter two comparisons eliminated nearly all of the DE genes, and a condition tree clustering did not show evidence that in vitro expression patterns could be easily distinguished from the in vivo patterns. In the ontogeny study results, similar clustering showed each stage correctly clustered together and that, as expected, the two earlier stages clustered more closely together. QPCR validation of seven genes from these comparisons was performed and of the 21 pair-wise comparisons available in the microarray data for these seven genes, 20 were confirmed by QPCR. The authors found that genes induced in the transition from germinal vesicle to four cell embryo were similar to those reported for the same transition in the mouse, and included nuclear structural and functional proteins, while genes decreased during this transition included those involved in cell adhesion receptor activity, mitotic cell cycle, transporter activity and M-phase microtubule activity. Genes increased in blastocyst as compared to 4 cell embryos included ribosome, hydrogen ion transport and cation transport activities. Many examples were discussed showing much of this data is similar to that reported in the mouse, although many differences between pig and mouse profiles were observed. The authors correctly note that this analysis is just the beginning of understanding the transcriptional program during early embryogenesis [67].
This group has also used this array to investigate gene expression changes during the estrous cycle and pregnancy in the porcine endometrium [68]. They collected RNA at seven times during the estrous cycle (0, 3, 6, 10, 12, 14, and 18 days post-estrous), and used a reference design to identify genes DE across the estrous cycle. The reference RNA consisted of a mixture of RNA from the tissues used to make the array, see above. Genes were identified as DE using ANOVA with Benjamini-Hochberg correction to control for multiple testing, with the added criteria that the gene must be at least twice as abundant as seen in the reference. The number of DE genes varied by day of estrous, with a minimum of 118 genes on day 0 and a maximum of 542 genes on day 12. Clustering of these genes using k-means methods identified six main patterns of expression across the estrous cycle. Several of these patterns (i.e., DE on day 0; DE on days 3 and 6; DE on days 10-14) are coincident with specific known functions of the endometrium: a) sperm maturation; b) blastocyst growth and position; c) conceptus development and attachment, respectively. They also used EASE software to connect GO terms to these clusters, where, for example, in the day 0 cluster immune cell markers and cytokine genes predominated; within the day 10-14 cluster, many DE genes were annotated with tyrosine receptor kinase activity function. Using cluster and EASE results as a guide, seven genes were selected for QPCR based validation; all resulting QPCR data was consistent with the microarray results, although statistical significance of the QPCR results was not discussed. The authors conclude that these data on the global expression patterns with the cycling uterus will guide transgenetic and cell transfer approaches to improve reproduction efficiency [68].
Finally, Stewart and colleagues have reported [69] the use of a human cDNA microarray to assess testicular expression patterns in boars differing in steroidogenesis levels. The RNA from animals (n=4) with known high plasma estrone was directly compared to RNA from low plasma estrone boars in paired hybridizations. Genes with statistically significant differences between the two states were identified using Student's t-test and Benjamini-Hochberg correction for multiple testing. Seven genes were found by this method to be more highly expressed in the high estrone boars (p< 0.05). Five of the genes tested were verified as DE using QPCR, and included CyB5, Cyp19A1, SAT, FTL, and DNASE1L1; the authors note that the fold changes were much higher than those observed in the microarray data [69].
Immune Response Expression Profiling
The immune response is highly complex, with multiple tissues and cell types communicating information that is contextual and changes during early inflammatory stages as well as during inflammatory resolution and the adaptive immune response, and changes can also be long-term through immune memory. Hammamieh et al. [70] have developed useful data on variability among pigs within peripheral blood mononuclear cells (PBMC). Using a human cDNA membrane array, they measured the PBMC expression profiles of ten Yorkshire piglets. They found 19 DE genes, which were annotated as stress response, immune response, and genes involved in transcription. This group then used this same array in a follow-up paper comparing expression profiling of human PMBC exposed in vitro to staphylococcal enterotoxin B (SEB) to profiling data of PBMC from piglets intoxicated with SEB to LD95 in vivo. Using a supervised learning procedure for class prediction to compare these two datasets and by using a separate training dataset of gene expression profiles of human PBMC infected with eight separate pathogens, they were able to identify a set of 16 genes predictive for SEB exposure [71].
A separate group has also reported [72] the development of tools for assaying gene expression responses in immune cells. This group selected 20 cytokines, 11 chemokines and 12 receptors relevant to immune response, and developed a cDNA array containing these genes. They then validated the resulting array by interrogating RNAs isolated from control or phorbol ester/ionomycin stimulated PBMC from pigs. Expression patterns obtained through hybridization of radioactively labeled cDNAs to the array followed closely the expected expression patterns published previously for most of these genes, indicating this focused immune array can be used for profiling the porcine immune response [72].
Afonso and co-workers [73] have used a cDNA microarray constructed from a swine macrophage library to compare expression profiles from macrophage cultures infected with two forms of African swine fever virus (ASFV). One infection used a parental ASFV (Pr4) while the alternate infection used a mutant virus (Pr4delta35) deficient in two genes that control growth of ASFV in macrophages. RNA was collected at 3 and 6 hours post infection (hpi), and t-test analysis of the 3 hpi hybridization data indicated a total of 38 genes were found to be up-regulated 2 fold or more in the Pr4delta35 infections as compared to the Pr4 infections, while 133 genes were down-regulated. The up-regulated genes, responding only to the gene-deleted virus, included many interferon-regulated genes. Control experiments with mock-infected cultures, as well as Northern blots and or QPCR of 14 test genes, showed this data to be reliable. Interferon regulation of response to Pr4delta35 virus was further confirmed by the expression profile observed for an inhibitor of IFN-induced antiviral protein, which was decreased in Pr4delta35 infected cells [73].
Another analysis of blood cell response to infection has been published by Moser et al. [74]. This group is interested in finding genes that may control susceptibility to bacterial disease. A microarray containing cDNAs from ten immune cell types and tissues was used to interrogate expression in peripheral blood leukocytes isolated from the two most extreme responders to an Actinobacillis pleuropneumoniae (A.p.) infection. The RNA was collected from all 18 pigs in the infection study just before (T=0) and 24 hpi (T=24). The experimental design was a reference design and used either uninfected leukocyte RNA or a 1:2 mixture of muscle and leukocyte RNA. A sophisticated mixed model analysis was used to identify DE genes from T=0 to T=24 for each pig. The authors reported a list of 128 genes was decreased during infection in the resistant animal and increased in the susceptible animal, and a second cluster of 179 genes with the reverse pattern. The origin of the genes in the first cluster was predominately a cDNA library created by subtraction of liver expressed genes from genes expressed in lymphocytes, indicating an immune system origin. The cDNAs found in the second cluster primarily arose from a library created from A.p. infected leukocyte RNA subtracted by uninfected leukocytes. No specific genes were mentioned; however, the apparent immune response indicated genes relevant to this infection were identified [74].
Several papers have been recently published that use microarray analysis to investigate the transcript profile of the intestine and associated lymph tissue. Dvorak and colleagues [75] describe the generation of over 3,000 ESTs from a cDNA library of Peyer's Patch, a mucosal tissue of the intestine, and the development of a custom cDNA microarray from these clones. The microarray was used to assess expression across total library cRNA from un-stimulated Peyer's Patch tissue compared to stimulated Peyer's Patch total cRNA. The latter cRNA was a pool of RNAs from cell cultures stimulated for 3 hours in tissue culture chambers with SC, lipopolysaccaride + cholera toxin, or Phorbol ester + homocyclic AMP + concanavalin A. Additional preliminary hybridizations comparing the normal un-stimulated library, the stimulated library and the pooled and subtracted library were run in duplicate with dye swap. A number of genes were found to be differentially represented among these three libraries, indicating the pooling and subtractions was successful [75]. This group then used this microarray to examine expression differences between juvenile Peyer's Patch (JPP) and adult Peyer's Patch tissue [76]. The hybridization analyses used a reference design, with the reference being pooled mesenteric lymph nodes (MLN) from young pigs. The Student's t-test with Benjamini-Hochberg correction was used to identify DE genes in JPP compared to reference. Using as minimum fold change value of 1.5 (based on JPP:JPP self hybridization analysis) as an additional criteria, 24 genes were identified as DE, and all but 2 of these were more highly expressed in JPP compared to MLN. Hierarchical clustering of these DR genes across the four individual pig samples indicated significant variation among animals. Seven of these ESTs and thirteen additional non-differentially expressed ESTs were tested by QPCR in JPP, MLN and adult PP. Of 18 ESTs with QPCR data for JPP, there was a positive correlation (correlation coefficient = 0.48) between the JPP/MLN rations for QPCR and microarray. Several genes (AECC, GW112, SPAI, PSP) had much higher rations in the QPCR data (100 to 1,000 fold) than seen in the microarray data. In QPCR comparison between JPP and adult PP, several genes were highlighted. Five genes, MARCKS, CIDE-B, GW112, PSP, and PROLI, were much more highly expressed in JPP as compared to adult PP, while MHCII-DR was more highly expressed in adult PP. The genes CIDE-B, GW112, and PSP are interesting as these are annotated as growth and apoptosis-regulating genes associated with responses to normal and/or abnormal intestinal microflora [76].
Additional microarray-based analysis of the intestinal response to bacteria, in this case Escherichia coli and S. enterica serotype Typhimurium (ST), has recently been published by Niewold and collaborators [77, 78]. In these reports, this group used a model of in vivo infection, called small intestinal segment perfusion (SISP). They created a cDNA array using jejunal intestine ESTs and have used this array to measure expression in jejunal tissue after infection with an enterotoxigenic E. coli (ETEC) strain, or mock-infected pigs [77]. Fifteen genes were declared DE when the fold change in expression between uninfected and infected tissue (within a SISP loop in the same animal) was >4 or <-4 and the false discovery rate, as calculated by significance of microarray, was < 0.02. One of these, PAP, was thirty-fold higher in infected tissue; the other genes were not identified. The PAP expression pattern was confirmed by Northern blot analysis [77]. In a second report [78] using the same array and SISP technique, the same group looked at the response to ST. Jejunal RNA collected from several locations in the jejunum after mock-infected or ST infected jejunum at 2, 4 or 8 hpi was used in microarray hybridizations; they pooled tissue samples from 4 animals so unfortunately there was no biological replication. Spotfire software was used to find DE genes with fold differences <-1.58 or >1.58 and p < 0.025 relative to mock-infected jejunal RNA. Seven genes were found DE between either the 4 or 8 hpi samples as compared to mock-infected tissue. Three genes (MMP1, PAP, and STAT3) were DE at both time points, while IL8 and TM4SF20 were DE at only the 4 hpi time, while THO4 and an unknown EST were increased at 8 hpi only. No down-regulated genes were found. One gene (PAP) was tested using QPCR and was confirmed although the data was not shown. The most interesting result was that STAT3, known to function in an immunosuppressive pathway involving SOCS3, was up-regulated and thus could indicate resolution of inflammation was occurring by 4 hours. Alternatively, the authors suggest that immunosuppression by ST may also be occurring, and that such immunosuppression could be a reason for the very low numbers of identified DE genes by this model. They also acknowledge that, as they collected whole jejunal tissue, the DE gene signal may be swamped by the large number of other cell types in the tissue isolated [78].
Another microarray was recently used to study the transcriptional response to SC in the gut. Zhao and others [31] used a novel broad-coverage oligonucleotide array (further discussed below in the Tissue Expression Pattern section) to investigate changes in lung expression at 24 and 48 hpi relative to uninfected pigs. A loop design was used in array hybridizations to identify DE genes across these time points. Fifty-seven genes showed DE (P< 0.001, maximal FDR 27%) between uninfected and infected lung. Cluster analysis of these 57 genes showed that, of the 33 genes with annotation, 17 (52%) were related to immune response, apoptosis or tumorigenesis, clearly indicating that the array was useful in identifying relevant genes for this infection. Several genes showed dramatic increases in expression level relative to controls; 25 genes showed >4.5 fold greater expression at 48 hours. These included INDO, IRF1, HSPA6 (known immune response genes), and GBP1, GBP2 and GBP3 (a known interferon-inducible gene family). Interestingly, TGM1 and TGM3, members of a transglutaminase gene family with possible roles in apoptosis and/or antigen processing, increased 31 fold and >1,000 fold, respectively. This gene family has not directly been implicated in the immune response to bacteria in any species, but the known role in apoptosis for TGM genes indicates this pathway is important in the response of the lung to infection. A large number of genes, 61, were chosen for QPCR for two purposes: a) to validate microarray expression patterns (33 genes) and b) to characterize more fully the transcript response to SC (28 genes). The QPCR confirmed 23 of the 33 DE genes tested, and identified six additional DE genes, validating the microarray data from this oligonucleotide array. Overall, the QPCR results showed a strong T helper 1 cell type response in the lung to Salmonella (exemplified by induction of IFNG, IL15, INDO, IRF1, SOCS1, TNF, and WARS). These results also demonstrated a strong apoptotic response (exemplified by TGM3, TNFRSF5, TNFSF6, and CASP1 induction) and an antigen processing response (exemplified by MHC2TA, PSMB8, TAP1, TAP2 induction). The classical complement pathway (C1s, C1r) and type 1 interferon pathway (GBP1, GBP2) were were also confirmed as strongly induced, while decrease of T helper 2 cell type response genes (IL4, TPS1, IL13) by 48 hpi was confirmed [31]. These data clearly show the value of the microarray, as well as extensive QPCR analyses, to determine expression profiles during infection that inform us of the conserved and potentially pig-specific biological pathways involved.
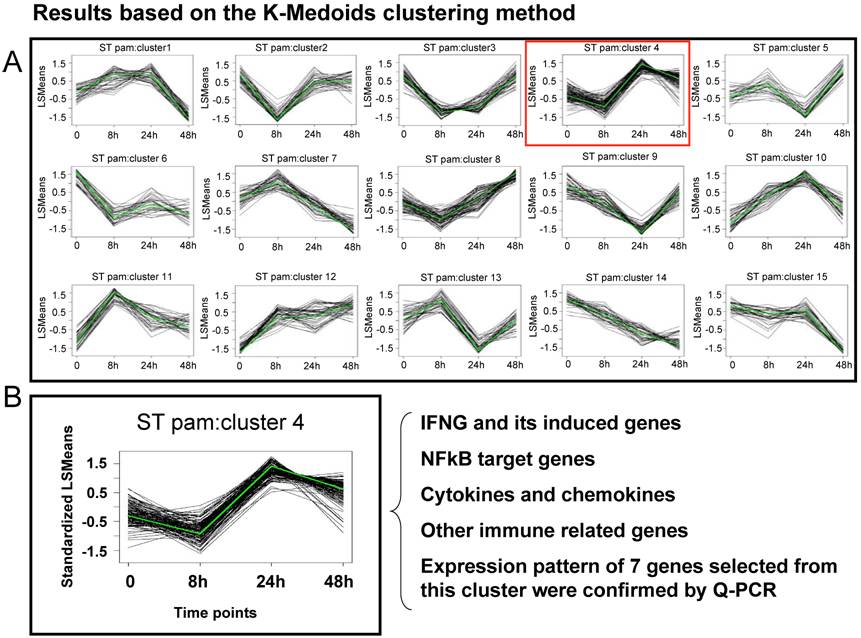
A first generation Affymetrix porcine GeneChip® with probe sets to assay over 23,000 transcripts, was recently used to study host mesenteric lymph nodes (MLN) transcriptional response to ST [Wang et al., submitted]. Animals were infected with ST and tissues collected after 8 hpi, 24 hpi, 48 hpi, or 21 days post-infection. RNA was used in standard Affymetrix analyses to produce profiling data analyzed by MAS5.0 and a mixed model ANOVA with false discovery rate control to identify genes DE across stages within infection. Results showed that 848 genes changed their MLN expression level across one or more pair-wise time-point comparisons in the ST infection (p<0.01, fold change >2, q <0.24); about 100-150 genes were found DE at each time relative to uninfected pigs. Of interest was the finding that, in contrast to the strong transcriptional response to SC seen in the lung by 48 hpi [31], a limited induction of genes at 24 hpi with ST was observed. In fact, from 24 hours to 48 hours post infection, many genes decreased their expression. To study this further, cluster analysis and analysis of specific pathways were used to reveal common expression patterns for sets of genes, and identify specific features of the host response to ST infection. In Figure 1, the cluster analysis of all genes found DE in the ST infection is shown; one particular cluster (#4) is highlighted. This cluster, the genes within which on average rose in expression by 24 hours and then decreased by 48 hours, contains a large number of cytokine genes and NFkB-dependent genes known to be involved in the inflammatory response. This result indicates that, in parallel to the clinical features of ST infection where inflammation is mild and peaks at 24 hpi, the NFkB pathways appears to be activated between 8 and 24 hpi, and then suppressed thereafter. The expression profile of 22 genes (seven of which are present in cluster #4 in Figure 1) was analyzed by Q-PCR, and 95% showed statistically significant confirmation of the expression pattern observed in the microarray data [Wang et al., submitted].
Gene Expression patterns can be clustered to identify pathways of genes acting in concert. To investigate the host transcriptional profile at early immune response stage during the ST infection, genes showing differential expression among all possible comparisons in the ST infection (p<0.01, fc>2, q<0.24) were used to perform the cluster analysis by the K-Medoids clustering method. A. 15 clusters which presented variable expression patterns were identified. The x axis is time points after infection (un-infected animals or 8h, 24h, 48h post-infection) and the y axis shows the normalized gene expression level. The green line in each cluster is the medoid value for expression in each cluster, the pattern representative of all genes in the cluster. B. Most of the genes in cluster 4 showed a slight down-regulation at 8 hpi, but were induced with peak response at 24 hpi during the ST infection. A majority of genes in this cluster are INFG and its induced genes, cytokines and chemokines, NFkB target genes, and other immune related genes. ST: Salmonella Typhimurium; PAM: Partitioning Around Medoids.
Toxoplasma gondii is a protozoan parasite that infects a significant portion of the world-wide human population. A secondary host reservoir for this parasite is the pig, and the host interaction between T. gondii and porcine cells was recently investigated using cDNA microarrays [35]. The ESTs on the array were selected from immune libraries for likely involvement in immune response, and this selected set was used to assay expression in uninfected kidney epithelial cells (PK13) or after T. gondii infection at eight time points after infection (1 hour to 72 hours). Relative to uninfected cells, a total of 263 genes DE genes identified using Student's t-test were found to be induced, and 48 more were decreased, at one or more times after infections. The majority of the induced genes responded to infection within the first 4 hours, and 12 different functional classes of DE genes responded, including transcription and signaling, metabolism, immune response, cell cycle, and apoptosis. Eleven DE genes were tested and confirmed by QPCR. The authors concluded that this approach identified many classes of genes that will be useful candidates to study cell-mediated responses, especially apoptosis and NFkB-dependent pathways, to this parasitic infection [35].
Using Microarrays to Determine Tissue-Selective Gene Expression Patterns and Microarray Applications in Other Research Areas
Most of the microarrays discussed above were developed to ask specific questions in biology. When tools for a specific tissue were not available, some researchers tested the utility of human arrays to profile porcine expression ([55]; see additional papers in Supplementary Table 2). While these cross-species tools can be successful, large-scale porcine-specific tools useful in studying a wide variety of biological questions are available. As discussed above in the infection section, a first-generation porcine oligonucleotide set, representing 13,297 cDNAs and ESTs with broad coverage across tissues, has been designed by Qiagen-Operon in collaboration with researchers in the Swine Sub-committee of the USDA-NRSP8 research project. Zhao and collaborators [32] validated the novel 70-base oligonucleotides on the array by hybridized with targets from porcine adult liver, lung, muscle, or small intestine. A loop design were utilized to collect transcriptome data for each tissue and to identify DE genes across tissues. Using available negative controls (average signal of five Arabidopsis gene oligonucleotides) to calculate a true background level, the large-scale transcriptome for each adult tissue (from 8,358 in muscle to 10,556 in lung) was established as those genes with greater than 3 fold background signal (q < 0.01). Using a criteria of P < 0.001 and q < 0.003, tissue-selective gene lists were produced, from a low of 147 genes in small intestine to a high of 405 genes in liver. Clustering results of the expressed genes identified a number of patterns across these four tissues that are useful in annotating the array ESTs. QPCR analysis of 11 selected genes across the four tissues was used to verify tissue expression and oligonucleotide specificity (multiple members of gene families tested) and showed statistically significant confirmation of all but 2 genes. These results demonstrated that this porcine oligonucleotide array is informative and the oligonucleotide specificity is high, thus the Qiagen-Operon–NRSP8 porcine array can be used for porcine functional genomics analysis [32].
A small number of papers have been published recently on explorations of porcine brain (2), liver (2), and adipose (1) tissues. Nobis and coauthors are interested in the expression pattern of genes in the porcine brain and have submitted ESTs from a brain cDNA library constructed from pooled brain regions [79]. In addition, they constructed a brain cDNA microarray, and demonstrated with self-hybridizations of normal pooled brain cDNA (and appropriate statistical corrections) that the microarray can provide quality data when a fold cut-off of 2.0 is used to control false positives [79]. Members of this group have also used this microarray to investigate frontal cortex expression profiles in early-weaned (EWC) pigs compared to nonweaned (NWC) pigs as well as weaned/nonweaned pigs isolated socially (EWI, NWI) in a 2x2 factorial design [46]. Using a replicate loop design to collect data for all comparisons, they found 103 DE genes using a modified t-test that accounts for multiple testing (P < 0.05, fold change > 1.25). Of these genes, they found 24 of 42 annotated genes had relevant brain functions. Six DE genes were selected for QPCR validation based on DE in specific contrasts, including social isolation (NWI vs. NWC; 14-3-3, CPE, and PEA-15), or social isolation in early weaned pigs (EWI vs. EWC; DBI and ARP2/3) and early weaning in the presence of social isolation (EWI vs. NWI; OAZ2). The QPCR results confirmed the first five genes, and indicated that social isolation in either weaned or nonweaned pigs has effects on neuronal gene expression, but that they did not detect gene expression differences due to weaning alone. The authors postulate this latter result is potentially due to the small study size [46].
A custom oligonucleotide microarray was used to study porcine adipose tissue and stromal/vascular (SV) gene expression [80]. The SV cultures were collected from three stages of growth and development (90-day and 102-day fetal stages, and 5-7 day neonatal stage), and adipose tissue was collected from 105 day fetal and 5-7 day neonatal stages. They identified expression above background for 200 genes in SV cultured cells and 160 genes in the adipose tissue samples. Many of the these genes have been reported to be expressed in adipose cells previously; however the authors highlighted eleven genes not previously so reported, including relaxin, chromogranins A and B, INSL3, FGF12, IGFBP7, GDF9B, BDNF, IL12, and APOR). Three genes were reported as more highly expressed in fetal SV cells as compared to neonatal adipose tissue (IL4, IFNG and IGFBP5) using a t-test of normalized spot intensities [80].
Several papers have reported changes in liver gene expression under a number of treatments. To profile the response to fasting and to treatment with a peroxisome proliferator-activated receptor alpha (PPARG) ligand (Clofibric acid, CA), Cheon and collaborators [49] used a pig skeletal muscle EST array to measure the liver transcriptional profile in normal fed pigs compared to fasted or CA-treated pigs. Liver RNA was pooled within treatment thus no biological replication was available. Genes DE between treatments were identified by as criteria: a) P < 0.1, b) minimum fluorescent intensity of 1,000 units, and c) 2 fold or greater difference between treatments. In contrast to results from rodents, there was little evidence from the microarray data that fatty acid oxidation related genes were highly induced by either CA treatment or fasting. QPCR assays showed statistically significant increased expression for ABCD3, CAT, CYP4A, ACOX1, and EHHADH by CA treatment, and all but the last two genes were also up-regulated by fasting. The QPCR data showed glucokinase was decreased only in the fasting treatment, while glycogen synthase was increased by both treatments. In fatty acid metabolic pathways, both QPCR and microarray data showed that steroyl-CoA desaturase and fatty acid desaturase 1 were decreased by fasting, but these two genes, as well as fatty acid desaturase 2, were increased by CA treatment. The authors conclude that there are major species differences in the liver RNA response to peroxisome proliferator ligands like CA, although they provide additional evidence that the response to fasting, especially for mitochondrial fatty acid oxidation and ketogenic pathways, is more similar across species [49].
A recently published study [34] combined microarray analysis, SNP detection within expression candidates, and association and physical mapping analyses to find liver genes affecting carcass traits. These authors intended to capture expression differences related to phenotypic traits (and minimize other genetic differences) by using discordant sib pair analyses. They identified sibs within an F2 population from a Duroc x German miniature pig cross that were distinctly different for eye muscle area and backfat thickness. To profile the liver expression in these sib pairs, the microarray contained well-annotated genes, including liver genes from earlier work [18, 19] described above, as well as genes known to be important in hepatic metabolism. The liver mRNA from 4 sib pairs (high performing (HP) and low performing (LP)) was pooled by trait, and hybridized to this array. Overall, nine genes were identified by t-test as DE at least two fold between HP and LP groups; four were higher in HP (TBG, PIGSPI, DBI, and SLC01B3) and five were lower (PLA2G6, CPS1, PTN, NAN1, and BHMT1). Ten genes, including six DE genes, were tested by QPCR on liver RNA from the eight individual pigs from the pooled samples. Although good agreement with the microarray data was seen for most genes, only four (TBG, SLC01B3, PEDF and APOH) were statistically different between HP and LP individuals. Two confirmed genes, TBG (higher in HP) and APO (higher in LP) were screened for SNPs by re-sequencing of cDNAs for all eight HP/LP animals. Of three SNPs found in the TBG cDNA sequence, one (A>C at nt 778) was found associated (P < 0.0001) with variation in three fat traits, with the C allele associated with higher fat. As the SNP at nt 718 changes the amino acid at this position, the authors also checked TBG protein expression and function. Available serum data on TBG and TBG bound metabolite levels showed an association of TBG concentration (P < 0.12) and function (P < 0.06 to 0.11) with TBG genotype. Thus this group was able to use discordant sib pair microarray expression analysis to identify expression candidates, identify SNPs in one candidate that was associated with quantitative phenotypes for fatness and with relevant biochemical differences in serum. The combination of evidence at the genetic, expression and functional levels makes a strong case that TBG variation directly controls part of the variation in fatness in this population [34].
4. But What Does It All Mean? Pig Expression Bioinformatics and Databases
At this juncture, available swine transcriptomic data, especially for microarray projects, is somewhat fragmented and sparse. Many different platforms are being used and the data is not always being submitted to a common repository. The recent public disclosure of nearly a million additional ESTs from 97 different non-normalized libraries by the Sino-Danish consortium (Gorodkin et al., submitted) will certainly improve the accuracy of EST frequency data as an estimate of expression level. To become more efficient at drawing biological meaning out of such data, more attention needs to be paid to public sharing of data and integration of that data so that an increase in power is possible. In this section, we discuss the available public resources for pig microarray and other transcriptomic data and discuss some of our efforts to integrate these platforms and data sources.
The following information does not include several storage/analysis efforts on genomic data that includes Sus scrofa as one of the species. These include mapping databases such as ArkDB and databases that link traits to phenotypes without expression data, such as OMIA. Links to these and other sites of interest to pig genomics researchers can be found at the U.S. Pig Genome Coordination website (http://www.animalgenome.org/pigs/).
Two groups have databases available for both expression and sequence information. The National Center for Biotechnology Information (NCBI; http://www.ncbi.nlm.nih.gov) and the European Bioinformatics Institute (EBI; http://www.ebi.ac.uk) have multiple databases, each designed for a specific purpose. At NCBI, UniGene takes the sequence data in the general EST and nr databases and clusters them into single gene units by species (http://www.ncbi.nlm.nih.gov/UniGene/UGOrg.cgi?TAXID=9823). The expression database at NCBI is Gene Expression Omnibus (GEO; http://www.ncbi.nlm.nih.gov/geo/), which uses a specific format for loading and exporting data. As of October 2006, GEO currently includes 18 porcine experiments, and the platform designs for 19 platforms, including the two large commercial platforms: Affymetrix 24k Porcine GeneChip® and several versions of spotted platforms using the Qiagen-Operon-NRSP8 13k oligonucleotide set. Of the 18 experiments, the majority were performed on microarrays, though three used SAGE. The user interface at NCBI for text or BLAST-based searches is advanced, allowing searches to be refined to search specific sub-databases or with other limits.
In contrast, at EBI all the sequences are in a central repository and there is no species-specific clustering database as at NCBI/UniGene. The expression database at EBI is called ArrayExpress (http://www.ebi.ac.uk/arrayexpress/), and uses the Minimal Information About Microarray Experiments (MIAME) standards created by the Microarray Gene Expression Data Society (MGED). ArrayExpress, as of October 23, 2006, has a single porcine expression study, the main bulk of the data being human and mouse.
Another comprehensive EST database is the Dana Farber Cancer Institute Computational Biology and Functional Genomics Laboratory's Pig Gene Index (PGI; http://compbio.dfci.harvard.edu/tgi/). The PGI database is the TIGR Gene Indices information that was brought to Dana Farber by John Quackenbush. The PGI database is similar to UniGene in that it clusters ESTs together, but goes a step further and provides a tentative consensus sequence for each cluster. Also, unlike UniGene which tries to group alternative spliced genes together, PGI attempts to separate them into their own, unique clusters. However, it does provide a link that clusters the tentative alternatively spliced sequences together. The DF database also provides Gene Ontology (GO) annotations, metabolic pathway information, and predicted 70-mer oligonucleotide sequences and SNP information for each of their TCs. Both UniGene and DFGIP data collections can be searched using BLAST, and an expression summary of each of the EST's based on the libraries, and EST count within the libraries, is provided. Both data collections can also be downloaded for local investigator use.
Recently the Sino-Danish group has begun to release their EST sequence information, including alignments into clusters, which is based on over one million ESTs (http://pigest.kvl.dk/index.html). They have submitted their sequences to the Trace Archive at NCBI, but these data have not, as of October 2006, been integrated into dbEST. They have made their clusters available online, and have provided a bulk download website for both the ESTs and the consensus sequences of their clusters. Expression profiles for all the genes are also provided, based on EST frequency within the 97 non-normalized libraries. They predict SNPs based on sequence discrepancies within alignments, as the libraries were created from tissues from multiple breeds. They provide some online tools, including viewing the aligned and clustered sequences as well as searches against the database using BLAST. The website indicates these data have been submitted for publication (Gorodkin et al., submitted).
There are non-comprehensive EST databases, which focus on a select number of tissues. Among these is the Michigan State Center for Animal Functional Genomics (CAFG; http://gowhite.ans.msu.edu/public_php/showPage.php). This database contains tissue specific porcine EST libraries: brain, adipose, and skeletal muscle, the use of which was discussed above in the microarray section [12, 46, 79]. It also contains a mixed tissue porcine library. To annotate the ESTs, the database uses homology searches to various NCBI databases, including RefSeq and Gene. To search the libraries, keywords based on this information transferred from GenBank can be searched; there is also an option to use BLAST to search the different libraries. Clones and clusters can be viewed to determine which libraries have sequences donating to the clusters, and clones are available for order. In addition to the EST information, there is a private internal section for microarrays.
Another focused database is the Pig Expression Data Explorer (PEDE; http://pede.dna.affrc.go.jp/). PEDE also uses homologues in RefSeq and UniGene to annotate the EST sequences that primarily are derived from tissues of interest to porcine immunology research ([81] and references therein). They identified the full-length cDNAs within the ESTs. Their online interface allows a user to search their EST/cDNA clusters using keywords, library, their accession numbers, and the corresponding human chromosome. It allows filtering the results based on evidence of SNP in a specific breed, and provides suggested primers for detection of the SNP. Like the Sino-Danish EST database and the PGI database, it provides a visual alignment of the ESTs to each other and to the cluster consensus sequence. A unique feature of this database is a more in-depth analysis of artiodactyl-specific antigens for furthering the development of xenotransplantation.
Several databases are also in production at the moment, and at various stages of development. One of these is under development at the University of Minnesota (http://gnomix.ansci.umn.edu/bioinf.htm). Their database focuses on sequence data currently, though they indicate they plan on integrating expression data in the future, and currently have annotation provided for the Qiagen-Operon-NRSP8 13K array. Most recently a new database annotating the new Swine Protein Annotated oligonucleotide Microarray (SPAM) has become available (http://www.pigoligoarray.org/). The database describes the set of 18,254 oligonucleotide sequences in the SPAM, and provided the best Ensembl protein matches and Gene Ontology (GO) annotations for each sequence. Another database is being developed at the Advanced Food and Materials in Canada (http://www.afmnet.ca/index.php?fa=Research.myProject&project_id=77&page=1). Their aim is to integrate various types of expression data, including microarray, proteomics, and metabolomics, to compare genetically modified foods. Their first goal is to compare the EnviroPig to the Yorkshire.
A fourth database currently under construction is at Iowa State University (URL pending). Our focus is storage and analysis of data from the Affymetrix platform, although Qiagen-Operon-NRSP8 platform data is also curated. One specific interest is using expression data to help identify tissue-selective genes and across-species expression comparison of such genes to recognize evolutionarily conserved regulatory modules of interest to pig genome scientists. Here we describe some of our efforts in this area; integration and comparison of data from the two broad-coverage platforms that currently exist for the pig; the Qiagen-Operon-NRSP8 13K oligonucleotide array (hereafter abbreviated the Operon array) and the Affymetrix 23K Porcine GeneChip® (abbreviated the Affymetrix chip), both of which were discussed above.
To integrate the expression data for these two platforms, we need first to determine which Operon oligonucleotide probes have a sufficient sequence similarity to the consensus sequences used to create the probesets on the Affymetrix chip so that the two elements will recognize the same transcript(s). The Operon 70-mer probe sequences were used as a BLAST query against the Affymetrix porcine consensus sequences (Figure 2). We set a cutoff criterion of an alignment length ≥ 67 nucleotides with an alignment identity of ≥ 97% for pairings between the 70-mer probes and the consensus sequences. This resulted in a total of 8,317 cross platform mappings (Table 2), which fall on six different match classes: (1) an Operon probe not matching any Affymetrix consensus sequence, (2) an Affymetrix consensus sequences without an Operon probe match, (3) the ideal case when a single Operon probe matches a single Affymetrix consensus sequences, (4) two or more Operon probes map to a single Affymetrix consensus sequence, (5) a single Operon probe maps to multiple Affymetrix consensus sequences, and (6) multiples of each match creating a cluster of probes and probe sets (Figure 2, Table 2). The different classes most likely result from the difference in the known amount of porcine sequence during the development of the probes/probe sets; the Operon probes being designed in 2002, while the Affymetrix probe sets were designed in 2004. This helps explains the different classes: Class 4 from the merging of old clusters, Class 5 from Affymetrix designing separate probe sets for alternative transcripts (which might not have been known in 2002) or that the Operon probe is no longer unique (for example, now targeting multiple genes in the same family), and Class 6 from the joining of different consensus sequences into single genes, but then having alternative splicing.
Results of Comparing Affymetrix Liver Transcriptome to Qiagen-Operon-NRSP8 Liver Transcriptome
| Pairing Class Description | Class Number | Number of Pairs | Number of Operon Probes | Number of Affymetrix Probe Sets | Percent Agreement of Pairs* | Correlation of Pairs** |
|---|---|---|---|---|---|---|
| Operon Singleton1 | 1 | − | 5,531 | − | − | − |
| Affymetrix Singleton2 | 2 | − | − | 16,417 | 97% (out of 13,386) | A1:A2: 0.95 |
| Single Operon to Single Affymetrix3 | 3 | 6,242 | 6,242 | 6,242 | 82% (out of 5,509) | O:A1: 0.62 O:A2: 0.55 A1:A2: 0.95 |
| Multiple Operon to Single Affymetrix4 | 4 | 983 | 983 | 476 | 89% (out of 907) | O:A1: 0.77 O:A2: 0.77 A1:A2: 0.97 |
| Multiple Affymetrix to Single Operon | 5 | 855 | 415 | 855 | 71% (out of 731) | O:A1: 0.62 O:A2: 0.55 A1:A2: 0.94 |
| Multiple of both | 6 | 237 | 126 | 133 | 84% (out of 215) | O:A1: 0.62 O:A2: 0.61 A1:A2: 0.97 |
| Total | − | 8,317 | 13,297 | 24,123 | 82% (out of 7,362) | O:A1: 0.72 O:A2: 0.71 A1:A2: 0.97 |
*For the Affymetrix GeneChip®, the MAS5 report had to agree at least 75% of the time for a probe set to be declared present or absent (all marginal calls were ignored). Hence for the first Affymetrix experiment five out of the six chips had to agree on the P/A calls, and for the second Affymetrix experiment three out of the four chips had to have the same P/A calls; leading to 7,362 of the pairings to be compared for their agreement.
**For the correlation, the mean values of the log normalized raw values were used for each probe within the pair. A Spearman's Rank correlation was then preformed on the means; comparing the Operon platform results to each of the two Affymetrix experiments.
The use of Blast analysis to match elements in the Porcine Affymetrix and Qiagen-Operon-NRSP8 Oligonucleotide array identifies six types of matches.
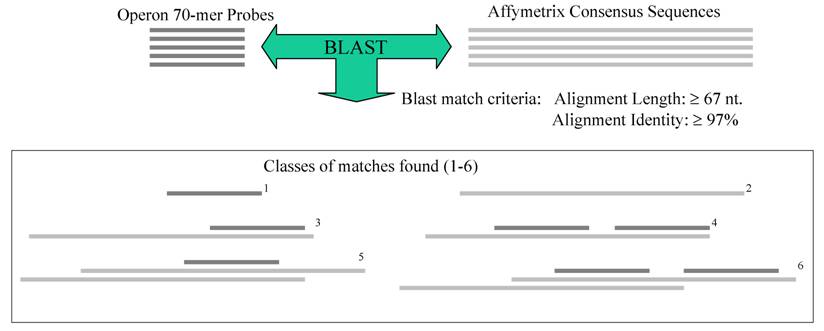
Now that we had the ability to directly compare platform elements, we determined the extent to which the two platforms agree on assaying for the presence or absence of expression for these genes in a common tissue. Two Affymetrix experiments and one Operon experiment were used to calculate the agreement of the presence/absence calls of the platform pairings created by BLAST. All three experiments were performed on normal liver tissue; the first Affymetrix experiment (A1) collected data from the same RNA on six different chips; the second Affymetrix experiment (A2) data was collected using four separate RNA samples on four different arrays. The Operon (O) experimental data on an additional six RNA samples was available from our previous study [32]. MAS5 provides the present/absent calls for the Affymetrix GeneChip®, and for the Operon array we used presence/absence as calculated by Zhao et al. [32]. To take a step beyond simple agreement of presence/absence, we also calculated the correlation of expression level for each gene as estimated by each platform. We ranked each gene by expression level and used the Spearman's Rank correlation to determine the extent of agreement for relative expression of each gene within the common set of genes.
Across the two platforms, we saw a significant amount of agreement in declaring a gene expressed (Table 2). Of the different classes, Class 4 had both the highest agreement (89%) and highest correlation (r2 = 0.77 for Operon to either array and r2 = 0.97 between Affymetrix experiments). The other three classes had similar correlations: r2 = 0.62 for the Operon to A1 experiment, r2 = 0.55 to 0.61 for the Operon to A2 experiment, and r2 = 0.94 to 0.97 for the A1 to A2 comparison. However, they differed in their agreement: 71% for Class 5, 82% for Class 3, and 84% for Class 6. When all pairs are considered, we found an r2 = 0.71 to 0.72 for the cross-platform comparisons and r2 =0.97 for the within platform comparison, with an present/absent agreement of 82%.
Since Class 5 has the lowest agreement and correlations (equal to Class 3 for cross platform correlations, but with a lower within platform correlation), this result indicates that the Operon probes could cross-hybridize to either alternative splice variants or gene family members with close sequence homology that the Affymetrix platform was designed to assay separately. Further investigation is needed to see if the Operon probe is present, while the Affymetrix probe sets are absent, or if there are multiple Affymetrix probe sets present while the single Operon is absent. The results for Class 4, which have the highest agreement and the best correlation, lends support to the proposal that multiple Operon probes target the same gene product—likely by the clustering of sequences from the time the Operon chip was developed to the time the Affymetrix chip was developed. While these results already show good agreement between platforms, it will be important to update the sequence comparisons on a regular basis, especially with the Sino-Danish data, as well as the genome sequence, coming online. As part of our database we plan to develop the means to regularly develop a consensus sequence for each gene from all available sequences to map the various probes and probe sets to each other.
Beyond EST and microarray databases, as noted above, the USDA Beltsville group has set up a database for quantitative real-time PCR assays for genes related to nutrition and immunity (http://www.ba.ars.usda.gov/nrfl/nutri-immun-db/nrfl_query1.html). All assays are based on the Taqman technology, so sequences for both a primer pair as well as the dual-labeled probe are presented. Of the almost 3,000 genes identified, they have validated assays for 474 available, of which 237 are known to be cross-reactive in humans, and another 771 candidate assays are being validated. Many of these assays have been published by this group and their collaborators [29, 31, 32].
In addition to creating databases for porcine transcriptomics, groups are using available stored information for addressing biological information and additional annotation. In a purely bioinformatic analyses of porcine expressed sequences, Jiang and collaborators [82] used 33,308 human gene sequences and mapped, by using BLAST against the est_other database at NCBI, nearly 14,000 of them to a porcine EST in either embryonic or reproductive tissue. Of these, 2,167 were found only in the embryo and 4,552 were only in reproductive tissues, while 7,243 were found in both tissues. Therefore they found a total of 9,410 ESTs present in embryos and 11,795 in reproductive tissues [82].
5. Conclusions
Functional genomics data, primarily at the RNA level currently, is accumulating rapidly for the pig species. Excellent, sensitive and broadly useful tools are already available and more will be become available within the next year. Annotation of the draft porcine genome sequence, expected in late 2007 and into 2008, will allow rapid integration of the gene expression data discussed above with gene sequences, potential splice sites, and gene families within the draft sequence. Advances in other areas of investigation in pig genetics and genomics can be anticipated. One such area would be the ability to find common regulatory sites within flanking DNA of co-expressed/co-regulated genes; leading to the identification of critical regulatory proteins in common with, or distinct from, those found in other species. Such information will reinforce the discovery of pathways through gene list annotations, improve pathway understanding through differentiation of direct targets from indirect targets of transcriptional signals, and would identify targets for manipulation of complete pathways and systems. We can also anticipate the comprehensive integration of linkage mapping and expression profiling of the same population, termed eQTL studies. Such integration of functional and structural genomic data will dramatically improve our understanding of the genetic architecture controlling quantitative traits in pigs. eQTL analyses may lead to the first application of “systems biology” to genetic improvement in the pig through the identification of cis-regulatory variation controlling an economically important phenotype.
As we move toward such a “systems biology” approach in animal genomics, access to and integration of these data sources will become critical. Thus a continuing need is for bioinformatics to integrate the structural and functional data we are generating to inform our investigations [83]. It is unfortunate that many datasets are not being submitted to public repositories; it is our hope and expectation that journals will both facilitate and require such public submissions, as is more the norm in the biomedical fields. Many groups are working on this bioinformatics effort and therefore the near future in pig genomics is especially exciting. The long-term goal of the application of genome data to improve pig genetics will be reached when we can apply a more robust understanding of pig genetic pathways to identify variation at genes controlling important traits of interest in the pig.
Supplementary Material
Supplementary Table 1
Supplementary Table 2
Acknowledgements
This work was supported by a grant from the USDA (NRI-CGP #2004-35205-14202) to CKT. OC is a USDA Multidisciplinary Graduate Education and Training Fellow (USDA CSREES #2001-52100-11506). The authors gratefully acknowledge this support. The authors also thank Dr. Joan Lunney for critical reading of the manuscript, and thank Long Qu for his work on
developing the gene cluster tool used to create Figure 1.
Conflict of interest
The authors have declared that no conflict of interest exists.
References
1. Blomberg LA, Zuelke KA. Serial analysis of gene expression (SAGE) during porcine embryo development. Reproduction, fertility, and development. 2004;16(2):87-92
2. Adams MD, Kelley JM, Gocayne JD. et al. Complementary DNA sequencing: expressed sequence tags and human genome project. Science. 1991;252(5013):1651-6
3. Tuggle CK, Schmitz CB. Cloning and characterization of pig muscle cDNAs by an expressed sequence tag approach. Animal biotechnology. 1994;5(1):1-13
4. Winterφ AK, Fredholm M, Davies W. Evaluation and characterization of a porcine small intestine cDNA library: analysis of 839 clones. Mamm Genome. 1996;7(7):509-17
5. Tosser-Klopp G, Benne F, Bonnet A, Mulsant P, Gasser F, Hatey F. A first catalog of genes involved in pig ovarian follicular differentiation. Mamm Genome. 1997;8(4):250-4
6. Davoli R, Zambonelli P, Bigi D, Fontanesi L, Russo V. Analysis of expressed sequence tags of porcine skeletal muscle. Gene. 1999;233(1-2):181-8
7. Smith TP, Fahrenkrug SC, Rohrer GA, Simmen FA, Rexroad CE, Keele JW. Mapping of expressed sequence tags from a porcine early embryonic cDNA library. Animal genetics. 2001;32(2):66-72
8. Tuggle CK, Green JA, Fitzsimmons C. et al. EST-based gene discovery in pig: virtual expression patterns and comparative mapping to human. Mamm Genome. 2003;14(8):565-79
9. Jiang H, Whitworth KM, Bivens NJ. et al. Large-scale generation and analysis of expressed sequence tags from porcine ovary. Biology of reproduction. 2004;71(6):1991-2002
10. Whitworth K, Springer GK, Forrester LJ. et al. Developmental expression of 2489 gene clusters during pig embryogenesis: an expressed sequence tag project. Biology of reproduction. 2004;71(4):1230-43
11. Fahrenkrug SC, Smith TP, Freking BA. et al. Porcine gene discovery by normalized cDNA-library sequencing and EST cluster assembly. Mamm Genome. 2002;13(8):475-8
12. Yao J, Coussens PM, Saama P, Suchyta S, Ernst CW. Generation of expressed sequence tags from a normalized porcine skeletal muscle cDNA library. Animal biotechnology. 2002;13(2):211-22
13. Zhao SH, Simmons DG, Cross JC. et al. PLET1 (C11orf34), a highly expressed and processed novel gene in pig and mouse placenta, is transcribed but poorly spliced in human. Genomics. 2004;84(1):114-25
14. Blomberg LA, Long EL, Sonstegard TS, Van Tassell CP, Dobrinsky JR, Zuelke KA. Serial analysis of gene expression during elongation of the peri-implantation porcine trophectoderm (conceptus). Physiological genomics. 2005;20(2):188-94
15. Blomberg LA, Garrett WM, Guillomot M. et al. Transcriptome profiling of the tubular porcine conceptus identifies the differential regulation of growth and developmentally associated genes. Molecular reproduction and development. 2006;73(12):1491-502
16. Wang C, Hawken RJ, Larson E, Zhang X, Alexander L, Rutherford MS. Generation and mapping of expressed sequence tags from virus-infected swine macrophages. Animal biotechnology. 2001;12(1):51-67
17. Bratanich A, Blanchetot A. A gene similar to the human hyaluronan-mediated motility receptor (RHAMM) gene is upregulated during Porcine Circovirus type 2 infection. Virus genes. 2006;32(2):145-52
18. Ponsuksili S, Wimmers K, Schellander K. Application of differential display RT-PCR to identify porcine liver ESTs. Gene. 2001;280(1-2):75-85
19. Schwerin M, Dorroch U, Beyer M, Swalve H, Metges CC, Junghans P. Dietary protein modifies hepatic gene expression associated with oxidative stress responsiveness in growing pigs. Faseb J. 2002;16(10):1322-4
20. Gladney CD, Bertani GR, Johnson RK, Pomp D. Evaluation of gene expression in pigs selected for enhanced reproduction using differential display PCR and human microarrays: I. Ovarian follicles. Journal of animal science. 2004;82(1):17-31
21. Bertani GR, Gladney CD, Johnson RK, Pomp D. Evaluation of gene expression in pigs selected for enhanced reproduction using differential display PCR: II. Anterior pituitary. Journal of animal science. 2004;82(1):32-40
22. Narayanan RA, Rink A, Beattie CW, Hu WS. Differential gene expression analysis during porcine hepatocyte spheroid formation. Mamm Genome. 2002;13(9):515-23
23. Ross JW, Ashworth MD, Hurst AG, Malayer JR, Geisert RD. Analysis and characterization of differential gene expression during rapid trophoblastic elongation in the pig using suppression subtractive hybridization. Reprod Biol Endocrinol. 2003;1:23
24. Bonnet A, Frappart PO, Dehais P, Tosser-Klopp G, Hatey F. Identification of differential gene expression in in vitro FSH treated pig granulosa cells using suppression subtractive hybridization. Reprod Biol Endocrinol. 2006;4:35
25. Xu DQ, Xiong YZ, Ling XF. et al. Identification of a differential gene HUMMLC2B between F1 hybrids Landrace x Yorkshire and their female parents Yorkshire. Gene. 2005;352:118-26
26. Uthe JJ, Stabel TJ, Zhao SH, Tuggle CK, Bearson SM. Analysis of porcine differential gene expression following challenge with Salmonella enterica serovar Choleraesuis using suppression subtractive hybridization. Veterinary microbiology. 2006;114(1-2):60-71
27. Hishikawa D, Hong YH, Roh SG. et al. Identification of genes expressed differentially in subcutaneous and visceral fat of cattle, pig, and mouse. Physiological genomics. 2005;21(3):343-50
28. Junghans P, Kaehne T, Beyer M, Metges CC, Schwerin M. Dietary protein-related changes in hepatic transcription correspond to modifications in hepatic protein expression in growing pigs. The Journal of nutrition. 2004;134(1):43-7
29. Dawson HD, Beshah E, Nishi S. et al. Localized multigene expression patterns support an evolving Th1/Th2-like paradigm in response to infections with Toxoplasma gondii and Ascaris suum. Infection and immunity. 2005;73(2):1116-28
30. Royaee AR, Husmann RJ, Dawson HD, Calzada-Nova G, Schnitzlein WM, Zuckermann FA, Lunney JK. Deciphering the involvement of innate immune factors in the development of the host response to PRRSV vaccination. Vet Immunol Immunopathol. 2004;102(3):199-216
31. Zhao SH, Kuhar D, Lunney JK. et al. Gene expression profiling in Salmonella Choleraesuis-infected porcine lung using a long oligonucleotide microarray. Mamm Genome. 2006;17(7):777-89
32. Zhao SH, Recknor J, Lunney JK. et al. Validation of a first-generation long-oligonucleotide microarray for transcriptional profiling in the pig. Genomics. 2005;86(5):618-25
33. Passerini AG, Polacek DC, Shi C. et al. Coexisting proinflammatory and antioxidative endothelial transcription profiles in a disturbed flow region of the adult porcine aorta. Proceedings of the National Academy of Sciences of the United States of America. 2004;101(8):2482-7
34. Ponsuksili S, Murani E, Schellander K, Schwerin M, Wimmers K. Identification of functional candidate genes for body composition by expression analyses and evidencing impact by association analysis and mapping. Biochimica et biophysica acta. 2005;1730(1):31-40
35. Okomo-Adhiambo M, Beattie C, Rink A. cDNA microarray analysis of host-pathogen interactions in a porcine in vitro model for Toxoplasma gondii infection. Infection and immunity. 2006;74(7):4254-65
36. Duvigneau JC, Hartl RT, Groiss S, Gemeiner M. Quantitative simultaneous multiplex real-time PCR for the detection of porcine cytokines. Journal of immunological methods. 2005;306(1-2):16-27
37. Hyland KA, Brown DR, Murtaugh MP. Salmonella enterica serovar Choleraesuis infection of the porcine jejunal Peyer's patch rapidly induces IL-1beta and IL-8 expression. Veterinary immunology and immunopathology. 2006;109(1-2):1-11
38. Hyland KA, Kohrt L, Vulchanova L, Murtaugh MP. Mucosal innate immune response to intragastric infection by Salmonella enterica serovar Choleraesuis. Molecular immunology. 2006;43(11):1890-9
39. Krook H, Hagberg A, Song Z, Landegren U, Wennberg L, Korsgren O. A distinct Th1 immune response precedes the described Th2 response in islet xenograft rejection. Diabetes. 2002;51(1):79-86
40. Cheng G, Chen W, Li Z. et al. Characterization of the porcine alpha interferon multigene family. Gene. 2006;382:28-38
41. Mercier D, Charreau B, Wierinckx A. et al. Regulation of alpha1,3galactosyltransferase expression in pig endothelial cells. Implications for xenotransplantation. European journal of biochemistry / FEBS. 2002;269(5):1464-73
42. da Costa N, Blackley R, Alzuherri H, Chang KC. Quantifying the temporospatial expression of postnatal porcine skeletal myosin heavy chain genes. J Histochem Cytochem. 2002;50(3):353-64
43. Jin YX, Lee JY, Choi SH, Kim T, Cui XS, Kim NH. Heat shock induces apoptosis related gene expression and apoptosis in porcine parthenotes developing in vitro. Anim Reprod Sci. 2006 Aug 16. [Epub ahead of print]
44. Lee HY, Cui XS, Lee KA, Kim NH. Annealing control primer system identifies differentially expressed genes in blastocyst-stage porcine parthenotes. Zygote (Cambridge, England). 2006;14(1):71-80
45. Cui XS, Song H, Kim NH. Identification of metaphase II-specific gene transcripts in porcine oocytes and their expression in early stage embryos. Reproduction, fertility, and development. 2005;17(6):625-31
46. Poletto R, Siegford JM, Steibel JP, Coussens PM, Zanella AJ. Investigation of changes in global gene expression in the frontal cortex of early-weaned and socially isolated piglets using microarray and quantitative real-time RT-PCR. Brain research. 2006;1068(1):7-15
47. Poletto R, Steibel JP, Siegford JM, Zanella AJ. Effects of early weaning and social isolation on the expression of glucocorticoid and mineralocorticoid receptor and 11beta-hydroxysteroid dehydrogenase 1 and 2 mRNAs in the frontal cortex and hippocampus of piglets. Brain research. 2006;1067(1):36-42
48. Waylan AT, Kayser JP, Gnad DP. et al. Effects of L-carnitine on fetal growth and the IGF system in pigs. Journal of animal science. 2005;84(8):1824-31
49. Cheon Y, Nara TY, Band MR, Beever JE, Wallig MA, Nakamura MT. Induction of overlapping genes by fasting and a peroxisome proliferator in pigs: evidence of functional PPARalpha in nonproliferating species. American journal of physiology. 2005;288(6):R1525-35
50. Bai Q, McGillivray C, da Costa N. et al. Development of a porcine skeletal muscle cDNA microarray: analysis of differential transcript expression in phenotypically distinct muscles. BMC Genomics. 2003;4(1):8
51. Peuster M, Fink C, Reckers J, Beerbaum P, von Schnakenburg C. Assessment of subacute inflammatory and proliferative response to coronary stenting in a porcine model by local gene expression studies and histomorphometry. Biomaterials. 2004;25(6):957-63
52. Schena M, Shalon D, Brown PO, Davis RW. Quantitative monitoring of gene expression patterns with a complementary DNA microarray. Science. 1995;270(5235):467-70
53. Quackenbush J. Extracting meaning from functional genomics experiments. Toxicol Appl Pharmacol. 2005;207(Suppl 2):195-9
54. Reecy JM, Spurlock DM, Stahl CH. Gene expression profiling: insights into skeletal muscle growth and development. Journal of animal science. 2006;84(Supp 1):E150-4
55. Moody DE, Zou Z, McIntyre L. Cross-species hybridisation of pig RNA to human nylon microarrays. BMC Genomics. 2002;3(1):27
56. Lin CS, Hsu CW. Differentially transcribed genes in skeletal muscle of Duroc and Taoyuan pigs. Journal of animal science. 2005;84(9):2075-86
57. da Costa N, McGillivray C, Bai Q, Wood JD, Evans G, Chang KC. Restriction of dietary energy and protein induces molecular changes in young porcine skeletal muscles. The Journal of nutrition. 2004;134(9):2191-9
58. Zhao SH, Nettleton D, Liu W. et al. Complementary DNA macroarray analyses of differential gene expression in porcine fetal and postnatal muscle. Journal of animal science. 2003;81(9):2179-88
59. Bilak SR, Bremner EM, Robson RM. Composition of intermediate filament subunit proteins in embryonic, neonatal and postnatal porcine skeletal muscle. Journal of animal science. 1987;64(2):601-6
60. te Pas MF, De Wit AA, Priem J. et al. Transcriptome expression profiles in prenatal pigs in relation to myogenesis. Journal of muscle research and cell motility. 2005;26(2-3):157-65
61. Cagnazzo M, te Pas MF, Priem J. et al. Comparison of prenatal muscle tissue expression profiles of two pig breeds differing in muscle characteristics. Journal of animal science. 2006;84(1):1-10
62. Lahmers S, Wu Y, Call DR, Labeit S, Granzier H. Developmental control of titin isoform expression and passive stiffness in fetal and neonatal myocardium. Circulation research. 2004;94(4):505-13
63. Lai LP, Lin JL, Lin CS. et al. Functional genomic study on atrial fibrillation using cDNA microarray and two-dimensional protein electrophoresis techniques and identification of the myosin regulatory light chain isoform reprogramming in atrial fibrillation. Journal of cardiovascular electrophysiology. 2004;15(2):214-23
64. Caetano AR, Johnson RK, Ford JJ, Pomp D. Microarray profiling for differential gene expression in ovaries and ovarian follicles of pigs selected for increased ovulation rate. Genetics. 2004;168(3):1529-37
65. Agca C, Ries JE, Kolath SJ. et al. Luteinization of porcine preovulatory follicles leads to systematic changes in follicular gene expression. Reproduction (Cambridge, England). 2006;132(1):133-45
66. Lee SH, Zhao SH, Recknor JC, Nettleton D, Orley S, Kang SK, Lee BC, Hwang WS, Tuggle CK. Transcriptional profiling using a novel cDNA array identifies differential gene expression during porcine embryo elongation. Mol Reprod Dev. 2005;71(2):129-39
67. Whitworth KM, Agca C, Kim JG. et al. Transcriptional profiling of pig embryogenesis by using a 15-K member unigene set specific for pig reproductive tissues and embryos. Biology of reproduction. 2005;72(6):1437-51
68. Green JA, Kim JG, Whitworth KM, Agca C, Prather RS. The use of microarrays to define functionally-related genes that are differentially expressed in the cycling pig uterus. Reproduction (Cambridge, England) Suppl. 2006;62:163-76
69. Stewart JD, Lou Y, Squires EJ, Coussens PM. Using human microarrays to identify differentially expressed genes associated with increased steroidogenesis in boars. Animal biotechnology. 2005;16:139-51
70. Hammamieh R, Bi S, Mani S. et al. Genetic variations in peripheral blood mononuclear cells in piglets used as an animal model for staphylococcal enterotoxin exposures. Omics. 2003;7(4):401-9
71. Hammamieh R, Bi S, Das R, Neill R, Jett M. Modeling of SEB-induced host gene expression to correlate in vitro to in vivo responses. Biosens Bioelectron. 2004;20(4):719-27
72. Ledger TN, Pinton P, Bourges D, Roumi P, Salmon H, Oswald IP. Development of a macroarray to specifically analyze immunological gene expression in swine. Clinical and diagnostic laboratory immunology. 2004;11(4):691-8
73. Afonso CL, Piccone ME, Zaffuto KM. et al. African swine fever virus multigene family 360 and 530 genes affect host interferon response. Journal of virology. 2004;79(4):1858-64
74. Moser RJ, Reverter A, Kerr CA, Beh KJ, Lehnert SA. A mixed-model approach for the analysis of cDNA microarray gene expression data from extreme-performing pigs after infection with Actinobacillus pleuropneumoniae. Journal of animal science. 2004;82(5):1261-71
75. Dvorak CM, Hyland KA, Machado JG, Zhang Y, Fahrenkrug SC, Murtaugh MP. Gene discovery and expression profiling in porcine Peyer's patch. Veterinary immunology and immunopathology. 2005;105(3-4):301-15
76. Machado JG, Hyland KA, Dvorak CM, Murtaugh MP. Gene expression profiling of jejunal Peyer's patches in juvenile and adult pigs. Mamm Genome. 2005;16(8):599-612
77. Niewold TA, Kerstens HHD, van der Meulen J, Smits MA, Hulst MM Development of a porcine small intestinal cDNA micro-array: characterization, functional analysis of the response to enterotoxigenic E. coli. Veterinary Immunol Immunopath. 2005;105(3-4):317-29
78. Niewold TA, Veldhuizen EJ, van der Meulen J. et al. The early transcriptional response of pig small intestinal mucosa to invasion by Salmonella enterica serovar typhimurium DT104. Molecular immunology. 2007;44(6):1316-22
79. Nobis W, Ren X, Suchyta SP, Suchyta TR, Zanella AJ, Coussens PM. Development of a porcine brain cDNA library, EST database, and microarray resource. Physiological genomics. 2003;16(1):153-9
80. Hausman GJ, Poulos SP, Richardson RL. et al. Secreted proteins and genes in fetal and neonatal pig adipose tissue and stromal-vascular cells. Journal of animal science. 2006;84(7):1666-81
81. Uenishi H, Eguchi-Ogawa T, Shinkai H, Okumura N, Suzuki K. et al. PEDE (Pig EST Data Explorer) has been expanded into Pig Expression Data Explorer, including 10,147 porcine full-length cDNA sequences. Nucleic acids research. 2006 [Epub ahead of print]
82. Jiang Z, Zhang M, Wasem VD, Michal JJ, Zhang H, Wright RWJr. Census of genes expressed in porcine embryos and reproductive tissues by mining an expressed sequence tag database based on human genes. Biology of reproduction. 2003;69(4):1177-82
83. Tuggle CK, Dekkers JC, Reecy JM . Integration of structural and functional genomics. Anim Genetics. 2006;37(Suppl 1):1-6
Tables and Figures
Author contact
![]() Correspondence to: Christopher K. Tuggle, Department of Animal Science, Iowa State University, 2255 Kildee Hall, Ames, IA 50011, USA
Correspondence to: Christopher K. Tuggle, Department of Animal Science, Iowa State University, 2255 Kildee Hall, Ames, IA 50011, USA