Impact Factor
ISSN: 1449-2288
Int J Biol Sci 2007; 3(3):166-178. doi:10.7150/ijbs.3.166 This issue Cite
Review
Characterizing Linkage Disequilibrium in Pig Populations
Monsanto Company, St., Louis, MO 63137, USA
Received 2007-1-23; Accepted 2007-2-1; Published 2007-2-10
Abstract
Knowledge of the extent and range of linkage disequilibrium (LD), defined as non-random association of alleles at two or more loci, in animal populations is extremely valuable in localizing genes affecting quantitative traits, identifying chromosomal regions under selection, studying population history, and characterizing/managing genetic resources and diversity. Two commonly used LD measures, r2 and D', and their permutation based adjustments, were evaluated using genotypes of more than 6,000 pigs from six commercial lines (two terminal sire lines and four maternal lines) at ~4,500 autosomal SNPs (single nucleotide polymorphisms). The results indicated that permutation only partially removed the dependency of D' on allele frequency and that r2 is a considerably more robust LD measure. The maximum r2 was derived as a function of allele frequency. Using the same genotype dataset, the extent of LD in these pig populations was estimated for all possible syntenic SNP pairs using r2 and the ratio of r2 over its theoretical maximum. As expected, the extent of LD highest for SNP pairs was found in tightest linkage and decreased as their map distance increased. The level of LD found in these pig populations appears to be lower than previously implied in several other studies using microsatellite genotype data. For all pairs of SNPs approximately 3 centiMorgan (cM) apart, the average r2 was equal to 0.1. Based on the average population-wise LD found in these six commercial pig lines, we recommend a spacing of 0.1 to 1 cM for a whole genome association study in pig populations.
Keywords: LD, LD measure, pigs
1. Introduction
Linkage disequilibrium (LD), defined as non-random association of alleles at two or more loci, in a population can be used to exploit what has happened to the population (e.g., breeding history, selection, genetic drift, mutation e.g., [1]) and to map quantitative trait loci (QTL) e.g., [2]. While study on LD has a long history (e.g., [3, 4]), the extent and range of LD in animal populations has recently become a focus area for the following reasons: rapid increase in newly identified DNA markers (mainly SNPs, single nucleotide polymorphisms) and continuous decline in genotyping cost have made it more realistic to collect genotype data on a high density marker map of a whole genome; active research areas such as fine mapping QTL, whole genome association study, and whole genome selection need knowledge of the extent and range of LD in animal populations.
2. Measurement of linkage disequilibrium
The first question to be resolved regarding population-wise LD is how to measure it. Conventionally, the focus is on LD between two loci: while it is desirable that an LD measure can appropriately handle multiple allele data, biallelic markers (mainly SNPs) are expected to be increasingly predominate. Moreover, there is a rapidly increasing need to measure LD for multiple loci and a chromosomal region. It is important that the extent and range of LD in different populations are reported using one or a very small number of well accepted LD measures such that meaningful comparisons can be made across different studies.
One of the most important properties an ideal LD measure needs to have is to be independent of allele frequencies. It is highly desirable that an LD measure has a clear interpretation and well defined distribution under independence. Furthermore, an LD measure should provide solutions or valuable information to various practical applications. For example, appropriate marker density requirement and population choices for a whole genome association study need knowledge of population-wise LD. An LD measure that can facilitate power calculations and mapping resolutions is clearly desirable. It might be true that different LD measures are needed to be optimal for different practical applications using LD information.
One of the simplest LD measures is the difference between actual and expected haplotype frequency (i.e., the product of corresponding allele frequencies):
(1)
where Pij is the frequency of haplotype ij (i = allele i at locus 1; j = allele j at locus 2); pi and qj are the frequencies of allele i at locus 1 and allele j at locus 2, respectively. It can be shown that the absolute value of Dij (|Dij|) is identical for all four haplotypes of any two biallelic loci.
Dij is clearly undesirable because it is highly dependent upon allele frequencies, and its size has no clear interpretations. Numerous two locus LD measures have been created by the efforts of making Dij more allele frequency independent and easier to interpret (for reviews see [5-7]). Of those, D' [8] and r2 [9] have been most commonly used in the literature (e.g., [5, 10, 11]]. For any two biallelic loci, D' and r2 are defined as
(2)
and
(3)
respectively, where
(4)
Both D' and r2 range from 0 to 1 and have some desirable properties. The LD measure D' was designed for loci with two or more alleles. Mainly due to its flexibility in handling multiple allele data, most studies on LD in animal populations used D' to measure population-wise LD of microsatellite genotype data (e.g., [10-13]). The maximum of D' has an easy interpretation: D' equals 1 (referred to as complete LD) if and only if at least one allele at each locus is completely associated with an allele at the other locus. When a new mutation occurs in a finite population, D' is equal to 1 and will remain to be 1 until a recombinant or mutation event breaks the original haplotype. However, D'<1 doesn't has a clear interpretation. The value of D' in many applications is limited (e.g., D' cannot be directly used to calculate the sample size needed to achieve specific power in an association study). More fundamentally, D' has been shown to be inflated by small sample sizes (e.g., [5]) and low allele frequency (e.g., [14]). Therefore, it is less meaningful to compare across different marker pairs and studies. In an attempt to correct the effect of allele frequency, an adjusted D' denoted by D'adj that was derived by subtracting D'H0 (D' estimated under independence via permutation), was proposed by Delvin et al. [14]. While this permutation adjustment appears to be attractive and has been adopted by Spelman and Coppieters [15], no evaluation was performed on how effective this permutation in correcting the dependency of D' on allele frequencies. Moreover, the maximum adjusted D' is 1 - D'H0 instead of 1.
Another commonly used LD measure, r2, is the correlation of determination for alleles at two loci (r is the correlation coefficient for a 2 x 2 table, [9]). In the context of disease gene mapping, it has been shown that the sample size is approximately inflated by 1/ r2 using a marker in comparison with using a susceptibility locus itself if the level of LD between the marker and the susceptibility locus is equal to r2 (e.g., [5]). In addition, the expectation of r2 for a random mating population that is in equilibrium and absence of selection and recurring mutations is a function of effective population sizes (Ne) and the recombination rate between two loci (θ) (E(r2) = 1/(1+4θNe)) [4]. This relationship has been proposed to be used for estimating historical effective population sizes [13, 16]. While r2 is still considered as allele frequency dependent, the bias due to allele frequency it is considerably smaller than that in D' (e.g., [5]).
For a pair of biallelic loci, r2 = 1 (known as the perfect LD) if and only if there exist two haplotypes for two biallelic loci, implying that each allele at each locus is completely associated with one allele at the other locus and allele frequency at both loci are identical. For a pair of markers with unequal allele frequencies at two loci, its maximum of r2 is less than 1 and becomes more complicated.
Consider two biallelic loci with minor allele frequency being p1 and q1 at locus 1 and 2, respectively. Assume p1 ≤ q1. There are two complete LD states as defined by D': a) P11 = p1 in which all minor alleles at locus 1 form haplotypes with the minor allele at locus 2; and b) P12 = p1 in which all minor alleles at locus 1 form haplotypes with the main allele at locus 2. While D' is equal to 1 in both cases of complete LD, the values of r2 are different and can be calculated as
(5)
and
(6)
in case a) and case b), respectively. Clearly, r2max in case a) is a global maximum given allele frequencies, and is referred to as the maximum of r2 in this study. r2max in case b) is a local maximum. With unequal allele frequencies at two loci, there exist at least three haplotypes, and r2max is <1. With equal allele frequency at two biallelic loci, the minimum number of haplotypes can be reduced to two when r2max is equal to 1.
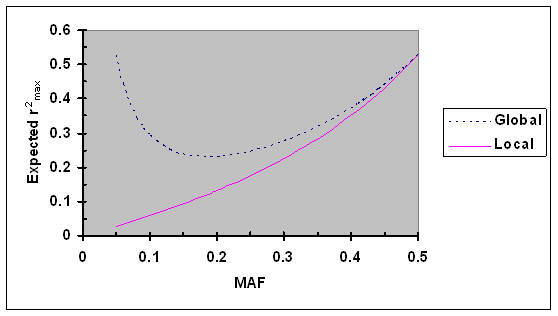
Numerical analyses were performed to further evaluate local and global maximum r2. Assume that the minor allele frequencies (MAF) at two biallelic loci are independently and uniformly distributed in the interval of [0.05, 0.5] (a minimum of 0.05 is set to reflect that all SNPs with MAF <0.05 were excluded from our analyses). For a specific MAF at one locus, the expectation of local and global r2max was calculated. As shown in Fig. 1, the expectation of the local maximum r2max increased steadily from 0.03 to 0.53 as the MAF increased from 0.05 to 0.5. The expectation of the global maximum r2max first decreased from 0.53 to 0.23 as the MAF increased from 0.05 to 0.19 and then increased to 0.53 as the MAF further increased to 0.5. These results suggest that the expectation of maximum r2 is much smaller than 1 under the assumption of MAF being independently and uniformly distribution and that markers with low polymorphism can be valuable in some special cases (e.g., very dense coverage of a region) as shown by their high global maximum.
Several other of Lewontin's D based LD measures including a measure similar to an attributable risk measure (D/(q1P22) developed by Bengtsson and Thomson [17]) were evaluated by Delvin and Risch [18], and Zhao et al. [7] evaluated nine Lewontin's D based LD measures (including D' and r2) for their usefulness in LD mapping. Fisher's exact test (FET) can also be used for detection of presence of LD in a population. Monte Carlo approximation of Fisher's exact test was developed for large sample sizes in which exact calculation is computationally infeasible [10]. While FET is independent of allele frequency, it is a function of sample sizes, and there is no clear interpretation of FET. Therefore, FET is not an ideal LD measure. However, FET can help evaluating other LD measures: given a sample size, a closer correlation to the p value (or its log-transformation) of FET is considered to be desirable. Recently, several homozygosity based LD measures were developed to measure LD of multiple loci or a chromosomal region [16, 19].
Expected r2max as a function of minor allele frequency (MAF) under the assumption of MAF at two loci are independently and uniformly distributed. Given allele frequencies at two biallelic loci, the global and local r2max were calculated using Eqs. 5 and 6, respectively.
3. Factors influencing population-wise linkage disequilibrium
The extent and range of LD of two loci in an animal population is jointly affected by evolutionary forces (such as random drift, natural selection, mutation, and line origin), molecular forces such as historical recombination events, and the population's breeding history such as historical effective population sizes, intensity and direction of artificial selection, population admixture, and mating patterns.
The effect of recombination rate on the extent of LD is easy to understand: alleles at neighboring loci tend to be inherited together and tend to be associated in a segregating population. In a large population under no selection, Dij decays at rate of 1- θ under random mating, where θ is the recombination fraction. In populations with large effective population sizes such as human populations, variable recombination rates across chromosomal regions are considered as one of the factors for haplotype structures existed in human populations (e.g., [20]].
In a finite population, random drift affects both allele and haplotype frequencies, and population-wise LD. Clearly, effect of random drift becomes more dramatic in cases of smaller effective population sizes. As described above, LD of two loci in a population in equilibrium is a function of effective population size, (1/(1+4θNe)) [4].
The effect of selection on LD is dependent upon the direction, intensity, duration, and consistency of selection over time. Bulmer [3] showed that selection reduced genetic variation in the next generation and produced negative gametic (linkage) disequilibrium among loci (linked and unlinked). When selection operates at a locus, the neighboring loci that are in LD with locus under selection will have an enhanced extent of LD, a hitchhiking effect. When selection operates on multiple loci in epistasis, LD between loci under epistatic selection and their tightly linked loci will be created and enhanced. For animal populations, the impact of selection on their LD is also dependent upon the consistency of breeding objectives over time.
When a new mutation occurs in a finite population, LD is created and the degree is dependent on the frequency of the allele that is haplotyped with the new mutation. As the copies of the mutant allele accumulate, the LD between this locus and other loci depend on recombinant rate, random drift, population admixture, and selection. Due to generally low mutation rate, recurrent mutations are expected to have little impact on the extent and range of LD in animal populations. However, for some mutation hot spots, the LD between a hot spot and its neighboring loci should be generally lower than expected.
Admixture of populations will clearly create new LD among loci that are in no previous LD in all parental populations and alter the extent of LD for loci that are in LD in the parental populations. The spurious LD between unlinked loci created by admixture can be rapidly dissipated in subsequent generations. However, it will take much longer to dissipate the effect of population admixture on LD of neighboring loci.
4. Usefulness of linkage disequilibrium
The knowledge of the extent and range of LD in animal populations has become increasingly useful, mainly due to its importance in assisting fine mapping of quantitative trait loci and marker assisted selection (MAS). Regardless of designs and statistical methods used in QTL mapping, LD plays a fundamental role in QTL mapping because choice of appropriate marker spacing and resulting QTL mapping resolution depend on extent and range of LD in the population of choice. For QTL genome scans using crosses of completely inbred lines (e.g., F2 or backcross), presence of extensive LD requires only sparse marker coverage (e.g., 10 to 20 centiMorgans (cM) spacing for microsatellite markers). Most domestic animals are associated with long generation intervals, low reproductive rates, high unit cost, and inbreeding depression, and it is therefore unrealistic to create mapping populations that require many generations of inbreeding. Instead, large paternal half-sib families within a segregating line and crosses between two segregating lines have been used in many linkage mapping studies in animals (e.g., [21, 22]). With sparse marker coverage, linkage mapping using paternal half-sib families focuses on the sire side, because the paternal haplotype has extended LD; linkage mapping using line crosses focuses on QTL segregating between parental lines because extensive LD only exists for between line difference.
While extensive LD facilitates QTL detection with sparse marker coverage, it limits resolution of QTL mapping. In essence, fine mapping is basically testing the presence of a segregating QTL in one chromosomal region against neighboring chromosomal regions and requires a large number of recombinant events in small chromosomal regions. It has been suggested, both by animal and human geneticists, to exploit population-wise LD (namely LD mapping) for fine mapping in human (e.g., [2]) and animal (e.g., [23]) populations. Most animal populations are outbred for many generations, and have therefore accumulated a large number of historical recombinant events that are valuable for fine mapping. With increasing availability of SNPs, the whole genome association studies become increasingly realistic and attractive. To do that, one needs the knowledge of extent and range of LD in animal populations to resolve fundamental issues such as marker density requirements and population suitability.
When a SNP is not a causal mutation and only linked to QTL, the effectiveness of MAS using this SNP is affected by the extent of LD between this SNP and the causal mutation [24]. For selection to be effective, MAS operating on multiple QTL (mostly likely using a large number of markers) is critical. Recently, whole genomic selection has been exploited as an alternative for selection of animals for breeding (e.g., [25]). How to perform MAS and the effectiveness of MAS using a large number of markers (including whole genome selection) are affected and should be optimized in the extent and range of population-wise LD.
As described above, selection will enhance LD of neighboring loci. With consistently strong artificial selection practiced in many animal populations, it might be feasible to identify chromosome segments under selection using LD data in many animal populations by identifying regions with more extensive LD [26] and testing interaction between chromosomes on the extent of LD [10].
As described above, population-wise LD is affected by random drift. The effective population size is generally small in most animal populations. Hayes et al. [16] proposed an LD measure, chromosome segment homozygosity, to estimate historical effective population size. Zhao et al. [7] used the level of LD expected from effective population size to evaluate different LD measures.
5. Linkage disequilibrium in human and animal populations
Most empirical studies aimed at investigating the extent and range of LD have been conducted by human geneticists in human populations. Instead of an exhaustive review, several studies are briefly discussed to gain general knowledge of the range and extent of LD in human populations. While a few earlier studies work with microsatellite marker genotype data (e.g., [27, 28]), most focus on single nucleotide polymorphism (SNP) genotype data, especially on extremely tightly linked SNPs (e.g., [29 -31]) in European populations. A review of published data show that LD varies among populations and genome regions [5]: the extent of LD in northern European populations ranges from 10-30 kb to several hundreds of kilobases, while other studies suggest that the extent of LD in northern African populations is lower.
There are several published studies on the level of LD in domestic animal populations, and most of them used microsatellite marker data. Farnir et al. [10] pioneered the investigation of population-wise LD in animal populations, by estimating LD between 281 microsatellite markers in Dutch black and white cattle. They demonstrated that LD extended over large genetic distance (e.g., ~20 cM) and that the degree of LD continuously increases as linkage distance decreases from 5 to 1 cM. They further showed that non-syntenic markers have a probability of approximately 12% to be in LD at the 0.05 significance level. While Farnir et al. [10] reported via a simulation study that the effect of random drift alone can explain the observed LD and found no evidence of a selection effect on LD, Tenesa et al. [13] found some evidence of the effect of selection on LD by showing that LD is stronger in chromosome regions harboring QTL in UK dairy cattle. McRae et al. [12] studied LD in two sheep populations using microsatellite markers. While they found similar LD levels to those in cattle for loosely linked markers, their data lack tightly linked markers. These authors made conscious efforts to test the independence of D' on allele frequency and found that D' may be skewed when rare alleles are present. Nsengimana et al. [11] investigated the level of LD in chromosomes 4 and 7 in five commercial pig populations. These authors were able to detect small size of population and chromosome effects on LD. However, their data only contained 15 microsatellite markers and lack tightly linked markers. Recently, Spelman and Coppieters [26] genotyped 283 cattle with the Affymetric GeneChip® BovineMapping 10K SNP kit. Order between SNPs was predicted based on a comparative alignment between human and bovine genome, and linkage distance was estimated by extrapolation. They used 40 inferred halpotypes for Jersey dams with at least 8 genotyped progeny to estimate all possible pairwised LD of 339 SNPs from a bovine chromosome. They found a much lower level of population-wise LD than that by Farnir et al. [10]: the average level of r2 for markers within 1 and 5 MB (megabytes) was equal to 0.1 and 0.04, respectively.
It is expected that populations of domestic animals have LD well above the levels in human populations, because of small effective population sizes (e.g., 100), and strong artificial selection. The extensive LD observed in domestic animal populations was somewhat of a surprise to some animal geneticists e.g., [10], and prompted several groups e.g., [10, 11] to suggest the feasibility of a genome-wise LD study using available microsatellite markers. The effect of random drift is expected to be strong in case of small effective population size.
6. Evaluation of r2 and D' using actual data
As described above, Delvin et al. [14] attempted to remove the dependence of D' on allele frequency by subtracting D'H0 from the observed D', where D'H0 is the D' under independence and estimated by permuting each allele at one locus independently of alleles at the other locus. Spelman and Coppieters [15] applied a similar permutation procedure to adjust r2 using r2H0 under independence. In this study, we used a porcine genotype data set of whole genome distributed SNPs to evaluate the dependence of LD measures r2 and D' on allele frequency and their adjustment via permutation.
Data description
Approximately 4,500 SNPs on 18 porcine autosomal chromosomes were used in this study. Of those, approximately 4,100 autosomal SNPs were selected from a collection of more than 600K SNPs that Monsanto Choice Genetics exclusively licensed from Metamorphix, Inc. (MMI), based on their informativeness, and evenness of spacing over the porcine genome. Approximately 4,300 pigs from 6 pure lines (600 to 750 per line) were genotyped at these SNPs. These six lines consist of two terminal sire lines (PT (Pietrain based) and DU (Duroc based)) and four maternal lines (LR1 and LR2 are Landrace based, and LW1 and LW2 are Large White based) (Table 1). An additional ~400 SNPs were genotyped using PT pigs. About 150 of these 400 SNPs were genotyped using a ~3,000 animal panel, and the other 250 SNPs were genotyped using a panel of ~1,400 PT pigs. Therefore, PT genotype data were from three projects, and the samples for SNPs genotyped in different projects were considerably small (namely the overlapping animals). The overall average number of offspring from a sire ranged from 15 to 20, and their dams were generally not genotyped. For evaluation within a line, minor allele frequency needs to be ≥0.05 to be included in the LD evaluation. A linkage map of these SNPs and other markers (both microsatellite markers and SNPs) genotyped for other projects was previously constructed using part of this dataset and additional genotype data as described by Grapes et al. [32].
Description of six pig lines used in this study
| Line | Breed | Breeding Purpose |
|---|---|---|
| PT | Pietrain | Terminal sire line |
| DU | Duroc | Terminal sire line |
| LR1 | Landrace | Maternal line |
| LR2 | Landrace | Maternal line |
| LW1 | Large White | Maternal line |
| LW2 | Large White | Maternal line |
Population haplotype frequency estimation
The first step was to identify all alleles whose parental origins could be inferred with certainty conditional on the observed genotype data. For all SNPs on a chromosome, the probabilities of plausible linkage phases of each family sire were estimated using progeny genotype information. Given sire linkage phase, one can calculate the probability of haplotype of maternal origin [10]. The probabilities of haplotypes of the maternal origin for each offspring were calculated as the summation of the product of sire phase probability and the probability of haplotype of maternal origin conditional on sire phase over all sire linkage phases.
For estimation of population haplotype frequency, animals with observed genotypes at both SNPs under evaluation were included; both haplotypes of all nonfinal offspring with genotypes and only maternal haplotypes of final offspring were used. Observed r2 and D' were estimated using haplotype frequency for each line and every possible syntenic SNP pair.
LD measures under independence
For each gamete included in a population haplotype frequency calculation, probabilities of having an allele at each SNP were estimated from its haplotype probability. Allele probabilities at each locus were randomly permuted among gametes, and haplotype probabilities for each gamete after permutation were calculated as the product of corresponding allele probabilities and used to estimate LD measures under independence. For each syntenic SNP pair in each line, 1,000 simulated permutations were performed and the average r2 (r2H0) and D'(D'H0) under independence were estimated.
Adjustment for recombination rate
As described above, LD is expected to be a function of linkage distance in animal populations, at least for tightly linked loci. Therefore, it is important to adjust the effect of recombination rate on the extent of LD when the dependence of LD measures on allele frequencies is evaluated. To avoid the complexity of heterogeneity and dependency among LD of different SNP pairs from the same chromosome, the adjustment was performed using the averages of LD of neighboring groups within each line. To do that, all syntenic SNP pairs were divided into groups based on the size of linkage distance between the two SNPs. For this purpose, totally 85 groups including groups with estimated map distance equal to 0, 0.1, 0.2, 0.3, 0.4, and 0.5 cM were formed with a minimum 860 and maximum 40,662 pairs in each group. For a pair of SNPs from group i, its residual LD was estimated as:
(7)
for LD measures r2 and D', respectively, where LDij is the observed value of an LD measure,  is the average LD of group i.
Dependence of r2 and D' on MAF
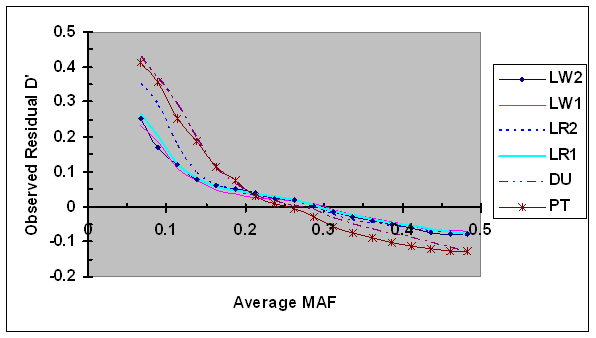
Averages of the residual D' estimated using Eq. 7 were plotted against average minor allele frequencies (Fig. 2). Highest average residual D' was observed in case of lowest MAF (0.067), and the variation among different lines was large, ranging from 0.23, to 0.43. As MAF increased to 0.15, the average residual D' decreased rapidly in all lines. As MAF continuously increased to 0.20, the average residual D' decreased rapidly in two terminal sire lines, but more moderately in four maternal lines. As MAF continuously increased from 0.20 to 0.5, the speed of reduction in D' became more moderately in all lines, although there were differences among lines. It should be noted that the number of SNP pairs with extreme MAF (both largest and smallest) was much smaller compared to the number of SNP with intermediate MAF, implying that the accuracy in bias estimation was lowest in cases of extreme MAF. The bias in PT line was probably inflated by including a proportion of SNP pairs with small sample sizes due to different project origins. These results suggest that D' is highly dependent on allele frequency, and the bias was the largest in case of lower MAF.
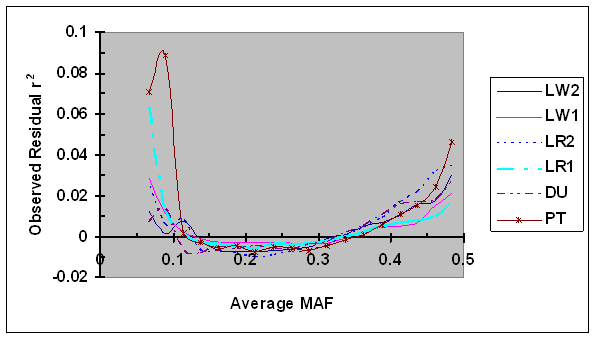
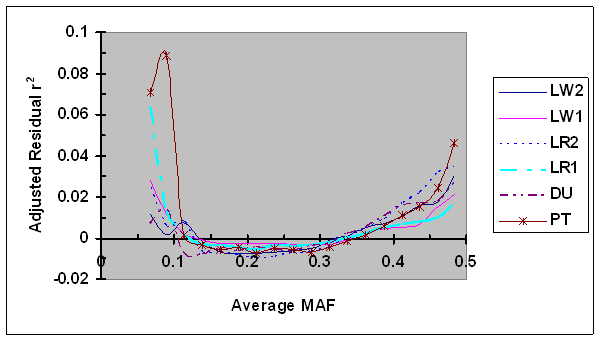
As shown in Fig. 3, the average residual r2 were consistently low (= -0.01 to 0.01) for intermediate average MAF (e.g., MAF = 0.10 to 0.40) in all six lines. When the average MAF was low (<0.10; two MAF groups with average equal to 0.067 and 0.089), a small degree of bias in average residual r2 was observed in four pig lines and the bias was considerably larger in other two lines: one maternal line (LR1) and one terminal sire line (PT). This unusually large bias in PT is probably, in part, due to the small sample size for a proportion of SNP pairs with small sample size due to different project origins. The bias in LR1 was large for one MAF group: the average residual r2 was equal to 0.063 when the average MAF was equal to 0.067. One possibility is that this bias was in part due to a relatively small number of SNP pair in this MAF group. As MAF increased from 0.40 to 0.5, the average residual r2 moderately increased in all lines. The increase of r2 due to larger than intermediate MAF was a surprise, and it appears to be partially caused by larger maximum r2 with intermediate allele frequencies: the increase is at least partially corrected when the ratio of observed r2 over r2max as defined in Eq. 5 was used (data not shown).
Average of observed D' as a function of average frequency of the minor alleles at each pair of SNPs in six pig lines. The breed origins of all lines were described in Table 1.
Average of observed r2 as a function of average frequency of the minor alleles at each pair of SNPs in six pig lines. The breed origins of all lines were described in Table 1.
LD measures as a function of MAF under independence
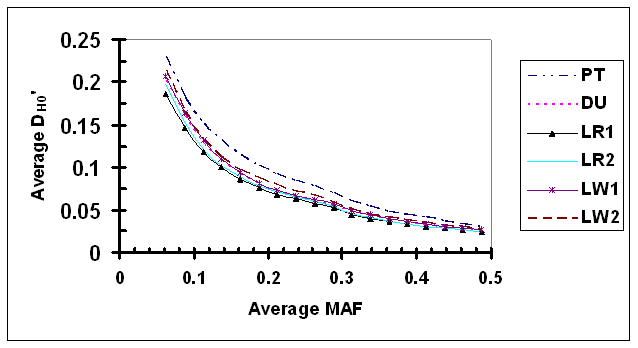
As shown in Fig. 4, D' under independence (D'H0) was clearly dependent upon the average MAF of a SNP pair. As expected, D'H0 estimated via permutation under independence was inflated most in the case of lowest average MAF in which both SNPs had low allele frequencies (average D'H0 ranged from 0.187 to 0.232 in 6 lines, when average MAF = 0.069). In comparison with results using observed genotype data, the dependency of D'H0 on allele frequency appears to be less strong. As average MAF increased, D'H0 decreased rapidly initially, and then at a slower rate. The relationship between average MAF and D'H0 appears to be smooth within each pig line. There are small but probably detectable differences among different lines. Specifically, the level of D'H0 in PT was consistently high than other lines, which is probably due to a significant proportion of SNPs genotyped for different projects with a small overlapping sample size.
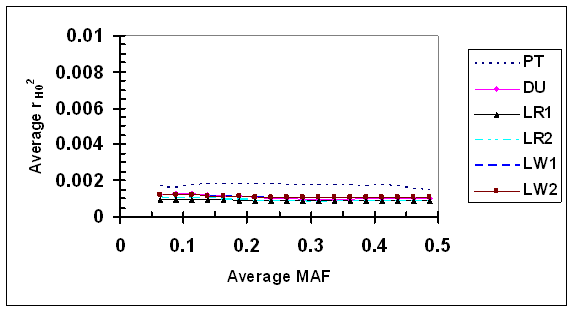
LD measure r2H0 estimated under independence was consistently low (<0.002) for all SNP pairs under evaluation (Fig. 5). Little change in r2H0 was detected, as the average MAF increased from 0.067 to 0.485, suggesting that r2H0 is independent of allele frequency in absence of LD, at least with the sample sizes used in this study. The difference in r2H0 among different lines is visible in fold but small in magnitude (all r2H0 <0.002), and one possibility is that r2H0 could be slightly affected by factors such as sample sizes.
Average D' under independence (D'H0) as a function of average frequency of the minor alleles at each pair of SNPs in six pig lines. The breed origins of all lines were described in Table 1.
Average r2 under independence (r2H0) as a function of average frequency of the minor alleles at each pair of SNPs in six pig lines. The breed origins of all lines were described in Table 1.
Dependence of adjusted r2 and D' on MAF
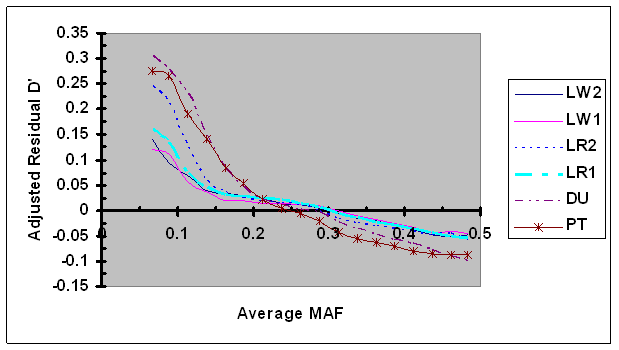
For each syntenic SNP pair under evaluation, the observed LD measure was first adjusted by LD (D'H0 or r2H0) estimated under independence and then by its linkage distance using Eq. 7. These adjusted residual D' and r2 were plotted against the average MAF (Figs. 6 and 7, respectively). As shown in Fig. 6, the dependence between adjusted residual D' and average MAF was clearly present after adjustment. However, in cases of low MAF (<0.20), the adjusted residual D' was consistently smaller than their corresponding residual D' (Figs. 2 and 6), suggesting that the adjustment of D' via D'H0 partially removed the dependency of D' on allele frequency. Moreover, the differences in bias in D' among different lines were present after D'H0 adjustment. No effect of the adjustment of residual r2 using r2H0 was detected (Fig. 7), which is consistent to the above results that showed lack of dependency of r2H0 on allele frequency under independence.
Average D' adjusted by recombination rate and D'H0 as a function of average frequency of the minor alleles at each pair of SNPs in six pig lines. The breed origins of all lines were described in Table 1.
Average r2 adjusted by recombination rate and r2H0 as a function of average frequency of the minor alleles at each pair of SNPs in six pig lines. The breed origins of all lines were described in Table 1.
7. Whole genome population-wise linkage disequilibrium in pig populations
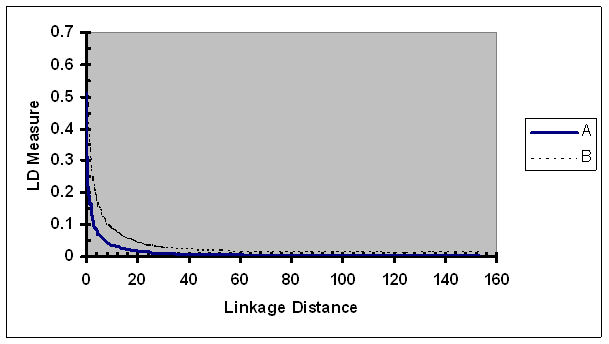
The LD measure r2 was used to evaluate the extent of whole genome population-wise LD in pig populations. No adjustment of r2 based on allele frequency was performed. Extent and range of LD in individual lines will be reported elsewhere [33]. In Fig. 8, LD measure r2 averaged over all six lines were plotted against the average linkage distance between the two SNPs of each pair. As expected, the most tightly linked SNP pairs had the highest average r2, and the observed average r2 was rapidly reduced initially as the linkage distance increased (e.g., to 3 cM). While the extent of LD was low for a pair with linkage distance larger than 5 cM (r2 < 0.07), it continuously decreased, with gradually slower speed, as linkage distance increased to 150 cM, suggesting that there is a small proportion of loosely linked SNP pairs have low level of LD.
Average of the observed LD measures adjusted by recombination rate as a function of map distance between two SNPs of each pair. A, r2; B, r2/ r2max as defined in Eq. 5.
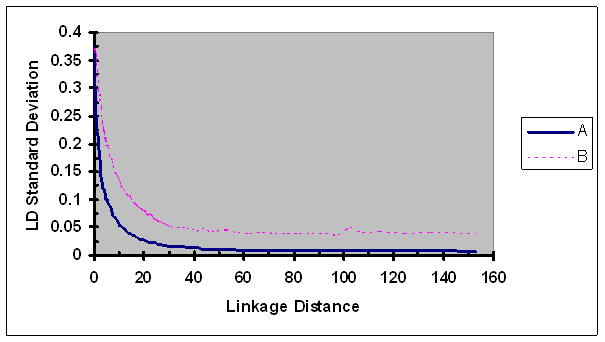
Standard deviation of the observed LD measures adjusted by recombination rate as a function of map distance between two SNPs of each pair. A, r2; B, r2/ r2max as defined in Eq. 5.
As expected, the size of r2/ r2max was considerably larger than r2 for all linkage distance groups (Fig. 8). In a similar pattern to r2, the ratio of r2 over r2max continuously decreased as the linkage distance between the SNPs increased. For a loosely linked SNP pair (e.g., >20 cM), the rate of change (defined by change per unit of linkage distance) in r2/ r2max was similar to that of r2. As linkage between two SNP of a pair became tighter, rate of change in r2/ r2max was faster than that in r2. For a pair of SNPs in very tight linkage (e.g., <0.3 cM), the rate of change in r2/ r2max was slightly slower than that of r2. One possible underlying cause to the slower rate change in r2/ r2max in case of very tight linkage is that r2 of a proportion of tightly linked SNP pairs has reached the maximum or its neighborhood of r2. For more explicit illustration, r2 was predicted for numerous linkage distances (Table 2). The most tightly linked group had the highest average r2 (0.513). As linkage distance increased to 0.1, 0.25, 0.5, 1.0, 3.0, 5.0, 10, 20, and 40 cM, the average r2 was reduced to 0.371, 0.321, 0.260, 0.206, 0.103, 0.069, 0.035, 0.018, and 0.008, respectively. These results suggested that the LD in pig populations was extended to 1 to 3 cM and is more extensive than those in human population (e.g., [29-31]).
The standard deviations of r2 estimates were estimated for each group formed based on linkage distances using data from six lines and were plotted against their corresponding linkage distances (Fig. 9). The standard deviations of r2 continuously decreased as linkage distance between two SNPs of a pair increased. The rate of change in standard deviations of r2 as a function of linkage distance was only slightly slower than those in r2. LD measure r2/ r2max displayed higher variability than r2 for all linkage distances investigated, especially for more loosely linked SNP pairs.
Effect of recombination rate on population-wise linkage disequilibrium
| Linkage distance (cM) | r2 | Linkage distance (cM) | r2 |
|---|---|---|---|
| <0.1 | 0.513 | 5 | 0.069 |
| 0.1 | 0.371 | 10 | 0.035 |
| 0.25 | 0.321 | 20 | 0.018 |
| 0.5 | 0.260 | 40 | 0.008 |
| 1 | 0.206 | 60 | 0.006 |
| 2 | 0.145 | 100 | 0.005 |
| 3 | 0.103 | 150 | 0.005 |
8. Discussion
For pair-wise LD evaluation, D' and r2 are the most commonly used LD measures (e.g., [6]). It is known that D' depends on allele frequency, especially in cases of small sample sizes (e.g., [5]). In this study, we attempted to quantify the dependency of LD measures on minor allele frequency, by forming a large number of groups based on linkage distance and adjusting the effect of recombinant rates using group means of LD measures. This approach is chosen over correction via a general linear regression analysis for the following reasons: relationship between LD and linkage distance (or recombination rate) isn't strictly linear; and a larger number of observed values should allow the adjustment of group means. The results of this study show that D' is strongly dependent on allele frequency, and the dependency continuously decreased as the average MAF increased (Fig. 2), namely as heterozygosity of the two loci increased (because heterozygosity is an increasing function of MAF for biallelic loci). In analyzing microsatellite marker genotype data, McRae et al. [12] attempted to adjust the bias in D' by fitting heterozygosity of the two loci as covariates, and showed that D' slowly increased as heterozygosity of the two loci increased, implying that high heterozygosity inflated bias in D' estimation. One probable reason for this contradiction is that D' is most sensitive to number and frequencies of minor alleles because the denominator of D' is equal to a minimum of frequency products (Eq. 4). For biallelic data (such as SNP data), lower heterozygosity strictly corresponds to lower frequency of the rare allele, and therefore, inflates D'. However, with multiallelic data (such as microsatellite markers), markers with high heterozygosity often have one/more alleles with very low frequency, resulting in much inflated D'. On the other hand, markers with lower heterozygosity often have fewer alleles with intermediate frequency, which would correspond to smaller bias in D'. Therefore, caution needs to be taken when analyzing LD of SNPs and microsatellite markers. Whether or not heterozygosity is the best covariate is questionable, especially for multiallelic data.
Still, D' has been the primary LD measure for genotype data of multiple alleles in animal populations [10 to 13]. To eliminate the dependency of D' on allele frequency and sample size, Devlin et al. [14] estimated D' under independency (D'H0) by permuting alleles at each locus independent of alleles at the other locus and proposed to adjust the observed D' by subtracting D'H0. In this study, we applied a similar permutation to evaluate the adjustment of D' and r2. Our results showed a clear dependency of D'H0 on allele frequency (Fig. 4). However, the dependency of D'H0 appears to be less severe than that in observed D', and the adjustment of D' using D'H0 only partially removes the bias caused by allele frequency: adjusted D' is still a function of allele frequency (Figs. 2, 4, and 6). One possible interpretation is that the dependency of D' in absence of LD on MAF is different from that in presence of LD.
The LD measure r2 is considerably more robust to allele frequency variation than D', albeit not completely independent of allele frequency. In general, r2 appears to be inflated when the average MAF is either too low or too high (Fig. 3). The inflation of LD in case of high MAF can be at least partially due to the dependency of the maximum of r2 on allele frequency (Eq. 7 and data not shown). Permutation results show that r2 in absence of LD (i.e., r2H0) appears to be independent of allele frequency, and the adjustment of the observed r2 by r2H0 shows no detectable effect.
In comparison to the extent in human populations, this study identified considerably more extensive LD in pig populations. However, the extent of LD found in this study appears to be somewhat lower than those implied by most previous studies using microsatellite markers (e.g., [10, 12, 13]). For example, Farnir et al. [10] suggested LD was extended to several tens of centiMorgans in a dairy cattle population, and these results were supported by several other studies [11, 12]. Although LD was detected among loosely markers in this study, the observed r2 averaged over six pig lines was generally low for loosely linked markers (e.g., r2 = 0.069, 0.035, and 0.018 for a pair of markers being 5, 10, and 20 cM apart, respectively). While LD is a property of a population, we think the discrepancy between this study and those using microsatellite markers is mainly due to the bias in D' caused by allele frequency and its interpretation of the observed D'. As an example, the average of bias in D' due to allele frequency and sample size under independence was equal to 0.26 among microsatellite markers studied by Devlin et al. [14]. For pairs with several minor alleles of very low frequencies at both loci, the probability of D' reaching 0.5 or higher can be reasonably high in case of no or low LD. Therefore, inference based on the size of D' and the proportion of marker pairs having D' ≥ 0.5 can overestimate the extent of population-wise LD. On the other hand, the extent of LD found in this study is somewhat higher than those reported by Spelman and Coppieters [15]. For example, the average level of r2 for markers within 1 and 5 MB was equal to 0.1 and 0.04 in a Jersey sample, respectively, while average level of r2 for markers with an average linkage distance of 1 and 5 cM in this study was equal to 0.206 and 0.069, respectively. These discrepancies could result from nature of different populations in two species, accuracy in linkage map marker order, and inaccurate translation between physical and genetic distances, and use of comparative information for marker order and distance.
Distinguishing “usable” and “detectable” LD has practical implications. Theoretically (namely with an infinitely large sample), all instances of LD are detectable. However, only a sufficiently large degree of LD is “usable” in an LD mapping. While the level of LD needed in an LD mapping study depends on size of QTL effect, experimental power, and sample size, not all LD is “usable” in practice. Moreover, the threshold for “usable” LD could depend on applications and the nature and accuracy of trait phenotype measurements. In a case-control study, the required sample size is approximately equal to N/r2, where N is the sample size needed for genotyping the causal mutation. The size of most segregating QTL that are targets of mapping are expected to be moderate or small, and most economically important traits are moderately or lowly heritable, implying large residual error variance. Moreover, weak LD exists among unlinked loci [10], implying that one needs a stricter p value threshold for inference of linkage. Consequently, a large sample sizes are needed to achieve reasonably high power of detection when a causal mutation is genotyped. For a large proportion of QTL, it is unrealistic to further dramatically increase sample size (e.g., >10 times) by genotyping a marker in LD with a causal mutation. Therefore, the threshold for population-wise LD in a genome-wise association study should be set to be reasonably high. To our knowledge, no LD measures exist that allow us to calculate sample size for an association study of continuous traits. Using a case-control study as an analog, we think r2 of 0.3 (or slightly lower) as a threshold of “usable” LD in experimental designs for continuous traits in pigs is appropriate.
Further analysis is needed for planning whole genome association study using r2 = 0.3 as an appropriate threshold of LD in pigs. On average, SNPs that are 0.3 cM apart have r2 = 0.3. Because a marker would be in LD with loci on both sides, 0.6 cM spacing corresponds to r2 = 0.3 for a pair of marker and underlying QTL. While 0.6 cM SNP spacing could serves as an appropriate threshold for an initial whole scan, there are substantial benefits and therefore a denser SNP map is used for the following reasons. First, approximately half of the pairs that are 0.3 cM apart will have r2 <0.3, implying an incomplete search of QTL when r2 = 0.3 is used as a threshold; Second, the variance of r2 is large for tight linked SNPs, implying that more SNP genotyping would increase the probability of having a SNP in tight LD with underlying QTL; third, to view r2 = 0.3 as a threshold in pigs, will achieve power only for moderate or large size of QTL and generally with very large sample size. On the other side, a proportion of SNP pairs will have higher r2, and QTL can be detected using more loosely linked QTL. For a genome scan that is aimed to identify a proportion of QTL using sizeable sample size, sparse spacing (e.g., 1 cM) is appropriate. Scan of sparser spacing could be interesting in special situations (e.g., limited by marker availability). Based on these observations, we recommend a density of 0.1 to 1 cM for an initial whole genome scan that uses population-wise LD. It is noted that this recommendation is considerably denser than those recommended by Nsengimana et al. [11] who suggested that genome-wise association studies are feasible in commercial pig populations at a marker density of 5 to 10 cM.
The relationship between recombinant rates and the extent of LD was proposed to be used in linkage map construction [34]. For this purpose, steep slope with minimum noise would be desirable. The results in this study indicated that there exists a strong relationship between linkage distance and LD for reasonably tightly linked loci (e.g., <5 cM), and the extent of LD is only slightly affected by linkage distance for more loosely linked loci. Therefore, using data with higher extent of LD than some minimum threshold (e.g., 0.1) is probably more efficient than using all LD data for linkage map construction. Our results also show that the variations in LD for a given range of linkage distance is generally large, suggesting it will be difficult to achieve high accuracy in linkage map construction using LD data only.
Characterization of population-wise LD will help us in rediscovering population breeding history including historic effective population sizes [7, 16] and chromosomal regions under consistent selection [19]. These areas are expected to attract more interests as genotypes of dense marker maps become more readily available. Another area that will be of great importance is the effect of presence of population-wise LD on efficiency of MAS. As more QTL are fine mapped, MAS will play an increasingly larger role in animal selection for breeding, and optimization of MAS in presence of population-wise LD will be increasingly important.
Acknowledgements
We thank MMI Genomics, Inc. (especially Sue DeNise) for their SNP data and help. We also thank Mike Grosz for his coordination in discovery of 400 Monsanto SNPs, validation, genotyping, Nengbing Tao for his work in selection and validation of SNPs, Xuelu Liu for genotype QC, Lori Yancey for her coordination in tissue banking, DNA extraction, and genotyping, Steven Murphy for tissue banking, Julie Oermann for DNA extraction, Sara DiMaria and Steve Wagner for genotyping, and Natascha Vukasinovic and Laura Grapes for their comments.
Conflict of interest
The authors have declared that no conflict of interest exists.
References
1. Hartl DL, Clark AG. Principle of Population Genetics. Sinauer Associates. 1997
2. Prichard JK, Przeworski M. Linkage disequilibrium in humans: models and data. Am. J. Hum. Genet. 2001;69:1-14
3. Bulmer MG. The effect of selection on genetic variability. The American Naturalist. 1971;105:201-211
4. Sved JA. Linkage disequilibrium and homozygosity of chromosome segments in finite populations. Theoretical Population Biology. 1971;2:125-141
5. Ardlie KG, Kruglyak L, Seielstad M. Patterns of linkage disequilibrium in the human genom. Nat. Rev. Genet. 2002;4:299-309
6. Jorde LB. Linkage disequilibrium and the search for complex disease genes. Genome Res. 2000;10:1435-1444
7. Zhao HD, Nettleton D, Soller M, Dekkers JCM. Evaluation of linkage disequilibrium measures between multi-alleleic markers as predictors of linkage disequilibrium between marker and QTL. Genet. Res. 2005;86:77-87
8. Lewontin RC. The interaction of selection and linkage. I. General considerations; heterotic model. Genetics. 1964;49:49-67
9. Hill WG, Roberson A. Linkage disequilibrium in finite populations. Theor Appl Genet. 1968;38:226-131
10. Farnir F, Coppieters W, Arranz JJ. et al. Extensive genome-wide linkage disequilibrium in cattle. Genome Res. 2000;10:220-227
11. Nsengimana J, Baret P, Haley CS, Visscher PM. Linkage desequilibrium in the domesticated pigs. Genetics. 2004;166:1395-1404
12. McRae AF, McEwan JC, Dodds KG. et al. Linkage disequilibrium in Domestic Sheep. Genetics. 2002;160:1113-1122
13. Tenesa A, Knott SA, Ward D. et al. Estimation of linkage disequilibrium in a sample of the United Kingdom dairy cattle population using unphased genotypes. J. Anim. Sci. 2003;81:617-623
14. Delvin B, Roeder K, Otto C, Tiobech S. et al. Genome-wise distribution of linkage disequilibrium in the population of Palau and its implications for gene flow in Remote Oceania. Hum. Genet. 2001;108:521-528
15. Spelman RJ, Coppieters W. Linkage disequilibrium in the New Zealand Jersey population. Proc 8th World Congr Genet Appl Livestock Prod. 2006
16. Hayes BJ, Visscher PM, McPartlan HC, Goddard ME. Novel multilocus measures of linkage disequilibrium to estimate past effective population size. Genome Res. 2003;13:635-643
17. Bengtsson BO, Thomson G. Measure the strength of associations between HLA antigens and diseases. Tissue Antigens. 1981;18:356-363
18. Delvin B, Risch N. A comparison of linkage disequilibrium measures for fine mapping. Genomics. 1995;29:311-322
19. Sabatti C, Risch N. Homozygosity and Linkage Disequilibrium. Genetics. 2002;160:1707-1719
20. Patil N, Berno AJ, Hinds DA. et al. Blocks of Limited Haplotype Diversity Revealed by High-Resolution Scanning of Human Chromosome 21. Secience. 2001;294:1719-23
21. Andersson L, Haley CS, Ellegren H. et al. Genetic mapping of quantitative trait loci for growth and fatness in pigs. Science. 1994;263:1771-4
22. Georges M, Nielsen D, Mackinnon M. et al. Mapping quantitative trait loci controlling milk production in dairy cattle by exploiting progeny testing. Genetics. 1995;139:907-920
23. Riquet J, Coppieters W, Canbisano N. et al. Fine-mapping of quantitative trait loci by identity by descent in outbred populations: application to milk production in dairy cattle. Proc. Natl. Acad. Sci. 1999;96:9252-7
24. Lande R, Thompson R. Efficiency of Marker-Assisted Selection in the Improvement of Quantitative Traits. Genetics. 1990;124:743-756
25. Meuwissen THE, Hayes BJ, Goddard ME. Prediction of total genetic value using genome-wide dense marker maps. Genetics. 2001;157:1819-1829
26. Simianer H, Flury C. Population genetics of chromosome segments. Proc 8th World Congr Genet Appl Livestock Prod. 2006
27. Laan M, Paabo S. Demographic history and linkage disequilibrium in human populations. Nature Genet. 1997;4:435-438
28. Peterson AC, DiRienzo A, Lehesjoki AE. et al. The distribution of linkage disequilibrium over anonymous genome regions. Hum. Mol. Genet. 1995;4:887-894
29. Clark AG, Weiss KM, Nickerson DA. et al. Haplotype structure and populationgenetic inferences from nucleotide-sequence variation in human lipoprotein lipase. Am. J. Hum. Genet. 1998;65:595-612
30. Daly MJ. High resolution haplotype structure in the human genome. Nature Genet. 2001;29:229-232
31. Jeffreys AJ, Kauppi L, Neumann R. Intensely punctuate meotic recombination in the class II region of the major histocompatability complex. Nature Genet. 2001;29:217-222
32. Grapes L, Vukasinovic N, Liu X. et al. Construction of an ultra-high density porcine linkage map. Plant & Animal Genome XIV Conference. 2006
33. Du F-X, Grosz MD. et al. Characterization of genome-wise linkage disequilibrium in several commercial pig lines. Manuscript.
34. Miller SP, Hayes BJ, Goddard ME. Positioning single nucleotide polymorphisms on an existing bovine map using a genetic algorithm and estimates of linkage disequilibrium. Proc 8th World Congr Genet Appl Livestock Prod. 2006
Author contact
![]() Correspondence to: Feng-Xing Du, Monsanto Company, St., Louis, MO 63137, USA. Tel: 314-694-6914; Fax: 314-694-7120; Email: fengxing.ducom
Correspondence to: Feng-Xing Du, Monsanto Company, St., Louis, MO 63137, USA. Tel: 314-694-6914; Fax: 314-694-7120; Email: fengxing.ducom

 Global reach, higher impact