Impact Factor ISSN: 1449-2288
- Issue 12; 2026
- Issue 11; 2026
- Issue 10; 2026
- Issue 9; 2026
- Issue 8; 2026
- Volume 22; 2026
- Past Issues
- Advance Articles
- Editorial Board
- Cover Images
- Index & Coverage
- Cover Suggestion
- Special Issues
1. INTRODUCTION
2. EXPERIMENTAL PROCEDURES
3. RESULTS
4. Discussion
ABBREVIATIONS
Acknowledgements
References

 Global reach, higher impact
Int J Biol Sci 2007; 3(5):263-273. doi:10.7150/ijbs.3.263 This issue Cite
Research Paper
Proteomics Analysis of the Expression of Neurogranin in Murine Neuroblastoma (Neuro-2a) Cells Reveals Its Involvement for Cell Differentiation
Nian-Lin Reena Han# *, Jing Wen*, Qingsong Lin, Pei Ling Tan, Yih-Cherng Liou, Fwu-Shan Sheu ![]()
Department of Biological Sciences, National University of Singapore, 14 Science Drive 4, Singapore 117543, Singapore
# Present address: Duke-NUS Graduate Medical School, 2 Jalan Bukit Merah, Singapore 169547.
* The first two authors contribute equally.
Received 2007-3-21; Accepted 2007-4-17; Published 2007-4-19
Abstract
Neurogranin (Ng) is a neural-specific, calmodulin (CaM)-binding protein that is phosphorylated by protein kinase C (PKC). Although its biochemical property has been well characterized, the physiological function of Ng needs to be elucidated. In the present study, we performed proteomics analysis of the induced compositional changes due to the expression of Ng in murine neuroblastoma (Neuro-2a) cells using isotope coded affinity tags (ICAT) combined with 2-dimensional liquid chromatography/tandem mass spectrometry (2D-LC/MS/MS). We found that 40% of identified proteins were down-regulated and most of these proteins are microtubule components and associated proteins that mediated neurite outgrowth. Western blot experiments confirmed the expression of α-tubulin and microtubule- associated protein 1B (MAP 1B) was dramatically reduced in Neuro-2a-Ng cells compared to control. Cell morphology of Neuro-2a-Ng showed far less neurites than the control. Serum deprivation induced the extension of only one or two long neurites per cell in Neuro-2a-Ng, contrasting to the extension of multiple neurites per control cell. Ng may be linked to neurite formation by affecting expression of several microtubule related proteins. Furthermore, the PKC activator (PMA) induced an enhanced ERK1/2 activity in the cells that expressed Ng. The mutation of Ng at S36A caused sustained increase of ERK1/2 activity, whereas the ERK1/2 activity in mutation at I33Q showed no difference compared to wild type Ng, suggesting the phosphorylation of Ng but not the CaM /Ng interaction plays an important role in ERK activation. Ng may be involved in neuronal growth and differentiation via PKC and ERK1/2 signaling pathways.
Keywords: neurogranin, calmodulin, neurite, neuron, proteomics, ERK
1. INTRODUCTION
Neurogranin (Ng) is among the most abundant proteins known to bind calmodulin (CaM) in a Ca2+-sensitive way in the brain [1]. Because the activity of CaM in cells is tightly controlled and pools of otherwise free CaM are sequestered so as to restrict its availability for activating Ca2+/CaM-dependent enzymes, the name “calpacitin” was given to a family of neuronal proteins including Ng, growth associated protein 43 (GAP-43) and the small cerebellum-enriched peptide PEP-19. All these proteins share a conserved IQ domain which is homologous to the CaM-binding domains of several other proteins. Ng is a specific protein kinase C (PKC) substrate and both the phosphorylation and oxidation of Ng significantly decrease Ng-CaM binding [2,3]. Furthermore, both phosphorylation and oxidation of Ng can mobilize intracellular Ca2+, hence increasing [Ca2+]i [4,5].
Ng has been implicated in molecular mechanisms underlying neuroplasticity and cognitive behavior. The concentration of Ng in hippocampus was observed to be correlated to the learning performance in adult mice [1]. After long-term potentiation (LTP) induction and during LTP maintenance, phosphorylation of Ng was increased in CA1 region of rat hippocampus [6, 7] whereas it was decreased in low frequency induced long-term depression (LTD) [8]. NMDA can induce rapid and transient Ng oxidation in rat brain slice [9]. Knockout studies [10] showed that Ng deletion in mice did not show obvious developmental or neuroanatomical abnormalities but had significant impairment in hippocampus-dependent spatial learning paradigm as well as changes in the induction of hippocampal long-term and short-term plasticity. In addition, the hippocampal slices of Ng knockout mice displayed a reduced activation of Ca2+/CaM-dependent kinase II (CaMKII) and PKC isozymes, as well as PKA. Subsequently, phosphorylation of downstream targets, including ERK kinase (MEK), mitogen-activated protein kinase (MAPK) and cAMP response element binding protein (CREB) were also significantly attenuated in Ng knockout mice following NMDA treatment [11]. Therefore, Ng was proposed as an upstream modulator of multiple signaling pathways in learning and memory [1].
In addition to its importance in regulating neuronal Ca2+ homeostasis and Ca2+/CaM related signaling pathway, Ng has also been found to be down-regulated in vitamin A-deficient animals and aging animals, whereas it is up-regulated in cytokine IL-2 deprived T-cell apoptosis [12]. Hence, Ng was proposed to be a pro-apoptotic factor [12]. These lines of evidence suggest that Ng may have other functions.
Although the biochemical properties of Ng have been well studied, its physiological function and molecular mechanism are still not clearly elucidated. Previous attempt to identify the proteins interacting with Ng using yeast-two-hybrid technology has demonstrated that CaM is the only major protein that interacted with Ng in vivo [13]. Yeast two-hybrid experiments are particularly useful in the detection of pair wise protein interactions but are limited in their ability to reveal the global protein constituents of protein complex/organelles of interest. The rapid development of mass-spectrometric based proteomic techniques has provided invaluable tools for studying the global protein profiles in various biological processes of complex organisms [14, 15, 16]. In the present study, we used isotope-coded affinity tag (ICAT) combined with 2-dimensional liquid chromatography/tandem mass spectrometry (2D-LC/MS/MS) to compare the difference of global pattern of protein expression between murine neuroblastoma cells (Neuro-2a) and Neuro-2a cells that stably expressed Ng (Neuro-2a-Ng). The Neuro-2a-Ng cells are very useful tool for the analysis of Ng function because there is no detectable expression of Ng in normal Neuro-2a cell. Expression differences among many functionally related proteins were identified in our results, which may account for the changes in morphology and differentiation following expression of Ng in neuronal cells. Western blotting analysis of proteins from selected functional groups confirmed the mass spectrometry results. The data reveal that Ng may play an important role in neuron development.
2. EXPERIMENTAL PROCEDURES
Cell line and transfection
Both Neuro-2a cells and human kidney embryonic 293 (HEK293) cells were routinely cultured in Dulbecco's modified Eagle Medium (DMEM) (Invitrogen, USA) containing 1% v/v penicillin-streptomycin (Gibcol, USA), 10% v/v fetal bovine serum (Clontech, USA), 25 mM of HEPES (Sigma, USA) and 3.7 g/l NaHCO3, pH 7.4-7.5. The Neuro-2a cells were transfected with pTRE-Tet-Ng and stably expressing Ng protein (Neuro-2a-Ng) [5]. The Neuro-2a-Ng cells were maintained in complete DMEM mentioned as above supplemented with 0.5 mg/ml G418 (US Biological, USA). The cells were maintained at 37˚C with 5% CO2/95% room air, in 75 cm2 tissue culture flasks (BD Falcon, USA). For serum withdraw induced differentiation, Neuro-2a and Neuro-2a-Ng cells cultured in similar density in normal complete DMEM were depleted of original medium and washed with phosphate buffer saline (PBS) twice. Serum-free DMEM was added to the culture dishes and the cells were incubated in the same conditions as previously described for 24 hr. Cell morphology images were acquired under phase contrast microscope using 20 × objective lens.
Transfection of HEK293 cells was carried out using modified calcium phosphate method. After 24 hr exposure to transfecting solution, cells were washed with culture medium, and Western blot experiments were conducted at the following 24 hr.
Construction of pEGFP-Ng and in vitro site-directed mutagenesis
Wild-type Ng cDNA was amplified from the expression plasmid pET3b-Ng [17] by PCR using 5'-Forward and 3'-reverse oligonucleotides with desired restriction sites (5' HindIII, 3' BamHI). The restriction-cleaved PCR product was ligated into the plasmid pEGFP-C2 (Clontech, CA, USA) and the entire pEGFP-Ng coding region was checked for mutations by cDNA sequencing.
Site-directed mutations were incorporated into the Ng cDNA using the PCR-based QuickChange mutagenesis kit (Stratagene, La Jolla, CA). The successful incorporation of the mutations was verified by DNA sequencing.
Western Blot
Neuro-2a and HEK293 cells were grown in 10 cm Petri-dishes and were washed with ice cold PBS twice. The cells were lysed with modified RIPA buffer which contained: 50 mM Tris-HCl pH7.4, 0.25% Na-deoxycholate, 150 mM NaCl, 1 mM EDTA, 1 mM phenylmethane-sulfonyl fluoride (PMSF), 1 µg/ml leupeptin, 1 µg/ml peptatin, 1 µg/ml aproptinin, 1 mM NaF. Protein lysates were centrifuged at 12,000g for 15 min and the supernatant was collected for protein quantification by Bradford protein assay (Bio-Rad, USA). An aliquot of total protein of 10 µg was boiled and separated electrophorectically on 15% SDS-PAGE gel and transferred onto Hybond-N nitrocellulose membrane (GE Healthcare, USA) by electroblotting. After blocking in TBST buffer (25 mM Tris-HCl pH 7.4, 1.5 M NaCl, 0.5% Tween-20) containing 5% fat-free dry milk for 1 hour, the nitrocellulose membrane sheets were incubated overnight at 4℃ with primary antibodies., After washing with TBST for five times, the membrane sheets were incubated with horseradish-peroxidase conjugated anti-rabbit or anti-mouse IgG secondary antibody (1:5000, Sigma, USA) for 1 hr. The immunoreactive bands were visualized using GE Healthcare's ECL detection kit according to the manufacturer's instructions (GE Healthcare, USA). The primary antibodies used were affinity-purified polyclonal rabbit anti-Ng (Biogen, Germany), anti-phosphor-Ng (Biogen, Germany), anti-total ERK1/2 (Cell Signaling, USA), anti-α-tubulin (clone DM1A, Sigma, USA), anti-MAP1B (Sigma, USA) and anti-GAPDH (Cell Signaling, USA). All the primary antibodies were diluted at 1:1000.
ICAT labeling
The ICAT analysis of Neuro-2a control and Neuro-2a-Ng cells were carried out using the commercially available cleavable ICAT Reagent Kit (Applied Biosystems, San Francisco, CA, USA) according to the instructions provided by manufacturer. Briefly, the cells were trypsinized and collected by centrifugation. The cell pellets were washed with ice cold PBS twice. Total proteins were dissolved in the denaturing buffer and equal amounts of proteins (100 µg) were used for ICAT analysis. After reduction and denaturation, the Neuro-2a and Neuro-2a-Ng samples were labeled with biotin-conjugated 12C (light) and 13C (heavy) reagents at 37℃ for 2 hr, respectively. The two ICAT-labeled samples were combined and digested with trypsin at a ratio of 1:10 with respect to the sample protein concentration at 37℃ for 12 to 16 hr. The digest was acidified and loaded into a cation exchange column equilibrated with 10 mM KH2PO4/25% acetonitrile, pH 2.5-3.3. After neutralization, the biotinylated-ICAT-labeled peptides were purified by avidin affinity cartridge prepared as per the manufacturer's instructions. ICAT-labeled peptides were eluted with 30% acetonitrile, 0.4% trifluoroacetic acid in water. The eluted peptides were evaporated to dryness and reconstituted in 100 μl of cleavage reagent for 2h at 37ºC to leave the biotin portion of the tag from the labeled peptides. The cleaved peptides was lyophilized to dryness and stored at -20ºC.
2D-LC and MS/MS
The ICAT labeled peptide mixture was separated using an UltimateTM dual-gradient liquid chromatography (2D-LC)-system equipped with a ProbotTM MALDI spotting device. The 2D-LC equipments, columns and protocols were obtained from Dionex/LC Packings (San Francisco, CA, USA). Briefly, the separation was performed as follows: after acid cleavage, the dried ICAT peptide mixture was dissolved in 5mM KH2PO4 buffer (pH 3 adjusted with H3PO4) with 5% acetonitrile, and the samples were injected into a 0.3 × 150 mm strong cation- exchange (SCX) column (FUS-15-CP, Poros 10S) for the first dimension separation. The mobile phase A and B were 5mM KH2PO4 buffer (pH 3 adjusted with H3PO4) with 5% acetonitrile and 5mM KH2PO4 buffer (pH3, adjusted with H3PO4) with 5% acetonitrile, 500 mM KCl, respectively. The flow rate for the SCX column was 6 μl/min. Nine fractions were separated by step gradients of mobile phase B (unbound, 0-5, 5-10, 10-15, 15-20, 20-30, 30-40, 40-50, and 50-100%). The eluting fractions were captured alternatively by two 0.3 × 1-mm trap column (3 µm C18 PepMapTM, 100 Å) and washed with 0.05% trifluroacetic acid, then eluted by gradient elution to a 0.2 × 50 mm reverse-phase column (Monolithic PS-DVB). The mobile phase A and B used for the second-dimension separation were 98% H2O, 2% acetonitrile with 0.05% trifluoroacetic acid and 80% H2O, 20% acetonitrile with 0.04% trifluoroacetic acid respectively. The gradient elution was 0-60% mobile phase B in 10 min. The flow rate was 2.7 µl/min. The LC fractions were mixed with MALDI matrix (7 mg/ml α-cyano-4-hydroxycinnamic acid and 130 µg/ml ammonium citrate in 75% acetonitrile) in a flow rate of 5.4 µl/min through a 25 nl mixing tee (Upchurch Scientific) before spotting onto 192-well stainless steel MALDI target plates (Applied Biosystems,) using a Probot Micro Fraction collector (Dionex- LC Packings), with a speed of 5 sec per well.
Mass spectrometry analysis
The samples on the MALDI target plates were analyzed using an ABI 4700 Proteomics Analyzer (Applied Biosystems) mass spectrometer with MALDI source and TOF/TOF™ optics. For mass-spectrometric (MS) analysis, typically 1000 shots were accumulated for each well of sample. MS/MS analyses were performed using nitrogen, at collision energy of 1 kV and a collision gas pressure of about 9 × 10⁻⁷ Torr. A stop condition was used so that 3,000 to 6,000 shots were combined for each spectrum depending on the spectrum quality.
MASCOT search engine (version 1.9; Matrix Science Ltd, London, UK) was used to search all of the tandem mass spectra. GPS ExplorerTM software (version 2.0, Applied Biosystems) was used to create and search files with the MASCOT search engine for peptide and protein identifications. International protein index (IPI) mouse database was used for the search and was restricted to tryptic peptides. ICAT heavy or ICAT light labeled cysteine, N-terminal acetylation and pyroglutamation (E or Q), and methionine oxidation were selected as variable modifications. One missing cleavage was allowed. Precursor error tolerance was set to <100 ppm and MS/MS fragment error tolerance < 0.3 Da. ICAT quantitation was done by the GPS ExplorerTM software and ICAT pair tolerance was set to 0.1 Da.
Image analysis
To examine the effect of the expression of Ng on the neurite growth, digital images of neurons in different conditions were taken using an inverted light microscope (Carl Zeiss, Göttingen, Germany) equipped with a digital camera (Nikon Coolpix 4500). Images of randomly-selected areas of neurons on control and Neuro-2a-Ng cells were taken at 20 × magnifications. The digital images of neurites from randomly-selected image fields were analyzed using the Image-J program (National Institutes of Health, USA). Neurite outgrowth was quantified by counting the number of neurons in a culture that produced processes twice the diameter of the cell body. The percentage of neurite-bearing cells versus the total number of cells per culture for each condition was determined. The data was plotted as the mean and standard error for each treatment at a particular time point assuming each culture as n =1.
3. RESULTS
Detection of Ng expression in Neuro-2a-Ng cells
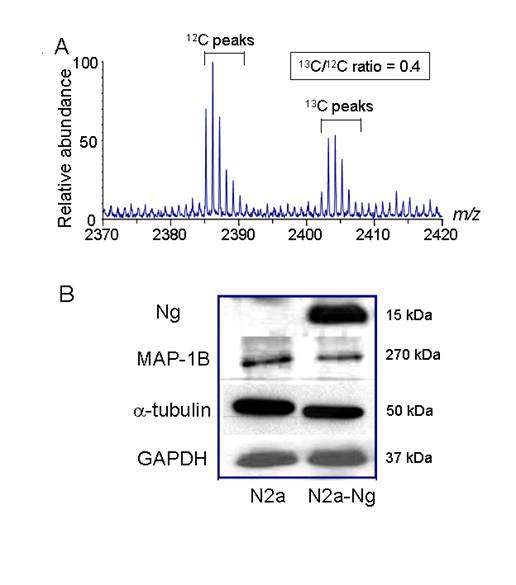
Before the ICAT experiments, Western blot was carried out to check for the expression level of Ng in the samples. In the experiments, 100 µg total proteins from Neuro-2a control and Neuro-2a-Ng cells were loaded. Previously we had reported the establishment of the stably transfected Neuro-2a cells. After transfection and screening, we had created four stable clones that expressed Ng [5]. To keep the consistency of experiments and to ensure all cells have the same expression level of protein, we used only one of the Neuro-2a clones for all experiments carried out in this paper. Western blot results using Ng antibody indicated there was an expression level comparable to 0.1 µg purified Ng control in Neuro-2a-Ng as shown in Fig. 1B. Neuro-2a control cells did not show detectable level of Ng expression. The level of Ng expression could be maintained for three months (data not shown), indicating the Neuro-2a clone was stably transfected with Ng. Since the content of Ng in Neuro-2a-Ng cells is about 0.1% of total protein, which is close to the physiological concentration [1], Neuro-2a-Ng cells could be considered as a cell line expressing Ng and therefore be used for ICAT analysis.
Cytoskeletal protein expression was down- regulated in Neuro-2a-Ng cells. A, A typical μLC/MS spectrum of an ICAT-labeled sample. Proteins from Neuro-2a-Ng cells were labeled with heavy 13C reagent and those from Neuro-2a control were labeled with 12C reagent. The 13C/12C ratio of this ICAT labeled molecular ion pair was 0.4, representing the relative abundance of one peptide derived from Neuro-2a-Ng and Neuro-2a. B, Western blot validation of ICAT mass spectrometry results. The identities and corresponding 13C/12C ratios for the protein in this figure are as follows: MAP1B (0.3), α-tubulin (0.5). GAPDH is loading control. GAPDH was used as the loading control (5 μg of protein/lane).
ICAT analysis of Neuro-2a and Neuro-2a-Ng cells
To assess changes in protein composition following the expression of Ng, the Neuro-2a control cells and Neuro-2a-Ng cells were analyzed by ICAT mass spectrometry. The extracted proteins from Neuro-2a control and Neuro-2a-Ng were labeled with light (12C) and heavy (13C) ICAT reagents, respectively; these two forms of ICAT reagent differ in mass by 9 Da. Both versions of ICAT reagents contain a biotin tag, a thiol-reactive portion and a variable linker region, which 12C- or 13C-labeled is used. In order to investigate the relative differences in terms of protein expression, one sample is labeled with the 12C version and the other with the 13C. After covalent labeling, the two extracts were combined and digested with trypsin to produce tryptic peptides. The ICAT-labeled peptides were purified using the biotin tag present in the reagent and analyzed by two dimensional liquid chromatography- tandem mass spectrometry (2D-LC-MS/MS), producing daughter ion spectra by collision-induced dissociation that can be analyzed by searching IPI database to reveal the identity of the protein from which they were digested.
Pairs of light 12C- and heavy 13C-labeled peptides are chemically identical, are easily visualized because they essentially co-elute and display a 9Da mass difference measured in a scanning mass spectrometer. The relative quantitative change of each peptide is determined by relative differences in intensity of the 12C and 13C-labeled peptides (but otherwise identical) (Fig. 1A). Previous experiments in our laboratory using equivalent proteome samples or mixture of standard proteins have suggested that ICAT measurements have a standard deviation (SD) value of 10-20%. Based on this finding, the proteins whose abundance ratios (13C/12C) were equal to or greater than 1.5 were considered as significant increase (up-regulated) after Ng expression in Neuro-2a; whereas the proteins whose abundance ratio (13C/12C) were equal to or less than 0.67 were regarded as significant decrease (down-regulated) after Ng expression. Only those up-regulated or down-regulated proteins were included in a target list for sequence analysis by 2D-LC-MS/MS. Potentially unpaired ICAT peaks were also included in the list.
A total of 103 unique peptides corresponding to 55 proteins or polypeptides prepared from Neuro-2a control and Neuro-2a- Ng were identified and quantitated, and of these 45% proteins showed significant changes. Table 1 shows a list of these proteins. We found that 72% of proteins in the list were down-regulated (H/L ratio less than 0.67), among which 50% are microtubule components and associated proteins. The rest of down-regulated proteins include heat shock proteins, translation and metabolism related proteins and ubiquitin proteasome system proteins.
List of proteins showing significantly altered expression in Neuro-2a-Ng cells
| Protein name | Accession No. | Total Ion Score C.I. % | Averaged ICAT ratio*(H/L) |
|---|---|---|---|
| Up-regulated | |||
| Gag | IPI00118848 | 100 | 1.832 |
| Gag protein | IPI00466581 | 99.999 | 1.814 |
| T-complex protein 1 subunit epsilon | IPI00116279 | 99.378 | 1.826 |
| Similar to Hsp60, mitochondrial precursor | IPI00461249 | 56.155 | 1.663 |
| Heterogeneous nuclear ribonucleoprotein U | IPI00458583 | 99.895 | 1.547 |
| Similar to aspartate aminotransferase, mitochondrial precursor | IPI00475310 | 100 | 1.542 |
| Aspartate aminotransferase, mitochondrial precursor | IPI00117312 | 100 | 1.512 |
| Down-regulated | |||
| Beta-centractin | IPI00153990 | 73.581 | 0.681 |
| Tubulin beta-3 | IPI00112251 | 99.993 | 0.67 |
| Tubulin beta-2c chain | IPI00169463 | 99.451 | 0.67 |
| Tubulin alpha-2 chain | IPI00551116 | 99.740 | 0.517 |
| Tubulin alpha-4 chain | IPI00117350 | 99.369 | 0.516 |
| Elongation factor 1-alpha 1 | IPI00307837 | 98.991 | 0.561 |
| Elongation factor 2 | IPI00466069 | 100 | 0.486 |
| Microtubule-associated protein 1B | IPI00130920 | 92.545 | 0.272 |
| Hsp105 | IPI00224109 | 80.993 | 0.559 |
| Hsp70 | IPI00331556 | 78.526 | 0.559 |
| GTP-binding nuclear protein Ran | IPI00134621 | 80.728 | 0.646 |
| Peptidyl-prolyl cis-trans isomerase | IPI00458341 | 100 | 0.619 |
| T-complex protein 1 subunit gamma | IPI00116283 | 90.604 | 0.591 |
| Tyrosine 3-monooxygenase/ tryptophan 5- monooxygenase activation protein, zeta polypeptide | IPI00473203 | 99.88 | 0.562 |
| Ubiquitin carboxyl-terminal hydrolase isozyme L1 | IPI00313962 | 100 | 0.515 |
| Isoform 1 of cellular nucleic acid binding protein | IPI00330767 | 96.078 | 0.478 |
| Fructose-bisphosphate aldolase A | IPI00221402 | 88.547 | 0 |
| Isoform 2 of zinc finger X-chromosomal protein | IPI00134496 | 31.306 | 0 |
*H/L represents the abundance ratio between heavy isotope (13C) labeled proteins (Neuro-2a-Ng) and light isotope (12C) labeled proteins (Neuro-2a control). The averaged ICAT ratios equal to or higher than 1.5 (up-regulated expression) or, alternatively, equal to or lower than 0.7 (down-regulated expression) represent a significant change in protein expression in Neuro-2a-Ng cells relative to control cells.
Cytoskeletal protein expression was down- regulated in Neuro-2a-Ng cells
From the ICAT results, many of the down-regulated proteins with the ratio less than 0.67 are related with microtubule that is important for cell morphology, differentiation, proliferation and neurite outgrowth. Western blots of α tubulin and microtubule associated protein 1B (MAP1B) were carried out in the two cell populations using specific primary antibodies. In order to distinguish the expression difference, low quantity of total protein (5 µg) was loaded. Consistent with ICAT mass spectrometry results, the expression level of both α tubulin and MAP1B was significantly reduced by 33% and 40%, respectively, in Neuro-2a-Ng cells. As the loading control, GAPDH expression level was equivalent in both cell populations (Fig.1B).
Effect of Ng expression on the cell morphology of Neuro-2a cells
Fig. 2A and 2B show the morphology of mouse Neuro-2a cell with and without the expression of Ng in serum containing medium. After 2 days in culture, most Neuro-2a cells were extending neuritis. However, Neuro-2a-Ng cells have relatively rounded cell bodies without neurites and were obviously less differentiated. The percentage of neurite-bearing cells at 48 hours is significantly lower in Neuro-2a-Ng cells than in Neuro-2a control (Fig. 2C).
Morphological effect of the expression of Ng in Neuro-2a cells. Neuro-2a-Ng displayed less differentiated appearance (B, E) compared to Neuro-2a control cells (A, D). After 24 hour serum deprivation, in contrast to the multipolar type of neurite growth observed in Neuro-2a control cells, a large number of Neuro-2a-Ng cells have a distinct differentiated morphology in which cell bodies extend only one or two long neurites that are generally unbranched. C and F are statistical analysis for neurite-bearing cells in both Neuro-2a and Neuro-2a-Ng without or with serum starvation, respectively. *p < 0.05 and **p < 0.001.
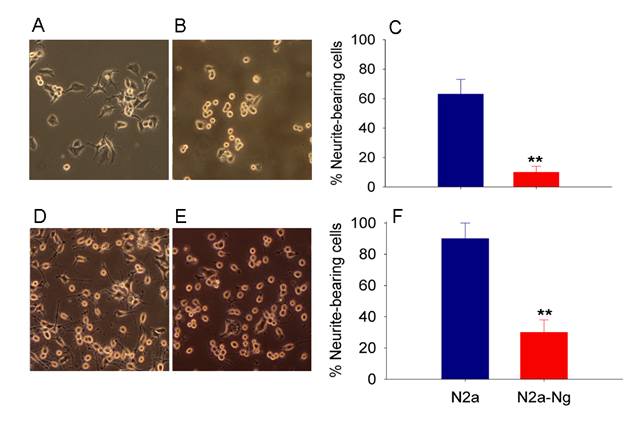
The morphological appearance of Neuro-2a and Neuro-2a-Ng cells after 24 hours of serum starvation, which induce Neuro-2a cell differentiation, is shown in Fig. 2D and 2E. Most Neuro-2a control cells have differentiated morphology characterized by rounded cell bodies with several projected neurites that often form branches and networks with others. In contrast to the multipolar type of neurite growth observed in Neuro-2a control cells, a large number of cells with expression of Ng have a distinct differentiated morphology in which cell bodies extend only one or two long neurites that are generally unbranched. The percentage of neurite-bearing cells at 24 hours of serum starvation is significantly lower in Neuro-2a-Ng cells than in Neuro-2a control (Fig. 2F). This striking morphological difference could be explained by a defect in neurite outgrowth which may be accounted for by defect in the cytoskeleton network.
The expression of Ng induced sustained activation and up-regulation of ERK1/2 phosphorylation by PMA treatment
The above results suggested that Ng may play an important role in cell differentiation and neurite growth. In order to test this hypothesis, we focused on the effect of Ng expression in ERK signaling pathway. The ERK signaling pathway regulates crucial aspects of neuronal development, including cellular survival and differentiation [18]. Activation of ERK signaling pathway has also been found to alter dendrite and axonal growth in sympathetic, sensory and spinal cord motor neurons and neurite outgrowth in PC12 cells [19, 20].
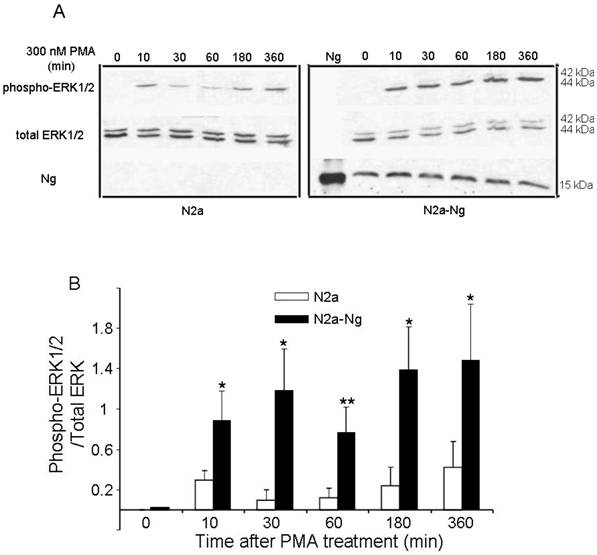
Western blot analysis in Fig. 3 demonstrates the levels of ERK phosphorylation in Neuro-2a control and Neuro-2a-Ng cells after treatment with 300 nM PMA for 0, 10, 30, 60, 180, 360 min. PMA induced an increase in phosphorylation of ERK1/2 in a fluctuated way both in the Neuro-2a control and Neuro-2a-Ng cells, rising at 10 min then slightly decreasing at 60 min followed by a second and continuous increase at 180 min. Phosphorylation levels of ERK1/2 were significantly higher at all time points in Neuro-2a-Ng cells compared to Neuro-2a control. The ratios between phospho-ERK1/2 and total-ERK were 2-4 folds elevated in Neuro-2a-Ng than Neuro-2a control.
The expression of Ng induced sustained activation and up-regulation of ERK1/2 phosphorylation by PMA treatment in Neuro-2a-Ng cells. The time points after the treatment of 300 nM PMA were shown above. The phosphorylation of ERK1/2, total ERK1/2 and Ng expression level were detected by Western blot analysis (10 μg of protein/lane) (A). The quantitation of Western blot images of the ratio between phospho-ERK1/2 and total-ERK was shown in B. *p < 0.05 and **p < 0.001, comparing Neuro-2a-Ng to Neuro-2a cells (n = 3).
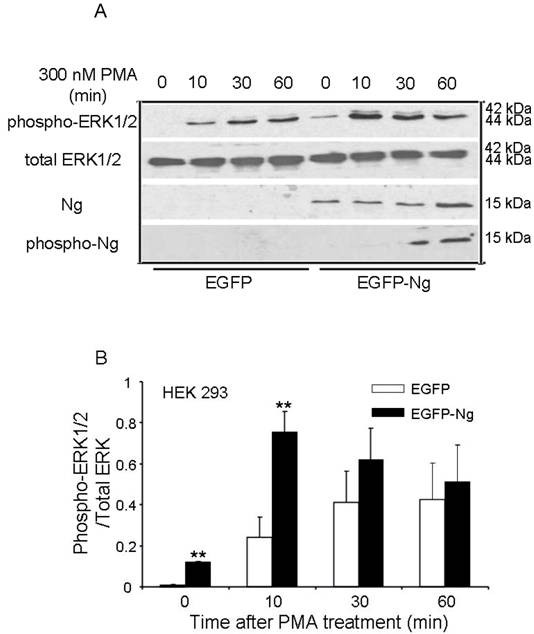
The similar results were also obtained in HEK 293 cells transiently transfected with Ng. Fig 4 shows that there was an expression level comparable to 0.1 µg Ng in HEK293 cells transfected with EGFP-Ng, whereas there was no detectable Ng expression in HEK293 cells transfected with EGFP only, which was considered as a control. In EGFP alone transfected cells, 300 nM PMA induced a fast and significant increase in ERK1/2 phosphorylation at 10 min and the phosphorylation level peaked at 30 min and lasted up to 60 min. However, EGFP-Ng transfected cells exhibited different pattern of ERK phosphorylation. The same PMA treating procedures produced a higher level of phosphorylated ERK peaked at 10 min, then gradually decreased in 30 and 60 min. Statistical analysis revealed that, at 10 min of PMA treatment, EGFP-Ng cells showed significant higher increase (two folds) in phosphorylated ERK1/2 level (p<0.005) than EGFP control cells.
Phosphorylation of ERK1/2 after 300 nM PMA treatment in HEK293 transiently transfected with EGFP or EGFP-Ng wild-type. The time points after the treatment of 300 nM PMA were shown above. The phosphorylation of ERK1/2, total ERK1/2, Ng expression level and the phosphorylation of Ng were detected by Western blot analysis (10 μg of protein/lane) (A). The quantitation of Western blot images of the ratio between phospho-ERK1/2 and total-ERK was shown in B. *p < 0.05 and **p < 0.001, comparing wild type HEK293 to HEK293 cells transfected with Ng (n = 4).
PMA induced ERK phosphorylation is mediated by PKC
Although PMA has been commonly used as a PKC activator, it was shown to have other receptors including mammalian α- and β-chimaerins [21, 22], Ras-GRP [23] and Caenorhabditis elegans Unc-13 [24]. In order to address whether the increase in ERK phosphorylation is mediated by PKC, PKC specific inhibitor GF102903X was applied to Neuro-2a-Ng cells. The immunoblot results in Fig. 5A shows pretreating with 5 µM GF102903X for 30 min almost blocked PMA induced ERK phosphorylation, indicating that PMA induced ERK phosphorylation in Neuro-2a-Ng cells is PKC-mediated.
The ERK phosphorylation induced by PMA is mediated by PKC. A, The pre-incubation with PKC specific inhibitor, 5 μM GF102903X, totally abolished the ERK1/2 phosphorylation induced by 300 nM PMA in HEK 293 transfected with Ng wild type. B, Western blot analysis of ERK1/2 phosphorylation after 300 nM PMA treatment in HEK 293 transfected with Ng wild type, S36A and I33Q mutants. The time points after the treatment of PMA were shown above.
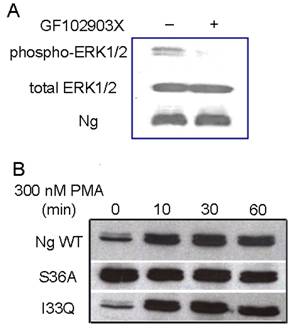
PKC is able to phosphorylate Ng through serine and it is also involved in ERK activation by various stimuli [25, 2]. In order to explore whether the phosphorylation of Ng would affect the status of ERK1/2 phosphorylation, two mutations of Ng, S36A and I33Q, were used in present study. It has been reported that the mutation of S36A totally abolished the phosphorylation of Ng and I33Q mutation completely inhibited the interaction between Ng and CaM [13]. Interestingly, our results in Fig. 5B shows that HEK293 cells with S36A mutant displayed sustained significantly higher level of ERK1/2 phosphorylation than control even before PMA treatment. Surprisingly, there was not significant different between I33Q mutant and wild type Ng in ERK1/2 phosphorylation degree throughout the whole time course. There was not any difference in total ERK1/2 levels between wild type Ng and either S36A or I33Q mutant. These results suggested that phosphorylation of Ng but not the binding ability with CaM played an important role in ERK activation.
4. Discussion
With the utilization of 2D-LC and MS/MS in combination with ICAT labeling, the present study is the first report that identified a list of proteins whose expression were affected by the expression of Ng in Neuro-2a cells. Among the down-regulated proteins, 40% are found to be either microtubule components or functionally related to microtubule assembly and stabilization, neurite outgrowth and neuron morphology, suggesting possible defects in the cytoskeleton network in Ng expressed cells. The Western blot results and image analysis of neurite growth in Neuro-2a-Ng support this conclusion. The expression of Ng in Neuro-2a cells induced a less differentiated morphology than control cells. The serum deprivation caused the differentiation of Neuro-2a-Ng cells into largely unipolar or bipolar neurite-nearing cells which is quite different from the multipolar-type neurite outgrowth observed in Neuro-2a control cells. Western blots of MAP1B and α-tubulin demonstrated a dramatically decreased expression in Neuro-2a-Ng cells. These results imply that Ng may be involved in neuronal neurite formation processes via regulation of microtubule and associated proteins.
Neurites (including both axons and dendrites) are thin, elongated, dynamic, micro- tubule-based cell protrusions which form by active outgrowth from the cell body and terminate in a dynamic, actin-rich growth cone [27]. Microtubules are essential cytoskeletal polymers that are made of repeating α/β- tubulin heterodimers and are present in all eukaryotes. Microtubules affect cell morphology, cell transport, cell motility, cell proliferation and differentiation. All of these functions involve the interaction of microtubules with a large number of microtubule-associated proteins (MAPs), which are important for the regulation and distribution of microtubules in the cell. Microtubules are highly dynamic and can switch stochastically between growing and shrinking phases, both in vivo and in vitro. This nonequilibrium behavior, known as dynamic instability [28], is based on the binding and hydrolysis of GTP by tubulin subunits. Each tubulin monomer binds one molecule of GTP and the α-tubulin GTP is locked in the interface between α- and β-tubulins. Therefore, only the β-tubulin GTP undergoes exchange and hydrolysis.
In the classic view microtubules play important roles in providing a scaffold for vesicle transport; however, recent studies in neuritogenesis have displayed microtubules as an important player in neurite initiation, morphogenesis and growth cone turning processes [27]. On the one hand, transport of specific signaling proteins down microtubules is critical for neurite initiation; on the other hand, microtubule dynamics in association with actin dynamics regulated by MAPs and a series of other proteins are required for neurite elongation.
MAP1B is the first neuronal MAP to be expressed during the development of the nervous system [29, 30] and it is a major component of the neuronal cytoskeleton. Because the expression of MAP1B is down-regulated during brain development it was suggested that this protein could play a major role during neuron morphological differentiation, a role that disappears after neuron-neuron contacts are formed [31]. The preferential localization of MAP1B in the distal axonal portion, including the growth cone, suggested a role in axon outgrowth [32, 33, 34]. Additional evidence for this has come from the generation of several MAP1B mutant mice [35, 36, 37], despite some discrepancies concerning the severity of the resulting phenotype. Thus, for example, cultured neurons from hypomorphous MAP1B mutant mice that die at birth exhibit a defect in axonal outgrowth [38]. For another mutant mouse line [38], selective defects in the central and peripheral nervous systems have been observed that persist until adulthood. Furthermore, there is growing evidence that MAP1B is also important for axonal plasticity and regeneration in the adult nervous system [39, 40, 41].
Our ICAT analysis showed various isoforms of α- and β-tubulin subunits dramatically decreased in the Ng expressed Neuro-2a cells. In addition, the proteins related to microtubule dynamic function, such as MAP1B, RanGTPase and elongation factor, are also greatly reduced. This can explain the morphological difference between Neuro-2a and Neuro-2a-Ng cells, in which the former cells displayed more neurite outgrowth than the later one. It is interesting to note that the expression of MAP1B is abundant in the newborn brain and decrease with development. By immunohistochemistry MAP 1B was found to be highly concentrated in developing axonal processes in the cerebellar molecular layer, the corticospinal tract, the mossy fibers in the hippocampus, and the olfactory nerve. Of particular interest, the mossy fiber and olfactory nerve staining persisted in the adult, indicating continued outgrowth of the mossy fibers as well as olfactory nerve axons [31]. On the other hand, the expression of Ng in brain is also developmentally regulated. The Northern blot analysis in cerebral neocortex showed that the amount of Ng mRNA was low during the prenatal period until postnatal day 8. It increased during postnatal development and reached its peak value at postnatal day 70 or postnatal month 6 [42]. After that, the amount of Ng mRNA in the cerebral neocortex decreased gradually until postnatal years 2-3. In the hippocampus, in contrast to the results in the neocortex, the expression of Ng mRNA was decreased almost continuously during the postnatal period. The expression pattern of Ng and MAP1B looks negatively correlated, implying these two elements probably behave as balancing factors in the modification of neuron plasticity and brain development.
Because of the special properties of Ng to bind CaM in a Ca2+-sensitive way and CaM is the only protein identified to interact with Ng yeast-hybrid experiment, many studies have been focused on the roles of Ng in regulating Ca2+/CaM signaling in neurons. Although Ca2+/CaM is very important in regulation of many aspects of cell function, surprisingly little is known about its influence in MAP1B function. Some data suggest that Ca2+ homeostasis plays a role in the regulation of MAPs levels [43, 44]. Recently, Seidenbecher et al. [45] reported that caldendrin, a neuronal Ca2+-sensor protein, specifically associates with the MAP1B via an interaction with light chain 3. CaM, however, is not capable of binding to light chain 3 despite its high degree of primary structure similarity with caldendrin. Whether Ng could interact with other signaling molecular to modulate the level of MAP1B during brain development, in relation to normal neuronal differentiation and disorders associated with neurodegeneration is an interesting question and worth to explore additionally.
To further investigate the role of Ng in cell growth and differentiation, we compared the extracellular-signal regulated kinase 1/2 (ERK1/2) activity in Ng expressed cells with that in control. The present study is the first report demonstrated that the expression of Ng in both Neuro-2a and HEK293 cells led to enhanced ERK phosphorylation after treatment with PMA. A PKC specific inhibitor GF102903X was able to totally abolish the ERK phosphorylation by PMA, indicating that PMA activates ERK through PKC.
The ERK1/2 is an evolutionarily conserved signaling cascade and a member of mitogen-activated protein kinase (MAPK). It plays a crucial role in gene expression, cell growth, differentiation, and apoptosis through the activation of intracellular substrates, including transcription factors and cytoskeletal proteins [46, 47]. ERK1/2 is activated by multiple extracellular stimuli, including growth factors and phorbol esters. The mechanisms of activation by various stimuli may differ, in part to control the strength and duration of the ERK response. PKC stimulation activates ERK through several pathways, including Ras-dependent and –independent mechanisms, that are not well understood [48]. It has been shown that PKC activation can be mediated by phospholipase C (PLC) [49, 50]. Our recent data exhibited that PMA raised intracellular Ca2+ concentration by activating PKC through PLC (unpublished results). The increase in intracellular calcium level may serve as an indicator of PLC activation and a cofactor for PKC activation after PMA treatment. The sustained calcium mobilization in the cells may be an essential upstream signaling regulator for the sustained ERK activation. Our results in the mutant S36A, which abolished the phosphorylation of Ng by PKC, indicated that the basal level of ERK activity was increased even before PMA treatment, suggesting the phosphorylation of Ng by PKC inhibited ERK activation. It has been known the S36A has a slightly stronger interaction with CaM than native Ng, thus it also increased the intracellular free Ca2+ concentration. On the other hand, it is noteworthy that I33Q mutant that completely inhibited the Ng's interaction with CaM, showed similar ERK activity as Ng wild type, implying that Ng/CaM interaction played little role in ERK activation.
In summary, the proteomic analysis convey us a message that Ng may have many other aspects of functions which have not yet been discovered. For example, Ng has been found to be up-regulated in cytokine interleukin- 2 deprived T-cell apoptosis [12]. It is worthy of note that some up-regulated proteins in our ICAT result list, such as HSP60, T-complex protein 1, heterogeneous nuclear ribonucleoprotein U and aspartate aminotransferase are related to DNA binding, protein folding, mitochondrion and regulation of apoptosis. Our present data provide the first evidence that Ng is involved in the regulation of ERK activity and neuronal skeleton network, suggesting its important role in neuron growth and differentiation.
ABBREVIATIONS
Ng: neurogranin; CaM: calmodulin; ICAT: isotope coded affinity tag; LC/MS/MS: liquid chromatography and tandem mass spectrometry; PMA: 12-myristate 13-acetate; ERK1/2: extracellular-signal regulated kinase; MAP1B: microtubule-associated protein 1B; GAPDH: glyceraldehyde-3-phosphate dehydrogenase.
Acknowledgements
This work was supported by Academic Research Grants of the National University of Singapore R-154-000-228-112 and R-398-000-024-112 to F.-S. S.
CONFLICT OF INTEREST
The authors have declared that there is no conflict of interest.
References
1. Huang KP, Huang FL, Jager T, Li J, Reymann KG, Balschun D. Neurogranin/RC3 enhances long-term potentiation and learning by promoting calcium-mediated signaling. J Neurosci. 2004;24:10660-10669
2. Baudier J, Deloulme JC, Van Dorsselaer A, Black D, Matthes HW. Purification and characterization of a brain-specific protein kinase C substrate, neurogranin (p17). Identification of a consensus amino acid sequence between neurogranin and neuromodulin (GAP43) that corresponds to the protein kinase C phosphorylation site and the calmodulin-binding domain. J Biol Chem. 1991;266:229-237
3. Sheu FS, Mahoney CW, Seki K, Huang KP. Nitric oxide modification of rat brain neurogranin affects its phosphorylation by protein kinase C and affinity for calmodulin. J Biol Chem. 1996;271:22407-22413
4. Cohen RW, Margulies JE, Coulter PM 2nd, Watson JB. Functional consequences of expression of the neuron-specific, protein kinase C substrate RC3 (neurogranin) in Xenopus oocytes. Brain Res. 1993;627:147-152
5. Yang HM, Lee PH, Lim TM, Sheu FS. Neurogranin expression in stably transfected N2A cell line affects cytosolic calcium level by nitric oxide stimulation. Brain Res Mol Brain Res. 2004;129:171-178
6. Gianotti C, Nunzi MG, Gispen WH, Corradetti R. Phosphorylation of the presynaptic protein B-50 (GAP-43) is increased during electrically induced long-term potentiation. Neuron. 1992;8:843-848
7. Chen SJ, Sweatt JD, Klann E. Enhanced phosphorylation of the postsynaptic protein kinase C substrate RC3/neurogranin during long-term potentiation. Brain Res. 1997;749:181-187
8. Ramakers GM, Heinen K, Gispen WH, de Graan PN. Long term depression in the CA1 field is associated with a transient decrease in pre- and postsynaptic PKC substrate phosphorylation. J Biol Chem. 2000;275:28682-28687
9. Li J, Pak JH, Huang FL, Huang KP. N-methyl-D-aspartate induces neurogranin/RC3 oxidation in rat brain slices. J Biol Chem. 1999;274:1294-1300
10. Pak JH, Huang FL, Li J, Balschun D, Reymann KG, Chiang C, Westphal H, Huang KP. Involvement of neurogranin in the modulation of calcium/calmodulin-dependent protein kinase II, synaptic plasticity, and spatial learning: a study with knockout mice. Proc Natl Acad Sci U S A. 2000;97:11232-11237
11. Wu J, Li J, Huang KP, Huang FL. Attenuation of protein kinase C and cAMP-dependent protein kinase signal transduction in the neurogranin knockout mouse. J Biol Chem. 2002;277:19498-19505
12. Devireddy LR, Green MR. Transcriptional program of apoptosis induction following interleukin 2 deprivation: identification of RC3, a calcium/calmodulin binding protein, as a novel proapoptotic factor. Mol Cell Biol. 2003;23:4532-4541
13. Prichard L, Deloulme JC, Storm DR. Interactions between neurogranin and calmodulin in vivo. J Biol Chem. 1999;274:7689-7694
14. Gygi SP, Rist B, Gerber SA, Turecek F, Gelb MH, Aebersold R. Quantitative analysis of complex protein mixtures using isotope-coded affinity tags. Nat Biotechnol. 1999;17:994-999
15. Johnson MD, Yu LR, Conrads TP, Kinoshita Y, Uo T, Matthews JD, Lee SW, Smith RD, Veenstra TD, Morrison RS. Proteome analysis of DNA damage-induced neuronal death using high throughput mass spectrometry. J Biol Chem. 2004;279:26685-26697
16. Li KW, Hornshaw MP, Van Der Schors RC, Watson R, Tate S, Casetta B, Jimenez CR, Gouwenberg Y, Gundelfinger ED, Smalla KH, Smit AB. Proteomics analysis of rat brain postsynaptic density. Implications of the diverse protein functional groups for the integration of synaptic physiology. J Biol Chem. 2004;279:987-1002
17. Miao HH, Ye JS, Wong SL, Wang BX, Li XY, Sheu FS. Oxidative modification of neurogranin by nitric oxide: an amperometric study. Bioelectrochemistry. 2000;51:163-173
18. Schaeffer HJ, Weber MJ. Mitogen-activated protein kinases: specific messages from ubiquitous messengers. Mol Cell Biol. 1999;19:2435-2444
19. Cowley S, Paterson H, Kemp P, Marshall CJ. Activation of MAP kinase kinase is necessary and sufficient for PC12 differentiation and for transformation of NIH 3T3 cells. Cell. 1994;77:841-852
20. Grewal SS, York RD, Stork PJ. Extracellular-signal-regulated kinase signalling in neurons. Curr Opin Neurobiol. 1999;9:544-553
21. Ahmed S, Lee J, Kozma R, Best A, Monfries C, Lim L. A novel functional target for tumor-promoting phorbol esters and lysophosphatidic acid. The p21rac-GTPase activating protein n-chimaerin. J Biol Chem. 1993;268:10709-10712
22. Caloca MJ, Fernandez N, Lewin NE, Ching D, Modali R, Blumberg PM, Kazanietz MG. Beta2-chimaerin is a high affinity receptor for the phorbol ester tumor promoters. J Biol Chem. 1997;272:26488-26496
23. Ebinu JO, Bottorff DA, Chan EY, Stang SL, Dunn RJ, Stone JC. RasGRP, a Ras guanyl nucleotide- releasing protein with calcium- and diacylglycerol-binding motifs. Science. 1998;280:1082-1086
24. Kazanietz MG, Lewin NE, Bruns JD, Blumberg PM. Characterization of the cysteine-rich region of the Caenorhabditis elegans protein Unc-13 as a high affinity phorbol ester receptor. Analysis of ligand-binding interactions, lipid cofactor requirements, and inhibitor sensitivity. J Biol Chem. 1995;270:10777-10783
25. He YY, Huang JL, Chignell CF. Delayed and sustained activation of extracellular signal-regulated kinase in human keratinocytes by UVA: implications in carcinogenesis. J Biol Chem. 2004;279:53867-53874
26. Rucci N, DiGiacinto C, Orru L, Millimaggi D, Baron R, Teti A. A novel protein kinase C alpha-dependent signal to ERK1/2 activated by alphaVbeta3 integrin in osteoclasts and in Chinese hamster ovary (CHO) cells. J Cell Sci. 2005;118:3263-3275
27. Dehmelt L, Halpain S. Actin and microtubules in neurite initiation: are MAPs the missing link? J Neurobiol. 2004;58:18-33
28. Desai A, Mitchison TJ. Microtubule polymerization dynamics. Annu Rev Cell Dev Biol. 1997;13:83-117
29. Crino PB, Trojanowski JQ, Eberwine J. Internexin, MAP1B, and nestin in cortical dysplasia as markers of developmental maturity. Acta Neuropathol (Berl). 1997;93:619-627
30. Cheng A, Krueger BK, Bambrick LL. MAP5 expression in proliferating neuroblasts. Brain Res Dev Brain Res. 1999;113:107-113
31. Schoenfeld TA, McKerracher L, Obar R, Vallee RB. MAP 1A and MAP 1B are structurally related microtubule associated proteins with distinct developmental patterns in the CNS. J Neurosci. 1989;9:1712-1730
32. Black MM, Slaughter T, Fischer I. Microtubule-associated protein 1b (MAP1b) is concentrated in the distal region of growing axons. J Neurosci. 1994;14:857-870
33. Bush MS, Tonge DA, Woolf C, Gordon-Weeks PR. Expression of a developmentally regulated, phosphorylated isoform of microtubule-associated protein 1B in regenerating axons of the sciatic nerve. Neuroscience. 1996;73:553-563
34. Mack TG, Koester MP, Pollerberg GE. The microtubule-associated protein MAP1B is involved in local stabilization of turning growth cones. Mol Cell Neurosci. 2000;15:51-65
35. Edelmann W, Zervas M, Costello P, Roback L, Fischer I, Hammarback JA, Cowan N, Davies P, Wainer B, Kucherlapati R. Neuronal abnormalities in microtubule-associated protein 1B mutant mice. Proc Natl Acad Sci U S A. 1996;93:1270-1275
36. Takei Y, Kondo S, Harada A, Inomata S, Noda T, Hirokawa N. Delayed development of nervous system in mice homozygous for disrupted microtubule-associated protein 1B (MAP1B) gene. J Cell Biol. 1997;137:1615-1626
37. Meixner A, Haverkamp S, Wassle H, Fuhrer S, Thalhammer J, Kropf N, Bittner RE, Lassmann H, Wiche G, Propst F. MAP1B is required for axon guidance and Is involved in the development of the central and peripheral nervous system. J Cell Biol. 2000;151:1169-1178
38. Gonzalez-Billault C, Avila J, Caceres A. Evidence for the role of MAP1B in axon formation. Mol Biol Cell. 2001;12:2087-2098
39. Nothias F, Fischer I, Murray M, Mirman S, Vincent JD. Expression of a phosphorylated isoform of MAP1B is maintained in adult central nervous system areas that retain capacity for structural plasticity. J Comp Neurol. 1996;368:317-334
40. Ma D, Nothias F, Boyne LJ, Fischer I. Differential regulation of microtubule-associated protein 1B (MAP1B) in rat CNS and PNS during development. J Neurosci Res. 1997;49:319-332
41. Bouquet C, Soares S, von Boxberg Y, Ravaille-Veron M, Propst F, Nothias F. Microtubule-associated protein 1B controls directionality of growth cone migration and axonal branching in regeneration of adult dorsal root ganglia neurons. J Neurosci. 2004;24:7204-7213
42. Higo N, Oishi T, Yamashita A, Murata Y, Matsuda K, Hayashi M. Northern blot and in situ hybridization analyses for the neurogranin mRNA in the developing monkey cerebral cortex. Brain Res. 2006;1078:35-48
43. Fifre A, Sponne I, Koziel V, Kriem B, Yen Potin FT, Bihain BE, Olivier JL, Oster T, Pillot T. Microtubule-associated protein MAP1A, MAP1B, and MAP2 proteolysis during soluble amyloid beta-peptide-induced neuronal apoptosis. Synergistic involvement of calpain and caspase-3. J Biol Chem. 2006;281:229-240
44. Fischer I, Romano-Clarke G, Grynspan F. Calpain-mediated proteolysis of microtubule associated proteins MAP1B and MAP2 in developing brain. Neurochem Res. 1991;16:891-898
45. Seidenbecher CI, Landwehr M, Smalla KH, Kreutz M, Dieterich DC, Zuschratter W, Reissner C, Hammarback JA, Bockers TM, Gundelfinger ED, Kreutz MR. Caldendrin but not calmodulin binds to light chain 3 of MAP1A/B: an association with the microtubule cytoskeleton highlighting exclusive binding partners for neuronal Ca(2+)-sensor proteins. J Mol Biol. 2004;336:957-970
46. Chang L, Karin M. Mammalian MAP kinase signalling cascades. Nature. 2001;410:37-40
47. Johnson GL, Lapadat R. Mitogen-activated protein kinase pathways mediated by ERK, JNK, and p38 protein kinases. Science. 2002;298:1911-1912
48. Cobb MH, Goldsmith EJ. How MAP kinases are regulated. J Biol Chem. 1995;270:14843-14846
49. Nishizuka Y. The molecular heterogeneity of protein kinase C and its implications for cellular regulation. Nature. 1988;334:661-665
50. Rhee SG, Bae YS. Regulation of phosphoinositide-specific phospholipase C isozymes. J Biol Chem. 1997;272:15045-15048
Author contact
![]() Correspondence to: Dr. Fwu-Shan Sheu, Department of Biological Sciences, National University of Singapore, 14 Science Drive 4, Singapore 117543. Tel: 65-65162857; Email: dbssfsedu.sg
Correspondence to: Dr. Fwu-Shan Sheu, Department of Biological Sciences, National University of Singapore, 14 Science Drive 4, Singapore 117543. Tel: 65-65162857; Email: dbssfsedu.sg