Impact Factor
ISSN: 1449-2288
Int J Biol Sci 2009; 5(3):265-275. doi:10.7150/ijbs.5.265 This issue Cite
Research Paper
Osteoarthitis of Leptin-Deficient ob/ob Mice in Response to Biomechanical Loading in Micro-CT
1. Department of Orthopaedics, University of Duisburg-Essen, Pattbergstrasse 1-3, 45239 Essen, Germany
2. Central Animal Laboratory, Clinical Centre, University of Duisburg-Essen, Hufelandstrasse 55, 45122 Essen, Germany
Received 2009-2-7; Accepted 2009-3-14; Published 2009-3-18
Abstract
Objective: Mechanotransduction is the mechanism that due to reacting chondrocytes on biomechanical loading of body mass. Higher biomechanical loading lead to increased degeneration of chondrocytes, whereas moderate loading is protecting. This suggests that body fat regulates bone metabolism first by means of hormonal factors and second that the effects of muscle and loading are signaling factors in mechanotransduction. Leptin, a peptide hormone produced predominantly by white fat cells, is one of these hormonal factors. The aim of this study was to investigate and measure the different effects of weight-bearing on trabecular bone formation in mice without the stimulation of leptin and with or without osteoarthritis. Materials and methods: 40 C57BL/ 6J ob/ob-mice in the age of 20 weeks have been devided into two groups with an ad-libitum-diet and with reduced diet. The hip- and knee-joints have been examinated in micro-CT-scan and histomorphologically. Results: Animals with an ad-libitum-diet were found to increase body weight significantly at the age of six weeks in comparison with lean mice. At the age of twenty weeks the obese mice were almost twice as heavy as the lean mice. Significant statistical differences are shown between the two groups for body weight and bone mineral density. Examination of trabecular bone in micro-CT revealed that the only statistically significant difference between the two groups was the trabecular number for the proximal femur. High weight-bearing insignificantly improved all trabecular bone parameters in the obese mice. Correlation was found between trabecular number and bone mineral density on the one hand and body weight on the other hand. The correlation between body weight and osteoarthritis shows a significant increase in grade of osteoarthritis as body weight increases in hip-joint and knee-joint but not in osteoarthritis-positive (OP) versus osteoarthritis-negative (ON) mices. The correlation of the hip-joint between micro-CT data and body weight shows an increase in these data as body weight increases in OP mices. The correlation of the hip-joint between micro-CT data and osteoarthritis shows a decrease in these data as osteoarthritis increases in OP mices. The correlation of the knee-joint between micro-CT data and body weight shows differencies between ON and OP mices. The correlation of the knee-joint between micro-CT data and osteoarthritis shows an increase in these data as osteoarthritis increases in OP mices. Conclusion: biomechanical loading led to decreased bone mineral density by a decrease in the number of trabeculae. Trabecular thickness was not increased by biomechanical loading in growing mice. Decreased body weight in leptin-deficient mice protects against bone loss. This finding is consistent with the principle of light-weight construction of bone. Differences in osteoarthritis-positive and osteoarthritis-negative mices show the eventual importance of diet in leptin-deficience. It is not possible to conclude that these results also apply to human beings.
Keywords: Bone mineral density, leptin, biomechanical loading, micro-CT, mice
Introduction
Mechanotransduction is the mechanism which causes chondrocytes to react to the biomechanical loading of body mass [1]. Higher biomechanical loading leads to increased degeneration of chondrocytes, whereas moderate loading protects these cells [2]. It is known that obesity promotes osteoarthritis [3]. Loeser et al. showed that osteoarthritis in the non-weight bearing bone of the distal radius was correlated with obesity [4]. This suggests that body fat regulates chondrocyte metabolism by means of hormonal factors, and that the effects of muscle and loading are signaling factors in mechanotransduction [5, 6]. Leptin, a peptide hormone produced predominantly by white fat cells, is one of these hormonal factors [7-12]. Recent data suggest that leptin may regulate a variety of other physiological processes, such as insulin action [13], hematopoiesis [14], immune function [2], reproduction [15] and angiogenesis [16]. Leptin inhibits appetite; consequently, mice with deficiency of leptin (ob/ob) or its receptor (db/db) are obese [8]. Takeda et al. and Karsenty et al. described the leptin-dependent central control of bone remodeling via the sympathetic nervous system [12, 17-19]. In a few recent reports the animal model was a useful surrogate to investigate the mechanism of leptin. Both leptin and its receptors were found in murine fetal cartilage and bone template, as well as in the growth plate [20]. In addition, leptin increased both proliferation and differentiation of the chondrocyte population of skeletal growth centers in organ cultures [21, 22]. Figenschau et al. showed a decreased leptin-dependent proliferation of chondrocytes [23]. Decreased leptin levels were measured in synovial fluid from subjects with osteoarthritis, which shows a higher chondrocyte activity [24]. MacDougald et al. suggested that leptin regulates the humoral and cellular immune response. Leptin receptors were found on CD (cluster of differentiation) -4 and CD-8 cells [25]. Ob/ob-mice are more likely to have osteoarthritis without synovitis. Busso et al. suggested that the absence of leptin is a risk factor for osteoarthritis [26]. In obese individuals the serum leptin levels are high. Some investigators have suggested a diabetes-like mechanism of insulin resistance which increases the effect of leptin [27, 28]. A malfunction of the blood-brain-barrier [29, 30], a defect in the receptors for transportation in the brain [31] and a blockade of SOCS-3 (suppressors of the cytokine signaling family), a potential inhibitor of leptin [32] may be reasons for resistance to leptin in obese people. Simha et al. concluded that the effect of leptin on bone metabolism may depend on the stage of life in humans [33].
While previous studies have shown that bone parameters improved with weight-bearing exercise in normal subjects, we were interested in the co-influence of biomechanical loading on body weight and bone metabolism in subjects with leptin deficiency. There is so far no agreement regarding the positive effect of leptin in the early stages of life.
The ability of three-dimensional micro-computed tomography to detect changes in a rat model was evaluated and compared with dual x-ray absorptiometry for bone mass, and bone histomorphometry for bone mass [34-40]. In our own studies we were able to demonstrate differences in trabecular bone [41, 42] and the histomorphological progress of osteoarthritis in ob/ob-mice [43].
The aim of this study was to investigate the different effects of weight-bearing on trabecular bone formation in mice without the stimulation of leptin and with or without osteoarthritis. The hip- and knee-joints have been examinated in micro-CT-scan and histomorphologically.
Materials and Methods
Animals
Leptin increase after a maximum of food intake in wildtyp mice. C57BL/ 6J ob/ob-mice with an autosomal recessive mutation on chromosome 6 shows no increasing of Leptin-serum level. After reducing the food intake the ob/ob-mice presented a higher bone mass with enlarged diaphyseal and vertebral bone, increased number and thicker trabecular than the compared group of wild-type mice. Ducy et al. described an increasing rate of bone sprotting and number of osteoclasts in age of 3-6 month [44].
Technical specifications, tomographic image, reconstruction and cancellous bone assessment by micro-CT was described in Heep et al., International Journal of Biological Science, 2008 [41].
Retrieval of histological specimens
After the preparation of the pelvis and limbs we divided the pelvis in the sagittal direction. We used “Schaffer`s solution” (1440 ml methanol, 750 ml formalin 40% neutral und 60 ml buffer (9.6g Na2HPO4 + 2H2O; 1.74g KH2PO4; 30.8g glucose; ad 1l aqua dest.)) for conservation.
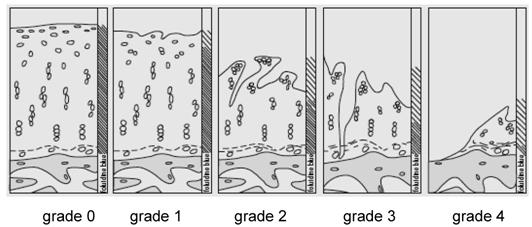
The joints were decalcified using 10% formic acid (for automatically investment compound) (Fa. Medite TPC-15, Fa. Pathotec PRO EMCI). The samples were cut into slices of 2 μm thickness for hematoxylin-eosin and Elastica van Gieson staining. We analysed the differences according to Otte's method (1969, Figure 1)[45].
Grade of Osteoarthritis according to Otte`s method (1969)
Statistical analysis
The data were analyzed and assessed using SPSS software (version 15.0; SPSS Institute Inc, Chicago, USA). Descriptive statistics of all variables were determined including the mean and standard deviation of each group. The difference of all parameters between the two groups was assessed using the Student's t-Test because all parameters were normally distributed (which was tested using the Kolmogorov Smirnov test). Pearson's correlation coefficient was used to assess the relationship between all the trabecular bone parameters of the femur and tibia. A value of p ≤0.05 was considered to be statistically significant.
Results
No death or health deterioration occurred during this study. The body weight at each time point in the two groups is shown in Figure 2.
The curves show the change in body weight in the two groups. In Group A the animals had an ad libitum diet and reached a body weight of over 50 grams after 20 weeks, the animals in Group B had a controlled diet and reached a body weight of over 35 grams after 20 weeks. Inter-group difference was already significant at the age of six weeks (p<0.05).
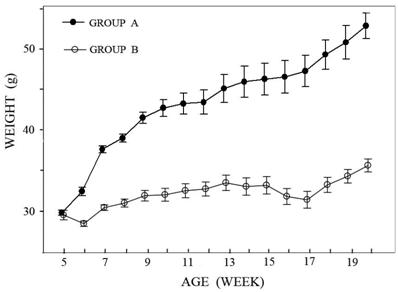
Animals with an ad libitum diet (Group A) were found to increase body weight significantly at the age of six weeks in comparison with the lean mice (Group B). From this time on, the difference increased constantly. At the age of twenty weeks the obese mice were almost twice as heavy as the lean mice.
Statistically significant differences in body weight and bone mineral density between the two groups are shown in Table 1.
Statistically significant differences between the ad-libitum-diet Group A and controlled-diet Group B for bone mineral density (BMD) and body weight (p < 0.05) at the age of 20 weeks.
| BMD | Weight (grams) | ||||
|---|---|---|---|---|---|
| Group | mean | SD | mean | SD | |
| Group A (n=20) (ad libitum diet) | 2.57 | 0.147 | 52.53 | 6.36 | |
| Group B (n=20) (controlled diet) | 2.68 | 0.138 | 35.65 | 3.50 | |
| P value | 0.022 | < 0.001 | |||
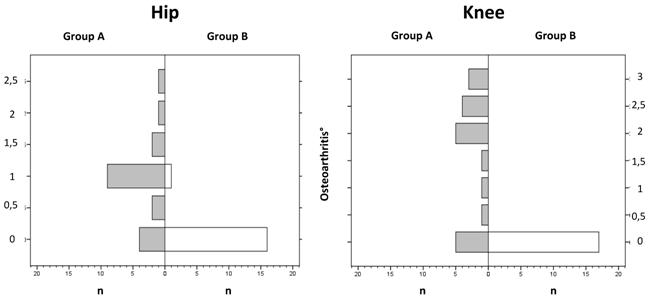
The mean value for osteoarthritis in the hip joint was 0.9° in the ad-libitum-diet Group A and 0.1° in the controlled-diet Group B. Inter-group difference was already significant (p < 0.05). No osteoarthritis was seen in the knee joints of the controlled-diet Group B, whereas in the ad-libitum-diet Group A 75% of the mice had osteoarthritis in the knee, and of these, 25% had an osteoarthritis value of 2°. The inter-group difference was already significant (p < 0.05). Osteoarthritis in the knee was greater (mean = 1.6°) than in the hip (mean = 0.9°) (p < 0.05, Figure 3).
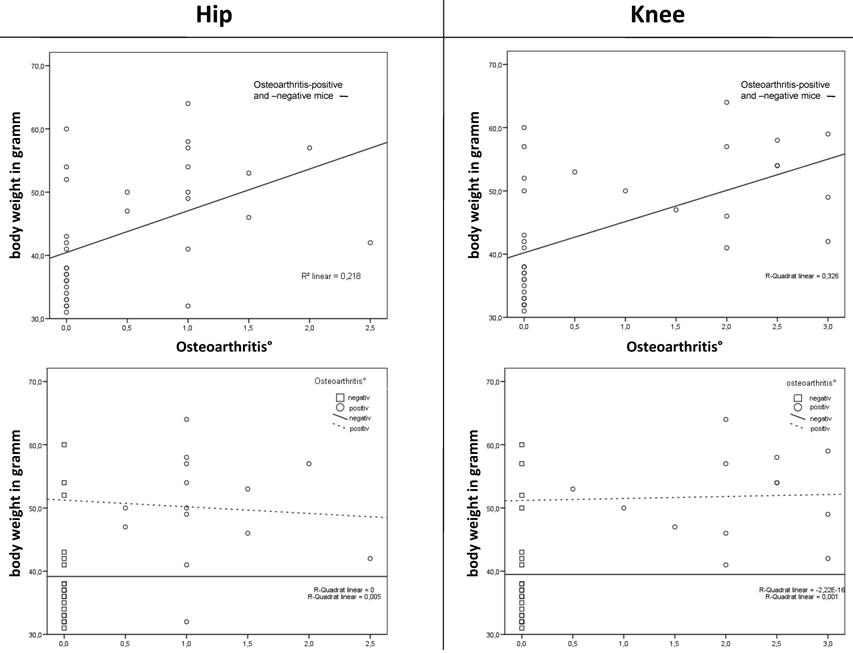
Correlation was found between body weight and the grade of osteoarthritis in the hip joint (measured by histology) in the total population. Otherwise, no correlation was found between body weight and the grade of osteoarthritis in the hips (measured by histology) of the osteoarthritis-positive mice versus the osteoarthritis-negative mice. The knee showed similar results (Figure 4, Table 2).
The distribution of osteoarthritis shows a significant decrease for a higher grade in the ad-libitum-diet Group A for the knee compared to the hip (mean = 1.6 to mean = 0.9) (p < 0.05).
The correlation between body weight and osteoarthritis shows a significant increase in the grade of osteoarthritis as body weight increased in both the hip (p < 0.002) and knee joint (p < 0.001) (superior line) but not in the osteoarthritis-positive versus the osteoarthritis-negative mice (hip: p = 0.931, knee: p = 0.637) (inferior line).
No correlation was found between bone mineral density (BMD, measured by micro-CT) and the grade of osteoarthritis in the hip and knee joints. Equally, no correlation was found between the osteoarthritis-positive mice and the osteoarthritis-negative mice (Table 2).
Correlation was found between body weight and the grade of osteoarthritis in the hip and knee joint in the total population. Otherwise, no correlation was found between body weight and the grade of osteoarthritis of the osteoarthritis-positive mice versus the osteoarthritis-negative mice. The BMD showed no correlation.
| total population (grade of OA) | OA-positive vs. OA-negative (grade of OA) | |||
|---|---|---|---|---|
| body weight | hip | n | 33 | 14 |
| r | 0.52 | -0.026 | ||
| r2 | 0.218 | |||
| p | 0.002 | 0.931 | ||
| knee | n | 34 | 13 | |
| r | 0.601 | 0.127 | ||
| r2 | 0,326 | |||
| p | < 0.001 | 0.679 | ||
| BMD | hip | n | 36 | 16 |
| r | -0.211 | 0.161 | ||
| r2 | 0.039 | |||
| p | 0.216 | 0.552 | ||
| knee | n | 37 | 15 | |
| r | -0.177 | -0.153 | ||
| r2 | 0.043 | |||
| p | 0.295 | 0.586 | ||
Examination of trabecular bone (BV/TV), trabecular number (Tb.N.) and trabecular thickness (Tb.Th.)) revealed that the only statistically significant difference between the two groups was the trabecular number (Tb.N.) for the hip. High weight-bearing insignificantly improved all trabecular bone parameters in the obese mice. Compared with the controlled-diet Group B, the BV/TV and trabecular number (Tb.N.) were slightly higher in the ad-libitum-diet Group A, but not the trabecular thickness (Tb.Th.) of the knee (Table 3).
Detailed analysis of the hip
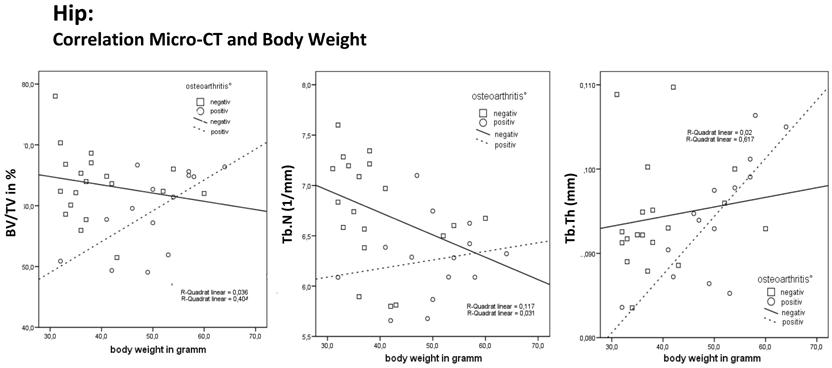
The total population showed no correlation between body weight and the BV/TV (measured by micro-CT). Otherwise, the osteoarthritis-positive mice showed a significant increase in BV/TV as their body weight increased. The osteoarthritis-negative mice showed no increase in BV/TV. Correlation between body weight and Tb.N. showed a significant decrease in trabecular number as body weight increased. The osteoarthritis-positive mice showed an insignificant increase in the Tb.N. even if their body weight increased. Otherwise, the osteoarthritis-negative mice had a reduced Tb.N.. Correlation between body weight and Tb.Th. showed a significant increase in trabecular thickness as body weight increased. The osteoarthritis-positive mice showed a significant further increase in Tb.Th. even if their body weight increased. Otherwise the osteoarthritis-negative mice showed an insignificant slight increase in Tb.Th. (Table 4).
Cross-section structural geometric properties of the femur and tibia were evaluated using micro-CT. Note: Summary of morphometric characteristics in the two groups which were different in body weight-bearing. *A statistically significant difference was detected between the two groups only in the trabecular number (Tb.N.) of the femur (p < 0.05) at the age of 20 weeks.
| Position | Group | BV/TV (%) | SD | Tb.Th (mm) | SD | Tb.N (1/mm) | SD | |
|---|---|---|---|---|---|---|---|---|
| hip | Group A (n=20) (ad libitum diet) | 60.66 | 6.13 | 0.094 | 0.0069 | 6.42 | 0.45 | |
| Group B (n=20) (controlled diet) | 62.76 | 6.5 | 0.093 | 0.0075 | 6.76 | 0.55 | ||
| P value | 0.347 | 0.412 | 0.038* | |||||
| knee | Group A (n=20) (ad libitum diet) | 52.75 | 3.94 | 0.094 | 0.0063 | 5.63 | 0.34 | |
| Group B (n=20) (controlled diet) | 54.64 | 7.48 | 0.093 | 0.0084 | 5.90 | 0.52 | ||
| P value | 0.325 | 0.561 | 0.058 | |||||
The table shows the correlation between body weight and Micro-CT data for the hip and knee (see in text above).
| total population | OA-positive | OA-negative | ||||
|---|---|---|---|---|---|---|
| body weight | BV/TV | hip | n | 37 | 16 | 21 |
| r | -0.054 | 0.636 | - 0.190 | |||
| r2 | 0.003 | 0.404 | 0.036 | |||
| p | 0.752 | 0.015 | 0.437 | |||
| knee | n | 37 | 15 | 22 | ||
| r | -0.093 | -0.213 | 0.202 | |||
| r2 | 0.009 | 0.041 | 0.045 | |||
| p | 0.583 | 0.507 | 0.354 | |||
| Tb.N | hip | n | 37 | 16 | 21 | |
| r | - 0.426 | 0.176 | - 0.342 | |||
| r2 | 0.182 | 0.031 | 0.117 | |||
| p | 0.009 | 0.547 | 0.152 | |||
| knee | n | 37 | 15 | 22 | ||
| r | -0.360 | -0.055 | -0.493 | |||
| r2 | 0.130 | 0.003 | 0.243 | |||
| p | 0.028 | 0.858 | 0.023 | |||
| Tb.Th | hip | n | 37 | 16 | 21 | |
| r | 0.397 | 0.785 | 0.140 | |||
| r2 | 0.158 | 0.617 | 0.02 | |||
| p | 0.015 | 0.001 | 0.568 | |||
| knee | n | 37 | 22 | 15 | ||
| r | 0.247 | 0.171 | 0.330 | |||
| r2 | 0.061 | 0.029 | 0.109 | |||
| p | 0.140 | 0.460 | 0.270 |
The correlation for the hip joint between relative bone volume (BV/TV), trabecular number (Tb.N.), trabecular thickness (Tb.Th.) and body weight shows an increase in BV/TV, Tb.N. and Tb.Th. as body weight increased in the osteoarthritis-positive mice and only in Tb.Th in the osteoarthritis-negative mice. The correlation shows a decrease in BV/TV and Tb.N as body weight increased in osteoarthritis-negative mice. This finding is consistent with the principle of light-weight construction of bone in osteoarthritis-negative mice.
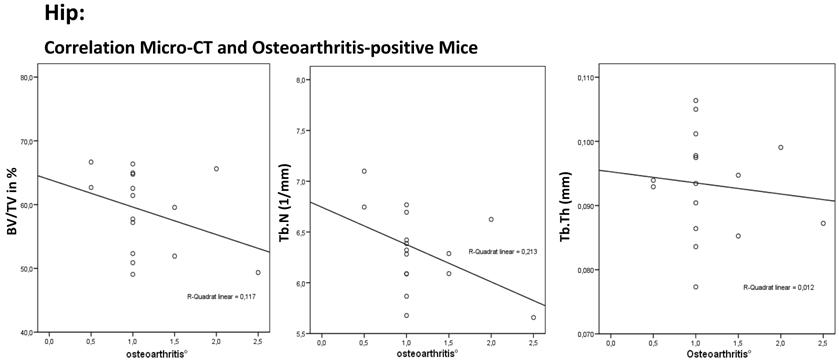
The total population showed a significant correlation between the osteoarthritis-positive mice and the BV/TV (N = 36; r = - 0.381; P = 0.022). The osteoarthritis-positive mice showed a significant decrease in BV/TV as osteoarthritis increased (N = 16; R = -0.352; P = 0.181). The correlation between osteoarthritis and Tb.N. showed a significant decrease in the trabecular number as osteoarthritis increased (N = 36; R = -0.495; P = 0.002). The osteoarthritis-positive mice showed an insignificant decrease in Tb.N. even if their osteoarthritis increased (N = 36; R = - 0.452; P = 0.079). A significant change in trabecular thickness was not found (total population: N = 36; R = -0.040; P = 0.818, osteoarthritis-positive: N = 16; R = -0.047; P = 0.862).
Detailed analysis of the knee
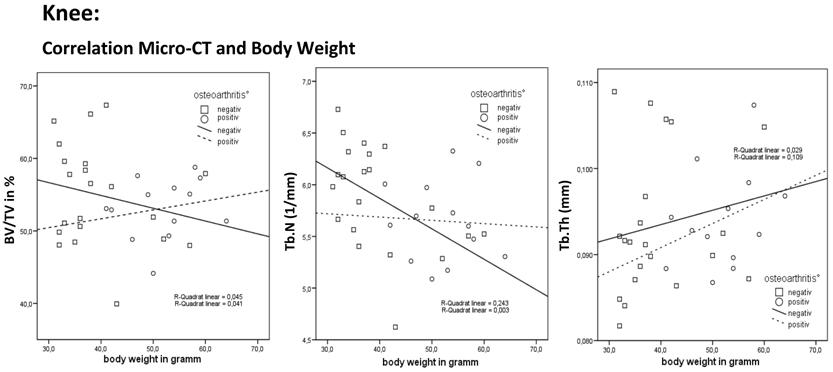
The total population showed no correlation between body weight and the BV/TV. The osteoarthritis-positive mice showed an insignificant slight increase in BV/TV as body weight increased. The osteoarthritis-negative mice showed an insignificant decrease in BV/TV. Correlation between body weight and Tb.N. showed a significant decrease in the trabecular number as body weight increased. The osteoarthritis-positive mice showed an insignificant increase in Tb.N. even if their body weight increased. Otherwise the osteoarthritis-negative mice had a significantly reduced Tb.N.. Correlation between body weight and Tb.Th. showed an insignificant increase in trabecular thickness as body weight increased. The osteoarthritis-positive and osteoarthritis-negative mice showed an insignificant increase in Tb.Th. (Table 4).
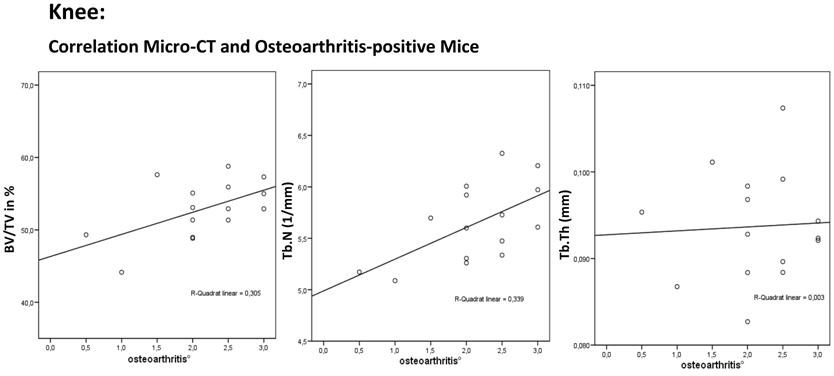
The total population showed an insignificant correlation between the osteoarthritis-positive mice and the BV/TV (N = 37; R = -0.088; P = 0.605). The osteoarthritis-positive mice showed an insignificant increase in BV/TV as osteoarthritis increased (N = 37; R = 0.420; R² = 0.305; P = 0.119). The correlation between osteoarthritis and Tb.N. showed an insignificant increase in the trabecular number as osteoarthritis increased (N = 37; R = -0.181; P = 0.284). The osteoarthritis-positive mice showed a significant increase in Tb.N. even if osteoarthritis increased (N = 15; R = 0.564; P =0.029). A significant change in trabecular thickness was not found (total population: N = 37; R = 0.086; P = 0.611, osteoarthritis-positive: N = 15; R = 0.009; P = 0.974).
The correlation for the hip joint between relative bone volume (BV/TV), trabecular number (Tb.N.), trabecular thickness (Tb.Th.) and osteoarthritis shows a decrease in BV/TV, Tb.N. and Tb.Th. as osteoarthritis increased in the osteoarthritis-positive mice. This finding shows a disturbed implementation with the principle of light-weight construction of bone.
The correlation for the knee joint between relative bone volume (BV/TV), trabecular number (Tb.N.), trabecular thickness (Tb.Th.) and body weight shows an increase in BV/TV (P = 0.354) and Tb.N. (P = 0.023) as body weight increased in the osteoarthritis-negative mice. This finding is consistent with the principle of light-weight construction of bone in osteoarthritis-negative mice.
The correlation for the knee joint between relative bone volume (BV/TV), trabecular number (Tb.N.), trabecular thickness (Tb.Th.) and osteoarthritis shows an increase in BV/TV (P = 0.119), Tb.N. (P = 0.029) and Tb.Th. (P = 0.974) as osteoarthritis increased in the osteoarthritis-positive mice. This finding shows a disturbed implementation with the principle of light-weight construction of bone.
Discussion
In our study biomechanical loading led to a decrease in bone mineral disease and the trabecular number in leptin-deficient mice. A great deal of research has confirmed that increased biomechanical loading due to increased body weight contributes to the increased bone dimensions and mass observed not only in our animal model but also in obese humans. At the same time, the increased biomechanical loading due to increased body weight contributed to an increased bone mass as a co-influence. Increased bone mineral density in childhood obesity was therefore revealed both in the weight-bearing limbs and the unloaded arms [46]. Ealy et al. showed reduced bone mineral density in the extremities of young leptin-deficient mice [47]. A quantitative computer tomography (qCT) study of healthy children suggested that weight-bearing and mechanical stresses are important determinants of cortical bone mass, whereas the bone mineral density of trabecular bone is influenced by hormonal factors associated with sexual development [48]. Because of its high cancellous bone compound the tibial proximal metaphysis is used to explain the effects of disuse, ovariectomy and hormones [36, 49, 50]. But the mice in our study were no more than twenty weeks old (in the pubertal stage) and without ovariectomy. Thus, oestrogen due to adipocytes is not a very likely confounding factor in our study.
The study by Takeda et al. demonstrated a leptin-dependent neuronal regulation of bone formation with potential therapeutic implications for osteoporosis [18]. In our study, however, there were only insignificant differences in trabecular bone mass in the ad-libitum-diet, leptin-deficient obese mice and the controlled-diet, leptin-deficient mice. In other words, it seemed that increased biomechanical loading due to increased body weight did not contribute to increased bone dimensions in the leptin-deficient subjects. In contrast, Hamrick et al. showed that the endocortical mineralizing surface, serum leptin, body weight, and percentage of body fat in C57BL/6 mice all increased between the age of six and twelve months as the activity level of the mice declined [11]. In the literature, studies differentiate between cortical and trabecular bone. Increased loading of long bones produces the greatest mechanical stress on the subperiosteal surface and stimulates bone formation by subperiosteal expansion [51]. A study of bone biomechanics in adult rats with diet-induced obesity showed significantly greater bone strength in the obese rats than in the controls [52]. Tromp et al. suggested that the effect of mechanical loading in the rat-with-backpack model mainly occurs at cortical bone sites and not in trabecular metaphyseal bone [53]. Hamrick et al. showed that the endocortical mineralizing surface, serum leptin, body weight, and percentage of body fat in C57BL/6 mice all increased between the age of six and twelve months as the activity level of the mice declined [11]. In summary, biomechanical loading led to decreased bone mineral density due to a decrease in the number of trabeculae. Trabecular thickness was not increased by biomechanical loading in growing mice. Decreased body weight in leptin-deficient mice protects against bone loss. This finding is consistent with the principle of light-weight construction of bone.
In a second step we examined the mice with and without osteoarthritis. The osteoarthritis-negative mice showed an insignificant decrease in the trabecular number. The osteoarthritis-positive mice had a higher bone volume if they had a higher body weight and a significantly higher increase in trabecular thickness. This was not seen in the osteoarthritis-negative mice. So far there has been no investigation by micro-CT of the subchondral bone of leptin-deficient mice. Boyd et al. described a decrease in bone volume in dogs with osteoarthritis after resection of the cruciate ligaments [54]. However, this loss of bone volume was observed after 54 weeks [53]. In our study we did not observe that osteoarthritis had an influence on thickness. There is a great difference between posttraumatic osteoarthritis and our model which had only a short observation period. In a study with human subjects Fazzalari et al. showed an increase in the trabecular number in the zone of osteoarthritis but described no correlation between osteoarthritis and trabecular thickness [55]. This was shown in a study on osteoarthritis by Chappard et al.. They also showed an increase in the relative volume of bone. We were able to demonstrate an insignificant increase in the knee, but not in the hip. In our data the thickness of trabecular bone seems to be more influenced by body weight than by osteoarthritis. Dumond et al. reported a leptin increase in tissue with osteoarthritis consecutive as a result of an increase in growth factors [56]. However, in our study we focused on leptin-deficient mice, therefore leptin cannot act as a stimulus.
Hamrick and Ferrari hypothesized that leptin is the most regulative connection between body weight and bone metabolism [9]. Our study showed that there must be further factors which play a role in bone metabolism, because osteoarthritis-negative mice showed an insignificant decrease in trabecular number. This finding is also consistent with the principle of light-weight construction of bone. In osteoarthritis-positive mice subchondral bone did not adapt due to increased body weight. Furthermore, it is unclear why the results for the hip and knee were different.
In summary, biomechanical loading led to decreased bone mineral density by a decrease in the number of trabeculae. Trabecular thickness was not increased by biomechanical loading in growing mice. Decreased body weight in leptin-deficient mice without osteoarthritis protects against bone loss. This finding is consistent with the principle of light-weight construction of bone. Differences between the osteoarthritis-positive and osteoarthritis-negative mice show the potential importance of diet in leptin-deficiency. It is not possible to conclude that these results also apply to human being. The aim of the following studies should be to differentiate the leptin deficiency mice and wildtype-mice.
Conflict of Interests
The authors have declared that no conflict of interest exists.
References
1. Urban J.P. The chondrocyte: a cell under pressure. Br Rheumatol J. 1994;33(10):901-8
2. Goldring M.B, Goldring S.R. Osteoarthritis. Cell Physiol J. 2007;213(3):626-34
3. Lohmander L.S. et al. Incidence of severe knee and hip osteoarthritis in relation to different measures of body mass. A population-based prospective cohort study. Ann Rheum Dis. 2009Apr;68(4):490-6
4. Loeser R.F. Systemic and local regulation of articular cartilage metabolism: where does leptin fit in the puzzle? Arthritis Rheum. 2003;48(11):3009-12
5. Gross T.S. et al. Noninvasive loading of the murine tibia: an in vivo model for the study of mechanotransduction. J Bone Miner Res. 2002;17(3):493-501
6. Warner S.E. et al. Botox induced muscle paralysis rapidly degrades bone. Bone. 2006;38(2):257-64
7. Zhang Y. et al. Positional cloning of the mouse obese gene and its human homologue. Nature. 1994;372(6505):425-32
8. Ahima R.S, Flier J.S. Leptin. Annu Rev Physiol. 2000;62:413-37
9. Hamrick M.W, Ferrari S.L. Leptin and the sympathetic connection of fat to bone. Osteoporos Int. 2008;19(7):905-12
10. Reid I.R. Relationships between fat and bone. Osteoporos Int. 2008;19(5):595-606
11. Hamrick M.W. et al. Age-related loss of muscle mass and bone strength in mice is associated with a decline in physical activity and serum leptin. Bone. 2006;39(4):845-53
12. Karsenty G. Convergence between bone and energy homeostases: leptin regulation of bone mass. Cell Metab. 2006;4(5):341-8
13. Boghossian S. et al. Hypothalamic clamp on insulin release by leptin-transgene expression. Peptides. 2006;27(12):3245-54
14. Bhatt R. et al. Long-term kindled seizures induce alterations in hematopoietic functions: role of serum leptin. Epilepsy Res. 2005;65(3):169-78
15. Popovic V, Casanueva F.F. Leptin, nutrition and reproduction: new insights. Hormones (Athens). 2002;1(4):204-17
16. Kitade M. et al. Leptin-mediated neovascularization is a prerequisite for progression of nonalcoholic steatohepatitis in rats. Hepatology. 2006;44(4):983-91
17. Karsenty G. Leptin controls bone formation through a hypothalamic relay. Recent Prog Horm Res. 2001;56:401-15
18. Takeda S. et al. Leptin regulates bone formation via the sympathetic nervous system. Cell. 2002;111(3):305-17
19. Takeda S. Central control of bone remodeling. Biochem Biophys Res Commun. 2005;328(3):697-9
20. Kume K. et al. Potential role of leptin in endochondral ossification. J Histochem Cytochem. 2002;50(2):159-69
21. Maor G. et al. Leptin acts as a growth factor on the chondrocytes of skeletal growth centers. J Bone Miner Res. 2002;17(6):1034-43
22. Nakajima R. et al. Effects of leptin to cultured growth plate chondrocytes. Horm Res. 2003;60(2):91-8
23. Figenschau Y. et al. Human articular chondrocytes express functional leptin receptors. Biochem Biophys Res Commun. 2001;287(1):190-7
24. Goldring M.B. The role of the chondrocyte in osteoarthritis. Arthritis Rheum. 2000;43(9):1916-26
25. MacDougald O.A. et al. Regulated expression of the obese gene product (leptin) in white adipose tissue and 3T3-L1 adipocytes. Proc Natl Acad Sci U S A. 1995;92(20):9034-7
26. Busso N. et al. Leptin signaling deficiency impairs humoral and cellular immune responses and attenuates experimental arthritis. Immunol J. 2002;168(2):875-82
27. Flier J.S. Clinical review 94: What's in a name? In search of leptin's physiologic role. J Clin Endocrinol Metab. 1998;83(5):1407-13
28. Friedman J.M, Halaas J.L. Leptin and the regulation of body weight in mammals. Nature. 1998;395(6704):763-70
29. Caro J.F. et al. Decreased cerebrospinal-fluid/serum leptin ratio in obesity: a possible mechanism for leptin resistance. Lancet. 1996;348(9021):159-61
30. Schwartz M.W. et al. Cerebrospinal fluid leptin levels: relationship to plasma levels and to adiposity in humans. Nat Med. 1996;2(5):589-93
31. Wu-Peng X.S. et al. Phenotype of the obese Koletsky (f) rat due to Tyr763Stop mutation in the extracellular domain of the leptin receptor (Lepr): evidence for deficient plasma-to-CSF transport of leptin in both the Zucker and Koletsky obese rat. Diabetes. 1997;46(3):513-8
32. Bjorbaek C. et al. Divergent signaling capacities of the long and short isoforms of the leptin receptor. Biol Chem J. 1997;272(51):32686-95
33. Simha V. et al. Effect of subcutaneous leptin replacement therapy on bone metabolism in patients with generalized lipodystrophy. J Clin Endocrinol Metab. 2002;87(11):4942-5
34. Ruegsegger P, Koller B, Muller R. A microtomographic system for the nondestructive evaluation of bone architecture. Calcif Tissue Int. 1996;58(1):24-9
35. Laib A. et al. 3D micro-computed tomography of trabecular and cortical bone architecture with application to a rat model of immobilisation osteoporosis. Med Biol Eng Comput. 2000;38(3):326-32
36. Barou O. et al. High-resolution three-dimensional micro-computed tomography detects bone loss and changes in trabecular architecture early: comparison with DEXA and bone histomorphometry in a rat model of disuse osteoporosis. Invest Radiol. 2002;37(1):40-6
37. Nuzzo S. et al. Quantification of the degree of mineralization of bone in three dimensions using synchrotron radiation microtomography. Med Phys. 2002;29(11):2672-81
38. Ding M, Odgaard A, Hvid I. Changes in the three-dimensional microstructure of human tibial cancellous bone in early osteoarthritis. J Bone Joint Surg Br. 2003;85(6):906-12
39. Schmidt C. et al. Precision and accuracy of peripheral quantitative computed tomography (pQCT) in the mouse skeleton compared with histology and microcomputed tomography (microCT). J Bone Miner Res. 2003;18(8):1486-96
40. Waarsing J.H. et al. Detecting and tracking local changes in the tibiae of individual rats: a novel method to analyse longitudinal in vivo micro-CT data. Bone. 2004;34(1):163-9
41. Heep H. et al. Differences in trabecular bone of leptin-deficient ob/ob mice in response to biomechanical loading. Int J Biol Sci. 2008;4(3):169-75
42. Heep H. et al. No Adaptions in Bone of Leptin-Deficient ob/ob Mice in Response to Loading. Biomaterialien. 2008;9(1):18-25
43. Heep H. et al. Osteoarthritis of Young Leptin-Deficiency ob/ob Mice in Response of biomechanical loading. Zeitschrift für Osteologie. 2009 in press
44. Ducy P. et al. Leptin inhibits bone formation through a hypothalamic relay: a central control of bone mass. Cell. 2000;100(2):197-207
45. Otte P. [The nature of coxarthrosis and principles of its management]. Dtsch Med J. 1969;20(10):341-6
46. Hla M.M. et al. A multicenter study of the influence of fat and lean mass on bone mineral content: evidence for differences in their relative influence at major fracture sites. Early Postmenopausal Intervention Cohort (EPIC) Study Group. Am Clin Nutr J. 1996;64(3):354-60
47. Ealey K.N. et al. Bone abnormalities in adolescent leptin-deficient mice. Regul Pept. 2006;136(1-3):9-13
48. Mora S. et al. Age-related changes in cortical and cancellous vertebral bone density in girls: assessment with quantitative CT. AJR Am Roentgenol J. 1994;162(2):405-9
49. Iwamoto J, Yeh J.K, Aloia J.F. Differential effect of treadmill exercise on three cancellous bone sites in the young growing rat. Bone. 1999;24(3):163-9
50. Iwamoto J, Yeh J.K, Takeda T. Effect of vitamin K2 on cortical and cancellous bones in orchidectomized and/or sciatic neurectomized rats. J Bone Miner Res. 2003;18(4):776-83
51. Zhang P, Yokota H. Effects of surgical holes in mouse tibiae on bone formation induced by knee loading. Bone. 2007;40(5):1320-8
52. Brahmabhatt V. et al. The effects of dietary-induced obesity on the biomechanical properties of femora in male rats. Int J Obes Relat Metab Disord. 1998;22(8):813-8
53. Dedrick D.K. et al. A longitudinal study of subchondral plate and trabecular bone in cruciate-deficient dogs with osteoarthritis followed up for 54 months. Arthritis Rheum. 1993;36(10):1460-7
54. Boyd S.K. et al. Early morphometric and anisotropic change in periarticular cancellous bone in a model of experimental knee osteoarthritis quantified using microcomputed tomography. Clin Biomech (Bristol, Avon). 2000;15(8):624-31
55. Fazzalari N.L, Parkinson I.H. Fractal properties of subchondral cancellous bone in severe osteoarthritis of the hip. J Bone Miner Res. 1997;12(4):632-40
56. Dumond H. et al. Evidence for a key role of leptin in osteoarthritis. Arthritis Rheum. 2003;48(11):3118-29
Author contact
![]() Correspondence to: Dr. med. Hansjoerg Heep, Department of Orthopaedics, University of Duisburg-Essen, Pattbergstr. 1-3, D-45329 Essen. hansjoerg.heepde; Phone: 0201/4089-2147; Fax: 0201/4089-2722
Correspondence to: Dr. med. Hansjoerg Heep, Department of Orthopaedics, University of Duisburg-Essen, Pattbergstr. 1-3, D-45329 Essen. hansjoerg.heepde; Phone: 0201/4089-2147; Fax: 0201/4089-2722

 Global reach, higher impact