Impact Factor ISSN: 1449-2288

 Global reach, higher impact
Int J Biol Sci 2010; 6(7):773-783. doi:10.7150/ijbs.6.773 This issue Cite
Research Paper
Modulation of Mitochondrial Permeability Transition Pore Affects Multidrug Resistance in Human Hepatocellular Carcinoma Cells
Xianlong Ling, Yuan Zhou, Shi-Wei Li, Bin Yan, Lei Wen ![]()
Department of Gastroenterology, Xinqiao Hospital, Third Military Medical University, Chongqing, 400037, P R. China
Received 2010-10-25; Accepted 2010-11-30; Published 2010-12-6
Abstract
Multidrug resistance (MDR) is a critical problem in the chemotherapy of cancers. Human hepatocellular carcinoma (HCC) responds poorly to chemotherapy owing to its potent MDR. Chemotherapeutic drugs primarily act by inducing apoptosis of cancer cells, and defects in apoptosis may result in MDR. Mitochondrial permeability transition (mPT) is implicated as an important event in the control of cell death or survival and mPT represents a target for the development of cytotoxic drugs. This study aimed to investigate the effects of selective opener (Atractyloside glycoside, ATR) and inhibitor (Cyclosporine A, CsA) of mitochondrial permeability transition pore (mPTP) on a CDDP-resistant HCC cell line (SK-Hep1 cells). In this study, a stable MDR phenotype characterization of SK-Hep1 cell line (SK-Hep1/CDDP cells) was established and used to investigate the role of mPTP in MDR. Results suggested that ATR accelerated the decrease of mitochondrial membrane potential (ΔΨm), reduced the Bax activity, and increased the apoptosis of SK-Hep1/CDDP cells; while CsA inhibited mPTP opening, reduced and delayed the decline of mitochondrial membrane potential, and increased the Bax activity, leading to increased tolerance of SK-Hep1/CDDP cells to apoptosis induction. However, mPTP activity had no effect on the expression of MDR1 in cells,meanwhile the P-gp translocation to mitochondria was increased, and functionally activated. In conclusion, selective modulation of mPTP can affect MDR in human HCC cells. Therefore, activation of mPTP may provide a new strategy to sensitize cancer cells to chemotherapeutic drugs and to reverse the MDR in cancer cells.
Keywords: hepatocellular carcinoma, mitochondrial permeability transition pore, multidrug resistance, mitochondrial membrane potential.
Introduction
Hepatocellular carcinoma (HCC) is the most common tumor worldwide, and the third most common cause of cancer death, often accompanied with poor prognosis [1-3]. A majority of patients are surgically un-resectable at the time of diagnosis, and even for those surgery is possible, the risk of recurrence is extremely high. Consequently, chemotherapy is an important strategy for most HCC patients. Cisplatin has been used as a common chemotherapeutic agent for HCC. However, the HCC still poorly responds to Cisplatin due to its intrinsic or acquired mitldrug resistance (MDR) and the survival of HCC patients is unfavorable [4,5]. Multidrug resistance (MDR) is a critical problem in the chemotherapy of cancers [6]. MDR describes a phenomenon of cross-resistance of tumor cells to several structurally and functionally unrelated antitumor drugs after exposure to a single cytotoxic drug. But the exact mechanism of MDR remains unclear.
Mitochondria not only provide the essential energy for life activities, but also take part in various signal transductions. Induction of apoptosis is a common way in which chemotherapy drugs eliminate tumor cells. Nowadays, mitochondria now represent a novel target in cancer chemotherapy [7]. Regulation of mitochondrial function can not only protect the normal cells from the initiation of apoptosis, but also induce the release of apoptotic proteins leading to apoptosis of tumor cells.
Mitochondrial permeability transition (mPT) is implicated in apoptosis or necrosis as an important event in the control of cell death or survival. Opening of mitochondrial permeability transition pore (mPTP) renders the cancer cells to show the characteristics of apoptosis by promoting the release of apoptotic protein. Thus, modulation of mPTP may provide a new strategy for the reversal of MDR.
In the present study, a MDR hepatocellular carcinoma cell line (SK-Hep1/CDDP) was established to investigate the role of mPTP in the MDR of cancer cells. Our study may provide a new strategy for the reversal of MDR in cancer cells.
Materials and methods
Reagents
Cisplatin (CDDP), doxorubicin (DOX), penicillin, streptomycin, propidium iodide (PI), RNase A, Rho123 and Atractyloside glycoside (ATR) were purchased from the Sigma-Aldrich Chemical Co (St. Louis, MO, USA). Vincristine (VCR) was from Shenzhen Main Luck Pharmaceuticals Inc. (Shenzhen, China),5-fluorouracil (5-FU)from Shanghai Xudong Haipu Pharmaceutical Co. Ltd (Shanghai, China), Cyclosporine A( CsA) from Novartis (Sandimmun, Novartis Pharma AG, Stein, Switzerland), Dulbecco's modified Eagle's medium (DMEM), fetal bovine serum (FBS) and Trypsin from Invitrogen (Carlsbad, CA, USA). The phospho-glycoprotein (P-gp) MDR1 mouse monoclonal antibody and FITC-conjugated goat anti-mouse IgG were purchased from Santa Cruz Biotechnology (Santa Cruz, CA, USA), MitoTracker Red CMXRos dye from Invitrogen (Molecular Probes, Invitrogen Corp.), JC-1 from Cell Technology Inc., USA, Cell Counting Kit-8 (CCK-8) from Dojindo Molecular Technologies (Dojindo, Japan), Annexin VFITC/PI apoptosis detection kit from Nanjing KeyGen Biotech Co., Ltd (Nanjing, China), and cell culture supplies from Corning Life Sciences (Lowell, MA, USA). Anti-tumor agents were prepared with complete culture medium immediately prior to use.
Cell line and culture
The human HCC cell line SK-Hep1 cells (purchased from Cell Culture Center, Institute of Biochemistry and Cell Biology, Chinese Academy of Life Sciences, Shanghai) were maintained in high glucose DMEM (DMEM/H) containing 10% (v/v) fetal bovine serum (FBS), penicillin (200 U/mL), and streptomycin (100 μg/mL) at 37°C in a humidified air with 50 mL/L CO2. Approximately 1.0x10⁵ cells were seeded in a 25-mm dish, and the medium was refreshed 24 h later. Two to three days later, these cells were sub-cultivated following digestion with 0.25 g/L trypsin, and seeded in another 25-mm dish.
Establishment of SK-Hep1 cells resistant to CDDP (SK-Hep1/CDDP)
CDDP-resistant SK-Hep1 (SK-Hep1/CDDP) cells were established by pulse exposure of SK-Hep1 cells to high concentration (5 μg/ml) of CDDP for short periods over 24 h as previously reported [8]. Briefly, SK-Hep1 cells were washed with 0.01 mol/L PBS and grown in CDDP-free growth medium for one to two days. Following washing with PBS, these cells were maintained in a fresh medium. The resistant cells were isolated by limiting dilution of cis-Diaminedichloroplatinum(CDDP). After 4 weeks' incubation at 37°C in a humidified air with 50 mL/L CO2, the cells recovered at an exponential rate and were then sub-cultivated. Once cell confluence reached 60-70%, the procedures above were repeated. The acquired resistance was confirmed when these cells were able to maintain logarithmic growth upon addition of cisplatin to the medium. The CDDP-resistant cells were established 6 months later. For maintenance of CDDP-resistant cells, the SK-Hep-1/CDDP cells were grown in the presence of 0.01 μg/mL CDDP. Before experiment, SK-Hep-1/CDDP cells were maintained in a CDDP-free medium and passaged at least 3 times.
Cell preparation
SK-Hep1 and SK-Hep1/CDDP cells were maintained at 37°C in humidified air with 5%CO2 in DMEM/H containing 10% FBS, 200 U/mL penicillin, and 100 μg/mL streptomycin. Cells were divided into the following groups: ①SK-Hep1 cells; ②1 μM CsA treated SK-Hep1 cells; ③20 μM ATR treated SK-Hep1 cells; ④SK-Hep1/CDDP cells; ⑤ 1 μM CsA treated SK-Hep1/CDDP cells; ⑥20 μM ATR treated SK-Hep1/CDDP cells. All cells were grown for 24 h.
Cytotoxicity of CDDP determined by CCK-8 assay
The cytotoxicity of CDDP was determined in different groups by CCK-8 assay according to manufacturer's instructions.The absorbance (A) represents the number of viable cells and is detected with enzyme-linked immunosorbent assay (ELISA; measuring wavelength: 450 nm; reference wavelength: 650 nm) in a microplate reader. Relative inhibition rate was calculated as follow: relative inhibition rate (%) = (1-A of treated well/A of control well)×100%, and the half maximal inhibitory concentration (IC50) was calculated with the SPSS version 13.0 statistic software package. The resistance index (RI) was calculated as follow: RI = IC50 of resistant cells/IC50 of parental cells.
Flow cytometric analysis using Annexin V/PI double-staining
The changes in cell apoptosis were detected with FITC-annexin V/PI double-fluorescence labeling and subsequent flow cytometry (FCM). Cells of each group were seeded into 6-well plate in triplicate at a density of 1×10⁵ cells/mL. Following treatment with 10 μg/mL CDDP for 24 h, cells were harvested and cell density was adjusted to 1×10⁵/mL followed by centrifugation at 1500 rpm for 5 min. The supernatant was removed, and the cells were incubated in 5 μL of Annexin V, 195 μL of buffer and 20 μL of PI for 20 min in dark. Then, 5×10⁴ cells were collected from each group followed by flow cytometry at the excitation wavelength of 488 nm. Data were analyzed using Cellquest software with untreated SK-Hep1 cells and SK-Hep1/CDDP cells as controls.
Evaluation of mitochondrial membrane potential (ΔΨm) by JC-1 staining assay
Mitochondrial membrane potential (ΔΨm) was detected with JC-1 mitochondrial membrane potential detection kit following the manufacturer's instructions. Briefly, 5×10⁶ cells were collected and re-suspended in 1 mL of medium. After adding 1 mL of working solution of JC-1 dye, the cells were mixed thoroughly and incubated at 37 ℃ for 20 min in dark. The excessive dye was removed by washing with JC-1 staining buffer. Cells were centrifuged at 1000 rpm for 3 min at room temperature, and the supernatant was removed. The cells were then re-suspended in 500 μL of JC-1 staining working solution by slightly shaking and monitored under laser scanning confocal microscope (Leica Tcs SP2, Germany). JC-1 monomer (green fluorescence) has excitation wavelength of 488 nm and emission wavelength of 505~530 nm. When the ΔΨm is low, JC-1 exists mainly in the form of monomer showing green fluorescence. When the ΔΨm is high, JC-1 forms polymers emitting red fluorescence. The average fluorescence intensity of 10 randomly selected visual fields was calculated with IPP software, and the ratio of red fluorescence intensity to green fluorescence intensity indicates the level of ΔΨm. Reduction in this ratio implies a decline in ΔΨm.
Expressions of MDR1 and Bax by Western blot
Cells from different groups were lysed with protein lysis buffer, and the concentration of total protein in the supernatant was measured using BCA method. After denaturation by boiling, 20 μg of total protein were separated by 10% polyacrylamide gel electrophoresis and then transferred onto PVDF membrane (Roche) by semi-dry transfer. Blocking was done with 5% non-fat milk at room temperature for 1 h. Then, these membranes were incubated with primary antibodies (1:500 for MDR1 and 1:1000 for Bax) overnight at 4 ℃. After washing with TBST (0.05% Tween-20 in TBS), the membranes were incubated with horseradish peroxidase conjugated secondary antibody (l: 10,000) at 37 ℃ for 1 h. The membrane was then washed with TBST, and chemiluminescent substrate ECI was used to visualize the bands. The optical density of each band was analyzed with Gel-Pro gel analysis software (Bio-Rad Inc.). Relative protein expressions were expressed as the density ratio of target protein to respective β-actin. The average expression of each protein was calculated from 3 independent experiments.
MDR1 intracellular localization by laser scanning confocal microscopy
For MDR1 immunofluorescence assay, cells were grown on slides in a 6-well plate. Two days later, MitoTracker Red in DMEM (200 nmol/L) was added followed by incubation for 30 min at 37°C, and then cells were washed twice with ice-cold PBS (0.01 mol/L, pH 7.2). The cells were fixed in ice-cold 4% paraformaldehyde for 30 min followed by permeabilization with 0.3 mg/mL Triton X-100 for 30 min at room temperature. These cells were washed twice with 0.01 mol/L PBS and incubated in blocking buffer containing goat serum for 30 min at room temperature. Cells were washed twice with 0.01 mol/L PBS and the expression of MDR1 was determined using the mouse monoclonal anti-P-gp antibody (1:100). The primary antibodies were replaced with IgG isotype control serving negative control. The incubations with primary antibody were carried out in blocking buffer overnight at 4ºC. After incubation with primary antibodies, cells were washed 3 times with 0.01 mol/L PBS, and incubated with FITC-conjugated goat anti-mouse antibody (1:50) in dark for 1.5 h at 37ºC. Cell nuclei were counterstained with DAPI (4,6-diamidino-2-phenylindole; Sigma-Aldrich, St. Louis, MO, USA) solution (1 μg/mL in PBS) for 5 min at room temperature. After washing with 0.01 mol/L PBS, cells were mounted on slides using Antifade Mounting Medium (Beyotime Institute of Biotechnology, Jiangshu, China). Confocal laser scanning microscopic analysis was performed with a Leica TCS SP2 confocal laser imaging system (Leica Microsystems, Wetzlar, Germany). To ascertain the localization of mitochondria, cells were stained with MitoTracker Red CMXRos dye. A merged image of green MDR1 and MitoTracker Red was obtained. To allow quantitative analysis of the relative fluorescence intensity of cells between groups, cells were selected randomly and scanned at more than 3 points. Software Image-Pro Plus Version 6.0 (MediaCybernetics, Bethesda, MD, USA) was used to calculate the mean fluorescence intensity. Average green fluorescence intensity per cell was expressed as the P-gp protein expression.
Functional assay of mitochondrial P-gp
Mitochondrial fraction was prepared as described below. Briefly, cells were washed twice with ice-cold PBS, and the pellet was suspended in 500 μl of ice-cold buffer A (20 mM HEPES, pH 7.5, 1.5 mM MgCl2, 10 mM KCl, 1 mM EDTA, 1 mM EGTA, 1 mM dithiothreitol, 0.1 mM phenylmethylsulfonyl fluoride, and 10 μg/ml each leupeptin, aprotinin, and pepstatin A) containing 250 mM sucrose. To lyse the cells, cell suspension was passed five times through a 26-gauge needle fitted to a syringe. Unbroken cells, large plasma membrane pieces and nuclei were removed by centrifugation at 1000×g at 4°C for 10 min. The resulting supernatant was subjected to centrifugation at 4°C for 20 min at 10,000 × g. The pellet fraction (i.e. mitochondria) was first washed with the above buffer A containing sucrose and then solubilized in 50 μl of TNC buffer (10 mM Tris-acetate, pH 8.0, 0.5% Igepal CA-630, 5 mM CaCl2). The supernatant was re-centrifuged at 100,000 × g (4°C, 1 h) to generate cytosol.
Mitochondria were suspended in buffer A and kept on ice until the experiment was performed [9]. All imaging experiments were performed at room temperature in buffer A. The whole isolated mitochondria from cultured cells were divided in test tubes to evaluate mitochondrial autofluorescence as well as the uptake and the efflux of Rho 123 into and out of organelles. Rho 123 (5 μg/ml) was added to the samples followed by incubation for 4 min at room temperature in dark. After incubation, fluorescence of Rho 123 in mitochondria was measured with a COULTER® EPICS™ XL™ flow cytometer (Beckman Coulter Inc., Brea, CA, USA). To estimate the Rho 123 efflux, mitochondria exposed to Rho 123 were re-suspended in 2 ml of buffer A and centrifuged for 5 min at 450×g at 4°C, afterwards they were washed once with 2 ml of buffer A, before diluting them in 500 μl of buffer A. Samples were incubated for another 6 min at room temperature to allow Rho 123 efflux from mitochondria. Then, the fluorescence of Rho 123 was determined in each sample with the COULTER® EPICS™ XL™ flow cytometer and measured at a flow rate of 2000 events/s. Experiments were performed at least three times.
Statistical analysis
Data were expressed as mean ± SD. Statistical analysis was done with SPSS version 13.0 statistic software package. Statistical significance between two groups was determined by paired or unpaired Student's t-test. Comparisons between multiple groups were performed by one-way analysis of variance. A value of P<0.05 was considered statistically significant.
Results
Toxicity of CDDP to human HCC cells
CDDP-resistant SK-Hep1 (SK-Hep1/CDDP) cells were established by pulse exposure of SK-Hep-1 cells to high concentrations of CDDP. As shown in Table 1, the IC50 of CDDP in SK-Hep1 cells and SK-Hep1/CDDP cells were 5.13 ± 0.09 μg/mL and 70.61 ± 1.06 μg/mL, respectively. SK-Hep1/CDDP cells were 13.76-fold more resistant to CDDP than the parent cells. The cross-resistance of SK-Hep1 cells and SK-Hep1/CDDP cells to other anticancer drugs (DOX, VCR and 5-FU) was also determined, and results showed SK-Hep-1/CDDP cells also had cross-resistance to DOX, VCR and 5-FU.
IC50 and RI of SK-Hep1 cells and SK-Hep1/CDDP Cells (n=3)
| Drug (µg/mL) | IC50 (mean ± SD) | Resistance index (RI) | |
|---|---|---|---|
| SK-Hep1 | SK-Hep1/CDDP | ||
| CDDP | 5.13±0.09 | 70.61±1.06* | 13.76 |
| DOX | 0.74±0.04 | 4.13±0.23* | 5.58 |
| VCR | 0.76±0.02 | 2.28±1.06* | 3.12 |
| 5-FU | 12.49±0.27 | 52.79±3.85* | 4.23 |
* P<0.01 vs parental cells. SK-Hep1 cells and SK-Hep1/CDDP cells were exposed to designed concentrations of CDDP, DOX, VCR and 5-FU for 24 h and CCK-8 assay was performed. The IC50 were calculated. Data of 3 independent experiments are averaged and then expressed as means ± SD. RI = (IC50 SK-Hep1/CDDP cells)/(IC50 SK-Hep1 cells).
SD: standard deviation; IC50: half maximal inhibitory concentration.
CCK-8 assay also showed both IC50 and RI of SK-Hep1 and SK-Hep1/CDDP cells were decreased after treatment with mPTP agonist ATR, but increased after incubation with mPTP inhibitor CsA, which increased the resistance to CDDP (Table 2).
Toxicity of CDDP to HCC cells (n=3)
| groups | IC50 (μg /ml) | RI |
|---|---|---|
| SK-Hep1 | 5.13±0.09 | |
| SK-Hep1+CsA | 6.25±0.03a | 1.22 |
| SK-Hep1+ATR | 2.53±0.08a | 0.49 |
| SK-Hep1/CDDP | 70.61±1.06 | 13.76 |
| SK-Hep1/CDDP+CsA | 84.22±1.03b | 16.42 |
| SK-Hep1/CDDP+ATR | 30.27±0.67b | 5.9 |
a P<0. 05, vs SK-Hep1 cells. bP<0.05, vs SK-Hep1/CDDP cells.
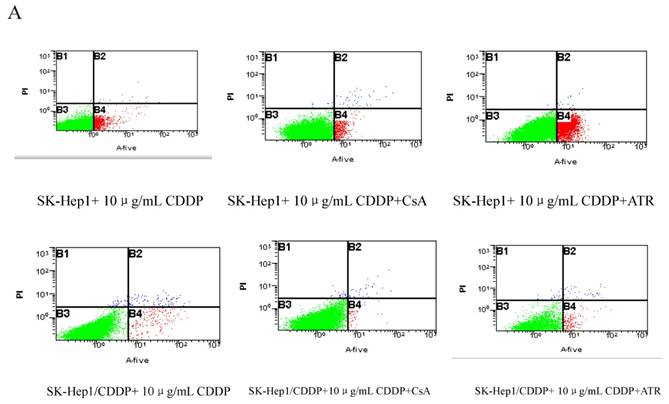
Detection of apoptotic rate by Annexin V/PI double staining
After treatment with 10 μg/mL CDDP for 24 h, the apoptotic rate of SK-Hep1 cells (6.95±0.29%) was significantly higher than that of SK-Hep1/CDDP cells (2.17±0.11%, P<0.01). If CDDP treated cells were incubated with additional 1 μM of CsA for 24 h, the apoptotic rates of SK-Hep1 cells and SK-Hep1/CDDP cells were significantly decreased (5.11±0.18% and 0.86±0.14%, respectively) when compared with those with CDDP treatment alone (P<0.05). These results suggest that inhibition of mPTP opening can reduce the sensitivity of cancer cells to CDDP-induced apoptosis. On the contrary, treatment with mPTP agonist (20 μM ATR) increases the apoptotic rates of both types of cells (24.61±1.03% and 6.18±1.13%, respectively), which are also significantly higher than those with CDDP treatment alone. These findings indicate that promoting the mPTP opening can relatively enhance the cellular sensitivity to CDDP-induced apoptosis and increase the apoptosis of drug-resistant cells after CDDP treatment (Fig. 1).
Apoptosis detected by Annexin VFITC/PI staining. ※P < 0.05 vs SK-Hep1 cells in 10 µg/mL CDDP.※※P < 0.05 vs SK-Hep1/CDDP cells in 10 µg/mL CDDP.
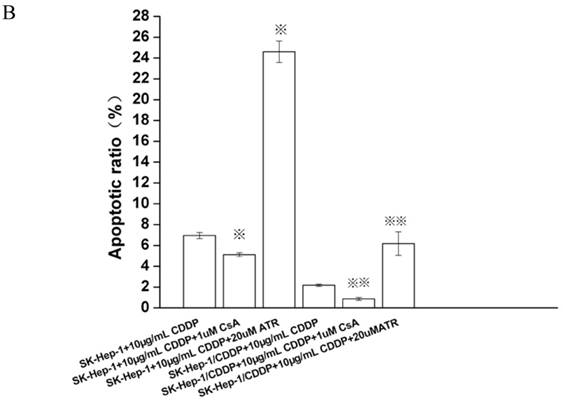
Protein expression of MDR1 and Bax
The relative expressions of MDR1 and Bax were shown in Fig. 2. The MDR1 expression was significantly increased in SK-Hep1/CDDP cells when compared with SK-Hep1 cells (P<0.01), but there were no significant differences in the MDR1 expression after addition of mPTP agonist or inhibitor. The Bax expression was markedly decreased in SK-Hep1/CDDP cells when compared with SK-Hep1 cells (P<0.01). After addition of CsA, Bax expressions in both SK-Hep1 cells and SK-Hep1/CDDP cells were reduced to 1.47±0.03 and 0.39±0.03, respectively, which were significantly lower than those of untreated cells (P<0.01 and P<0.05, respectively); while the Bax expressions in SK-Hep1 cells and SK-Hep1/CDDP cells were increased to 4.12±0.03 and 0.91±0.03, respectively, which were significantly higher than those of untreated cells (P<0.01), after ATR treatment (Table 3).
Effects of ATR and CsA on MDR1 and Bax expressions in SK-Hep1/CDDP cells and SK-Hep1 cells. Cells of different groups were maintained in humidified air with 5% CO2, and harvested to determine the expressions of MDR1 (A) and Bax (B) by western blot. (1. SK-Hep1; 2. SK-Hep1/CDDP; 3. SK-Hep1 +CsA; 4. SK-Hep1/CDDP+CsA; 5. SK-Hep1 +ATR; 6. SK-Hep1/CDDP+ATR.)
Expressions of MDR1and Bax (n=3)
| groups | MDR1 | Bax |
|---|---|---|
| SK-Hep1 | 0.58±0.02 | 3.53±0.12 |
| SK-Hep1+CsA | 0.56±0.01a | 1.47±0.03c |
| SK-Hep1+ATR | 0.54±0.01a | 4.12±0.03c |
| SK-Hep1/CDDP | 1.36±0.04c | 0.59±0.02c |
| SK-Hep1/CDDP+CsA | 1.33±0.02b | 0.39±0.03d |
| SK-Hep1/CDDP+ATR | 1.35±0.03b | 0.91±0.03d |
Data were expressed as means ± SD (n = 3 per group).
a: vs SK-Hep1 cells, P>0.05; b: vs SK-Hep1/CDDP cells, P>0.05; c: vs SK-Hep1, P<0.01; d: vs SK-Hep1/CDDP, P<0. 05.
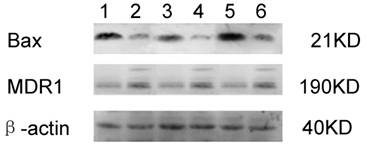
Detection of ΔΨm by flow cytometry
The ΔΨm of both SK-Hep1 cells and SK-Hep1/CDDP cells was decrease significantly (P<0.05) after 24 h of treatment with 10 μg/mL CDDP (Fig. 3). The simultaneous addition of 1 μM mPTP inhibitor CsA militates the reduction of ΔΨm; while the addition of mPTP opener ATR exacerbates the reduction of ΔΨm. Both differences are statistically significant (P<0.05).
Influence of ΔΨm by mPTP intervention. The ΔΨm was expressed as a ratio of JC-1 aggregated to monomer fluorescence after different treatments (n=10 images). *P<0.05 vs SK-Hep1 cells, **P< 0.05, vs SK-Hep1/CDDP cells.
Evaluation of MDR1 distribution by laser scanning confocal microscopy
Intracellular distribution of MDR1 was determined by immunofluorescence. Confocal microscopic analysis confirmed that the expression of MDR1 was elevated in SK-Hep1/CDDP cells and SK-Hep1 cells (Fig. 4A). MDR1 was localized around the nuclear membranes. To further assess the localization of MDR1, a double stain with MitoTracker Red and DAPI was performed. The green fluorescence was ubiquitous. Fig. 4A showed the relative levels of MDR1/P-gp (green fluorescence) in SK-Hep1/CDDP cells (above) and parental SK-Hep1 cells (below) determined by confocal microscopy.
Confocal laser scanning microscopy for MDR1/P-gp intracellular distribution in resistant SK-Hep1/CDDP cells and parent SK-Hep1 cells.
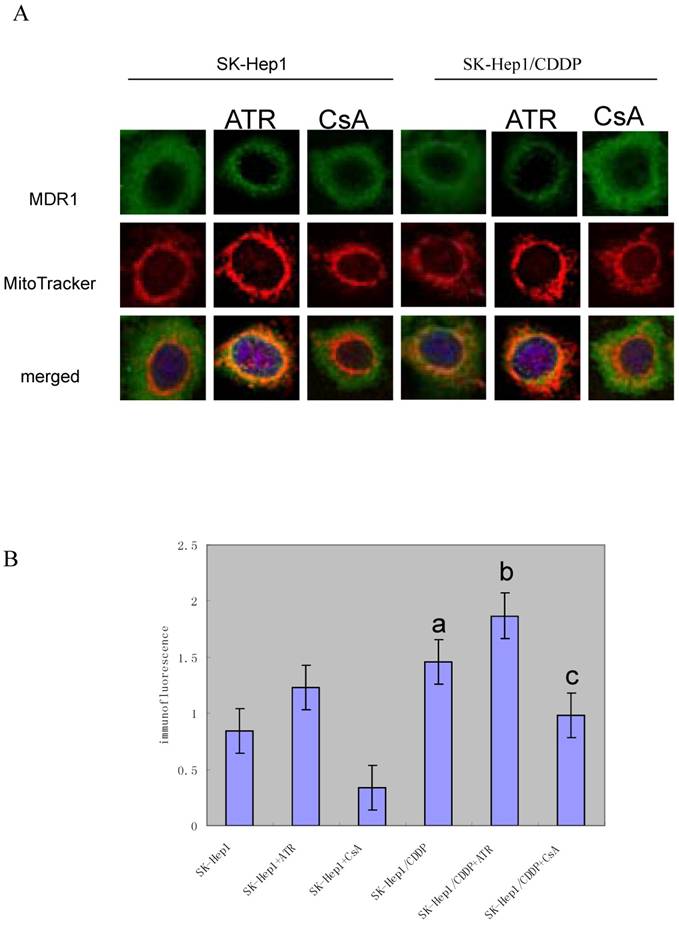
The results of quantitative assessment are shown in Fig. 4B. CDDP-resistant cells had pronounced higher levels of green fluorescence and higher mean optical density when compared with SK-Hep1 cells (P< 0.05). Meanwhile, after treatment with ATR or CsA, MDR1/P-gp fluorescence was increased or reduced, respectively.
SK-Hep1/CDDP cells and SK-Hep1 cells were simultaneously incubated with 200 nm of MitoTracker Red for 15 min and subsequently fixed and immunostained with anti-P-glycoprotein antibody. Then, cells were stained with FITC-conjugated secondary antibody (green) and DAPI (blue) and subjected to confocal microscopy. Representative images are shown. Scale: 10 μm. The co-localization of MitoTracker and P-gp was demonstrated by the yellow fluorescence. These figures are representative from three separate experiments. CDDP-resistant cells demonstrated pronounced higher levels of green fluorescence and higher mean optical density when compared with SK-Hep1 cells (P<0.05). After treatment with ATR or CsA, MDR1/P-gp fluorescence was significantly increased or reduced, respectively (P<0.05.a,vs SK-Hep1;b,vs SK-Hep1+ATR;c,vs SK-Hep1+CsA.).
Evaluation of P-gp-mediated accumulation and efflux of Rho 123 in cells
Is the P-gp in mitochondria of the cultured cells functionally active? As shown in Table 4, Rho 123 accumulated in mitochondria of SK-Hep1 cells in a greater amount than in SK-Hep1/CDDP cells and, once Rho 123 was removed from the incubation mixture, fluorescence intensity was more rapidly decreased in the mitochondria of SK-Hep1/CDDP cells when compared with the mitochondria of SK-Hep1 cells.
Accumulation and efflux of Rho 123 in SK-Hep1 and SK-Hep1/CDDP cells by flow cytometry (n=5).
| Cells | Rho123 accumulation | Rho123 efflux |
|---|---|---|
| SK-Hep1 | 42.0 ± 1.3 | 29.8± 3.5 |
| SK-Hep1/CDDP | 24.1 ± 2.7* | 17.4± 1.9* |
*P<0.05, vs parental cells. Data were analyzed by two-way analysis of variance, and a value of P<0.05 was considered significant.
Discussion
A CDDP resistant SK-Hep1 HCC cell line was established in the present study. The resistant cells showed an increase of 13.76 folds in the resistance to CDDP as compared to parent SK-Hep1 cells. The resistant cells also highly expressed MDR1 and had decreased expression of apoptotic protein Bax.
MDR1 expression has been considered to be associated with the resistance to adriamycin and vincristine, but not to cisplatin[10,11]. However, the MDR1 was over-expressed in myelogenous leukemia cells[12] and HCC cell lines [13] after CDDP treatment. Recent studies showed that HCC expressed MRP1, MDR1, MRP3 and breast cancer resistance protein (BCRP/ABCG2), and these proteins render cancer cells to be a MDR phenotype [14,15]. In the present study, MDR1 was significantly up-regulated in CDDP -resistant SK-Hep1 cells, suggesting that MDR1 is also involved in the resistance of cancer cells to CDDP.
The regulatory effects of ATR and CsA on the CDDP-induced cytotoxicity were examined in the resistant cells. The apoptotic rate was also decreased in SK-Hep 1/CDDP cells, and their ability to counteract the chemotherapy induced apoptosis was subsequently elevated. After incubation with mPTP agonist (ATR), the IC50, RI, and cell survival rate of both SK-Hep1 cells and SK-Hep1/CDDP cells against CDDP were decreased. This may be as a result of increased apoptosis and reduced cellular ΔΨm. The protein expression of MDR1 was not affected, but the Bax expression was increased. After treatment with mPTP inhibitor (CsA), the IC50, RI, and cell survival rate of SK-Hep1 cells and SK-Hep1/CDDP cells against CDDP were increased, and the apoptotic rate decreased (compared to SK-Hep1 cells). Protein expression of MDR1 was not affected, but the Bax expression was reduced.
MDR is a critical problem in the chemotherapy of cancer. Use of MDR reversal agents in combination with anti-cancer drugs is an important strategy in the chemotherapy aiming to counteract the MDR of cancer. The mechanism underlying the MDR of cancer cells is complicated, and studies suggest that MDR is mainly related to two types of classical membrane transporter proteins in the cancer cells [16]. One belongs to the ATP-binding cassette (ABC) transporter superfamily including P-gp/ABCB1, MRP1/ABCC1, and BCRP/ABCG2, which have the energy-dependent pump function and can export a variety of intracellular substrates including the anticancer drugs across the cancer cell membrane [17]. The other belongs to solute carrier transporter superfamily, which controls the intracellular absorption of anticancer drugs. Over-expression of these two types of transporter proteins mediates the drug-resistance of cancer cells. Kojima et al. have reported that over-expression of MDR1 (P-gp, ABCB1) in cancer cells can inhibit the release of mitochondrial cytochrome c into cytoplasm and subsequently inhibit the caspase-dependent apoptosis [18,19]. Similarly, the over-expression of BCRP/ABCG2, a member of ATP-binding cassette transporter protein family, can also enhance the ability of cells to combat with apoptosis [20]. Recently, mitochondria have become one of important targets in screening novel anticancer drugs. Regulation of mitochondrial function can not only protect the normal cells from the initiation of apoptosis, but also induce the release of apoptotic proteins, leading to apoptosis of cancer cells [21]. As a multiprotein complex locating between the inner and outer membranes of mitochondria, mPTP plays a critical role in the apoptosis mediated by the mitochondrial membrane permeability [22,23]. The escape from and antagonism of apoptosis are key factors, leading to resistance of cancer cells to chemotherapeutic drugs. Our results indicated the promotion of mPTP opening could reduce the drug-resistance and increase the apoptosis of cancer cells. However, the regulation of mPTP did not affect the MDR1 activity but could regulate the protein expression of Bax, which further affects the sensitivity of drug-resistant cells to chemotherapeutic agents. Therefore, our study suggests that modulation of mPTP function can affect the apoptosis of SK-Hep1/CDDP cells.
Since P-gp is expressed in Golgi and nuclear membrane [24,25], it may be expressed in mitochondria where it interferes with the molecular mechanisms of apoptosis [26]. Our results indicated P-gp mitochondrial localization in SK-Hep1/CDDP cells was increased when compared with the parental cells, and the P-gp translocation into mitochondria was also changed with the treatment by ATR or CsA. Mitochondrial expression of P-gp can protect the mitochondrial DNA from anticancer drugs induced damage[9,27]. Moreover, it is involved in the mechanism by which MDR cells block the release of cytochrome c from mitochondrial into cytoplasm[18].
Is the mitochondrial P-gp in MDR cells functionally active? To investigate the mitochondrial P-gp function, accumulation and efflux of Rho 123, a mitochondrion fluorescent probe with strong analogy with anticancer drugs, were evaluated in isolated mitochondria of parental cells and CDDP-resistant cell lines. Results of these experiments completely agree with those obtained in whole cells. Rho 123 accumulation was significantly reduced in isolated mitochondria of MDR cells as compared to those from their parental cells. Reduced fluorescence of mitochondria of MDR cells was probably due to P-gp-mediated Rho 123 efflux.
One question is how P-gp interferes with the apoptosis. It was shown that P-gp over-expressing cells did not release cytochrome c from mitochondria once exposed to an apoptotic signal. Does P-gp play a role in this process? It has been shown that caspase-3, a key actor in apoptosis, cleaves P-gp [28]. We speculate that the cleavage of P-gp by caspase-3 has a feed-back role in the suppression of apoptosis. However, we cannot exclude the possibility that the loop P-gp caspase-3-induced cleavage plays an enhancing role in the elimination of P-gp expressing cells.
In conclusion, the present study demonstrated that the promotion of mPTP opening increased the expression of apoptotic protein Bax leading to apoptosis of drug-resistant cells. P-gp was translocated to mitochondria, and functionally activated and functioned like a pump to extrude the anticancer drugs from mitochondria. Our study provides a new strategy for anti-cancer therapy and for reversal of MDR in cancer cells.
Acknowledgements
This work was supported by National Natural Science Foundation of China (30470865) and Xinqiao Hospital Grant (1520).
Conflict of Interests
The authors have declared that no conflict of interest exists.
References
1. Thun MJ, DeLancey JO, Center MM. et al. The global burden of cancer: priorities for prevention. Carcinogenesis. 2010;31:100-10
2. El-Serag HB, Rudolph KL. Hepatocellular carcinoma: epidemiology and molecular carcinogenesis. Gastroenterology. 2007;132:2557-76
3. Okuda K. Hepatocellular carcinoma. J Hepatol. 2000;32:225-37
4. Wakamatsu T, Nakahashi Y, Hachimine D. et al. The combination of glycyrrhizin and lamivudine can reverse the cisplatin resistance in hepatocellular carcinoma cells through inhibition of multidrug resistance-associated proteins. Int J Oncol. 2007;31:1465-72
5. Folmer Y, Schneider M, Blum HE. et al. Reversal of drug resistance of hepatocellular carcinoma cells by adenoviral delivery of anti-ABCC2 antisense constructs. Cancer Gene Ther. 2007;14:875-84
6. Pérez-Tomás R. Multidrug resistance: retrospect and prospects in anti-cancer drug treatment. Curr Med Chem. 2006;13:1859-76
7. Galluzzi L, Larochette N, Zamzami N. et al. Mitochondria as therapeutic targets for cancer chemotherapy. Oncogene. 2006;25:4812-30
8. Zhou Y, Ling XL, Li SW. et al. Establishment of a human hepatoma multidrug resistant cell line in vitro. World J Gastroenterol. 2010;16(18):2291-7
9. Solazzo M, Fantappiè O, Lasagna N. et al. P-gp localization in mitochondria and its functional characterization in multiple drug-resistant cell lines. Experimental Cell Research. 2006;312:4070-8
10. Scala S, Pacelli R, Iaffaioli RV. et al. Reversal of adriamycin resistance by recombinant alpha-interferon in multidrug-resistant human colon carcinoma LoVo- doxorubicin cells. Cancer Res. 1991;51:4898-902
11. Kang Y, Perry RR. Modulatory effects of tamoxifen and recombinant human alpha-interferon on doxorubicin resistance. Cancer Res. 1993;53:3040-5
12. Chaudhary PM, Roninson IB. Induction of multidrug resistance in human cells by transient exposure to different chemotherapeutic drugs. J Natl Cancer Inst. 1993;85:632-9
13. Takeuchi A, Kaneko S, Matsushita E. et al. Interferon-alpha modulates resistance to cisplatin in three human hepatoma cell lines. J Gastroenterol. 1999;34:351-8
14. Kim H, Park C, Han KH. et al. Primary liver carcinoma of intermediate (hepatocyte-cholangiocyte) phenotype. J Hepatol. 2004;40:298-304
15. Lee JS, Heo J, Libbrecht L. et al. A novel prognostic subtype of human hepatocellular carcinoma derived from hepatic progenitor cells. Nat Med. 2006;12:410-6
16. Liu FS. Mechanisms of chemotherapeutic drug resistance in cancer therapy - a quick review. Taiwan J Obstet Gynecol. 2009;48:239-44
17. Daood M, Tsai C, Ahdab-Barmada M. et al. ABC transporter (P-gp/ABCB1, MRP1/ABCC1, BCRP/ABCG2) expression in the developing human CNS. Neuropediatrics. 2008;39:211-8
18. Kojima H, Endo K, Moriyama H. et al. Abrogation of mitochondrial cytochrome c release and caspase-3 activation in acquired multidrug resistance. J Biol Chem. 1998;273:16647-50
19. Mantovani I, Cappellini A, Tazzari PL. et al. Caspase-dependent cleavage of 170-kDa P-glycoprotein during apoptosis of human T-lymphoblastoid CEM cells. J Cell Physiol. 2006;207:836-44
20. Evseenko DA, Murthi P, Paxton JW. et al. The ABC transporter BCRP/ABCG2 is a placental survival factor, and its expression is reduced in idiopathic human fetal growth restriction. FASEB J. 2007;21:3592-605
21. Jana S, Paliwal J. Apoptosis: potential therapeutic targets for new drug discovery. Curr Med Chem. 2007;14:2369-79
22. Javadov S, Karmazyn M. Mitochondrial permeability transition pore opening as an endpoint to initiate cell death and as a putative target for cardioprotection. Cell Physiol Biochem. 2007;20:1-22
23. Grimm S, Brdiczka D. The permeability transition pore in cell death. Apoptosis. 2007;12:841-55
24. Maraldi NM, Zini N, Santi S. et al. P-glycoprotein subcellular localization and cell morphotype in MDR1 gene-transfected human osteosarcoma cells. Biol. Cell. 1999;91:17-28
25. Molinari A, Cianfriglia M, Meschini S. et al. P-glycoprotein expression in the Golgi apparatus of multidrug-resistant cells. Int. J. Cancer. 1994;59:789-95
26. Croop JM, Guild BC, Gros P. et al. Genetics of multidrug resistance: relationship of a cloned gene to the complete multidrug resistant phenotype. Cancer Res. 1987;47:5982-8
27. Munteanu E, Verdier M, Forestier FG. et al. Mitochondrial localization and activity of P-glycoprotein in doxorubicin-resistant K562 cells. Biochem. Pharmaco. 2006;71:1162-74
28. Mantovani I, Cappellini A, Tazzari PL. et al. Caspase-dependent cleavage of 170-kDa P-glycoprotein during apoptosis of human T-lymphoblastoid CEM cells. J. Cell. Physiol. 2006;207:836-44
Author contact
![]() Corresponding author: Xianlong Ling, lingxianlongnet
Corresponding author: Xianlong Ling, lingxianlongnet