10
Impact Factor
ISSN: 1449-2288
Int J Biol Sci 2010; 6(7):784-795. doi:10.7150/ijbs.6.784 This issue Cite
Research Paper
S-Adenosylmethionine Inhibits the Growth of Cancer Cells by Reversing the Hypomethylation Status of c-myc and H-ras in Human Gastric Cancer and Colon Cancer
1. Department of biochemistry, Tianjin Medical University, Tianjin, 300070 China
2. Tianjin Stomatological Hospital, Tianjin, China
3. Department of Neurology, General Hospital, Tianjin Medical University, Tianjin, 300052 China
* These authors contribute equally to this work.
Received 2010-11-8; Accepted 2010-12-3; Published 2010-12-6
Abstract
A global DNA hypomethylation might activate oncogene transcription, thus promoting carcinogenesis and tumor development. S-Adenosylmethionine (SAM) serves as a major methyl donor in biological transmethylation events. The object of this study is to explore the influence of SAM on the status of methylation at the promoter of the oncogenes c-myc, H-ras and tumor-suppressor gene p16 (INK4a), as well as its inhibitory effect on cancer cells. The results indicated that SAM treatment inhibited cell growth in gastric cancer cells and colon cancer cells, and the inhibition efficiency was significantly higher than that in the normal cells. Under standard growth conditions, C-myc and H-ras promoters were hypomethylated in gastric cancer cells and colon cancer cells. SAM treatment resulted in a heavy methylation of these promoters, which consequently downregulated mRNA and protein levels. In contrast, there was no significant difference in mRNA and protein levels of p16 (INK4a) with and without SAM treatment. SAM can effectively inhibit the tumor cells growth by reversing the DNA hypomethylation on promoters of oncogenes, thus down-regulating their expression. With no influence on the expression of the tumor suppressor genes, such as P16, SAM could be used as a potential drug for cancer therapy.
Keywords: S-Adenosylmethionine, epigenetics, hypomethylation, gastric cancer, cancer therapy
Introduction
The epigenome, which controls the differential expression of genes in specific cells, is composed of DNA methylation (covalent) and modifications that occur on DNA-associated components, such as histones (noncovalent). Tumorigenesis and metastasis is relevant to genetic and epigenetic changes. One of the hallmarks of cancer is a massive aberration of DNA methylation. While global DNA is hypomethylated, some key regions such as tumor suppressor genes are hypermethylated. Understanding the mechanisms underlying these epigenetic changes would provide important information for cancer diagnosis and therapy.
Epigenetics is the study of changes in gene expression and other phenotypes caused by DNA methylation and histone modification, rather than changes in DNA sequence. DNA methylation plays a critical role in regulating and reprogramming gene expression patterns in mammalian cells [1-3]. It is known that changes in methylation patterns are correlated to the development and progression of tumors [4-6]. Accumulated evidence demonstrates that DNA hypermethylation in promoter regions silences gene transcription, which is proposed as an important mechanism for inactivating tumor suppression genes during tumorigenesis. Recently, efforts have been made to reverse the hypermethylation status of tumor-suppressor genes by using DNA demethylation agents [7-9]. However, hypomethylation also plays an important role in carcinogenesis and tumor development. It has been found that DNA hypomethylation causes genomic instability and increases the frequency of transposon insertion mutation [10, 11]. Furthermore, a global DNA hypomethylation might activate oncogene transcription, thus promoting carcinogenesis and tumor development. Moreover, emerging data suggest that hypomethylation is also involved in cancer metastasis and invasion by activating particular genes [12, 13].
S-Adenosylmethionine (SAM or Ado Met) plays a pivotal role as a methyl donor in methyation reactions. SAM is formed from methionine and ATP by methionine adensyltransferase (MAT). It has been reported to serve as a therapeutic reagent for cancer treatments [14, 15]. In this study, we explored how DNA methylation of promoter regions affects gene expression in cancer and normal cells. We found that in human gastric cancer cells (MGC-803) and colon cancer cells (HT-29), the oncogenes C-myc and H-ras were hypomethylated and SAM treatment increased their methylation levels, thus suppressing gene expressions. In contrast, the tumor suppressor gene P16 was already hypermethylated so SAM treatment had no effect on its expression. Additionally, while SAM was able to slow down tumor cell growth by down-regulating c-myc and H-ras expression, normal cells were not affected by SAM and had unchanged expression of c-myc, H-ras and P16. Thus, we propose that SAM could be used for cancer therapy via specifically suppressing tumor, but not normal, cell growth.
Materials and Methods
Cell culture and treatment with SAM
The human gastric cancer cell line (MGC-803), colon cancer cell line (HT-29) and normal liver cell line (Chang liver cell line) were obtained from Institute of Tianjin Huanhu Hospital, China. These cells were cultured in RPMI 1640 medium supplemented with 10% fetal bovine serum, containing 100 IU/mL penicillin and 100 µg/mL streptomycin in a humidified incubator with 5% CO2 and 95% air at 37 ºC. After 24h of culturing, an adequate number of cells were randomly selected from these two cell lines and treated with 10μmol/L SAM (Promega, USA). Untreated cells (no drug in medium) were used as a control.
MTT Assay and colony formation assay
Cells in logarithmic growth were seeded at a density of 5×10³ cells/well in 96-well plates in 200µl volume media. 10 µl of MTT solution (5 mg/mL in PBS) was added into each well and cells were incubated at 37 ºC for 4 h allowing the MTT to be metabolized. The supernatant was removed and 100 µl of DMSO was added into each well to dissolve formazan crystals. The absorbance of the solutions with dye was measured at 492nm on a multi-well spectrophotometer (Bio-Tek). The inhibition effect of the different groups of cells was calculated with the following the formula: Inhibition effect (%) = (1- Absorbance value of SAM treated group / Absorbance value of control group) × 100%. Trypsinized cells were seeded for colony formation assay in 100-mm dishes. After 16 days colonies were fixed and stained with a mixture of 6.0% glutaraldehyde and 0.5% crystal violet.
Methylation specific PCR assay (MSP) for DNA methylation in the promoter regions of c-myc, H-ras and p16 (INK4a)
Isolated genomic DNA was bisulfate-treated with a DNA Modification kit (TaKaRa Co.) following the protocol provided by the manufacturer. Treated DNA was purified using a Wizard DNA clean-up system (Promega), DNA was ethanol precipitated and diluted in 30 µl of double-distilled water. Methylation specific PCR (MSP) was carried out at 95 ºC for 5 minutes, followed by 95 ºC for 30 seconds, 58 ºC for 30 seconds and 72 ºC for 40 seconds. After 30 cycles, an additional incubation at 72 ºC for 10 minutes was used to finish extension. Primers used for amplifying the promoter regions of c-myc, H-ras and p16 (INK4a) (with or without methylation) are listed in Table 1.
RNA extraction and Real-time Quantitative Reverse Transcription-Polymerase Chain Reaction (RT-PCR)
Total RNA was extracted from the cells in different groups using TRIzolTM (Invitrogen Life Technologies). The purified RNA was quantified by measuring the absorbance at 260nm and the quality of RNA was tested by 1% agarose gel electrophoresis. 1μg of total RNA was reverse transcribed to cDNA in a 25 μl reaction using oligodT (Promega) and M-MLV reverse transcriptase (Promega) provided in the Reverse Transcription kit (Promega).
Q-PCR was performed using a Light Cycler system (Roche). Each sample was tested in triplicate and GAPDH was used as an internal control. Primers for c-myc, H-ras, p16 and GAPDH are listed in Table 2. The real-time PCR data were analyzed using the 2-△△CT relative quantization method following the manufacturer's instructions. The 25 μl reaction mixture contained 1 μl of complementary DNA, 12.5 μl of 2×SYBR Green PCR Master Mix, and final concentration 0.4 μM of each primer. Thermocycler conditions consisted of an initial activation step at 95 ºC for 10 minutes, followed by 95 ºC for 30 seconds, 60 ºC for 20 seconds and 70 ºC 34 seconds for 40 cycles. A dissociation curve was obtained for each quantitative PCR run.
The primer sequences for Methylation Specific PCR assay (MSP)
| Genes | Primers | Sequences |
|---|---|---|
| c-myc | methylated forward | 5'-TTT TTT TCG TTA ATT TTC GTT TAT C-3' |
| methylated reverse | 5'-CTA AAA AAC CCT ACC CTT CTC G-3' | |
| unmethylated forward | 5'-TTT TTT GTT AAT TTT TGT TTA TTG G-3' | |
| unmethylated reverse | 5'-CTC TAA AAA ACC CTA CCC TTC TCA-3' | |
| H-ras | methylated forward | 5'-TTT TTG GTT TTT TTC GAG TAA TTT C-3' |
| methylated reverse | 5'-CGC GAC CTA CCA TTA ACT ACG-3' | |
| unmethylated forward | 5'-TTT GGT TTT TTT TGA GTA ATT TTG A-3' | |
| unmethylated reverse | 5'-CAA ACA CAA CCT ACC ATT AAC TAC AC-3' | |
| p16(INK4a) | methylated forward | 5'-TTA TTA GAG GGT GGG GCG GAT CGC-3' |
| methylated reverse | 5'-GAC CCC GAA CCG CGA CCG TAA-3' | |
| unmethylated forward | 5'-TTA TTA GAG GGT GGG GTG GAT TGT-3' | |
| unmethylated reverse | 5'-CAA CCC CAA ACC ACA ACC ATA A-3' |
The primer sequences for Real-time Quantitative PCR
| c-myc | forward | 5'-CAA GAG GCG AAC ACA CAA CGT CT-3' |
| reverse | 5'-AAC TGT TCT CGT CGT TTC CGC AA-3' | |
| H-ras | forward | 5'-TGA GGA GCG ATG ACG GAA TA-3' |
| reverse | 5'-GTA TCC AGG ATG TCC AAC AG-3' | |
| p16(INK4a) | forward | 5'-CCCCCACTACCGTAAATGTCCAT-3' |
| reverse | 5'-CTGCCATTTGCTAGCAGTGTGACT-3' | |
| GAPDH | forward | 5'-GGT GAA GGT CGG AGT CAA CGG A-3' |
| reverse | 5'-GAG GGA TCT CGC TCC TGG AAG A-3' |
Western blot analysis for protein expression
Cells were lysed in a buffer containing 150 mM NaCl, 50 mM Tris-HCl, pH 8.0, 0.1% SDS, 1% Triton X-100, 1 mM orthovanadate, 1 mM phenylmethylsulfonyl fluoride, 10 ng/mL leupeptin, and 10 ng/mL aprotinin. Protein concentrations of the lysates were quantified with an absorbance meter (655-nm wavelength; Bio-Rad). Each 40-µg sample was separated on a 10% SDS-PAGE (Bio-Rad Laboratories, Inc) and transferred onto polyviny lidene fluoride (PVDF) membranes that had been pretreated with methanol. The membranes were blocked with 5% skim milk or 1% bovine serum albumin (BSA) in Tris-buffered saline (TBS) buffer (10 mM Tris, 150 mM NaCl, pH 7.9) containing 0.05% Tween 20. Blots were probed for 2 hours at room temperature with primary antibodies of C-MYC, H-RAS, P16 (Santa Cruz Biotechnology). Horseradish peroxidase (HRP)-conjugated secondary antibodies and an enhanced chemiluminescence (ECL) kit were used for detection. Reactive protein expression was visualized using a CCD camera (Syngene G-Box; Syngene), and quantification of band densities was obtained using the Syngene GeneTool software. Each value was obtained from comparison with the level of mouse monoclonal anti-beta-actin.
Immunofluorescence assay for C-MYC, H-RAS and P16 (INK4A) protein expressions
Cells were digested with 0.25% trypsin, and subcultured in 24-well plates. Three wells were randomly selected from each group and marked as C-MYC, H-RAS and P16 (INK4A) respectively. Cells were fixed with 100% alcohol for 30 min. Endogenous peroxidase activity was blocked with 3% H2O2 for 30 min followed with permeabilizing and blocking cells. Rat anti-human C-MYC (1:100 dilution, Santa Cruz biotechnology, Inc.), rabbit anti-human H-RAS (1:100 dilution, Santa Cruz biotechnology, Inc.) and rabbit anti-human P16 (1:100 dilution, Santa Cruz biotechnology, Inc.) monoclonal antibodies were used. The treated cells were incubated with antibody (300ul/well) overnight at 4 ºC, followed by PBS washing 3 times. FITC tagged goat anti-rat (green immunofluorescence) and TRITC tagged goat anti-rabbit secondary antibodies (red immunofluorescence) were added to C-MYC, H-RAS and P16(INK4A) antibody incubated wells respectively, hybridization was carried out at room temperature for 2 h. After removing the secondary antibody, cells were washed with PBS 3 times. 3 visual fields were randomly investigated from each well and the total cell number of cells and the number of fluorescence-positive cells in each field were counted under phase contrast and fluorescence microscope (Nikon ECLIPSE TE2000-U, Japan), respectively. The fluorescence positive fraction in total observed cells was thus calculated.
Statistical analysis
Statistical analysis was carried out using SPSS version 14.0 and one way ANOVA . χ2 test were used for a statistical analysis. Differences were considered statistically significant when p-value was <0.05.
Results
The effects of S-Adenosylmethionine (SAM) on the cell growth
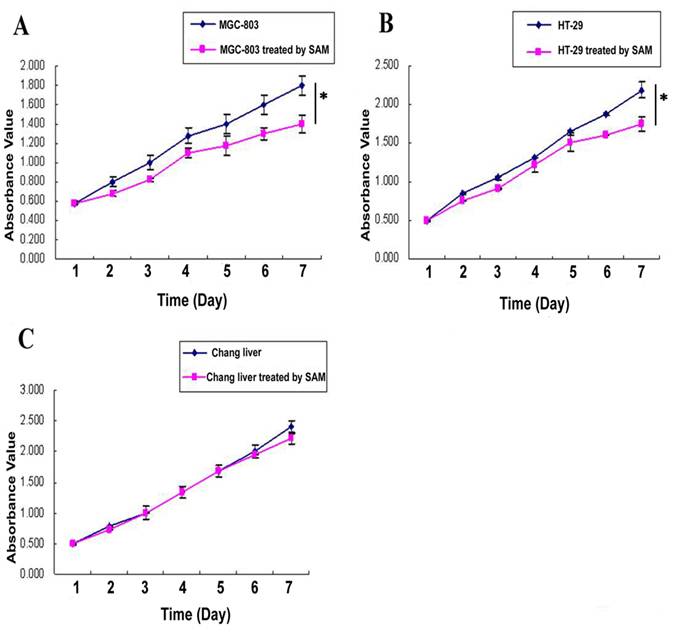
In MTT assay, The cell growth inhibition effect of SAM treatment was much higher in gastric cancer cells MGC-803 (Fig. 1 A) and colon cancer cells HT-29 (Fig. 1 B) than in normal cells (Fig. 1 C), and this difference was significant ( p <0.05).
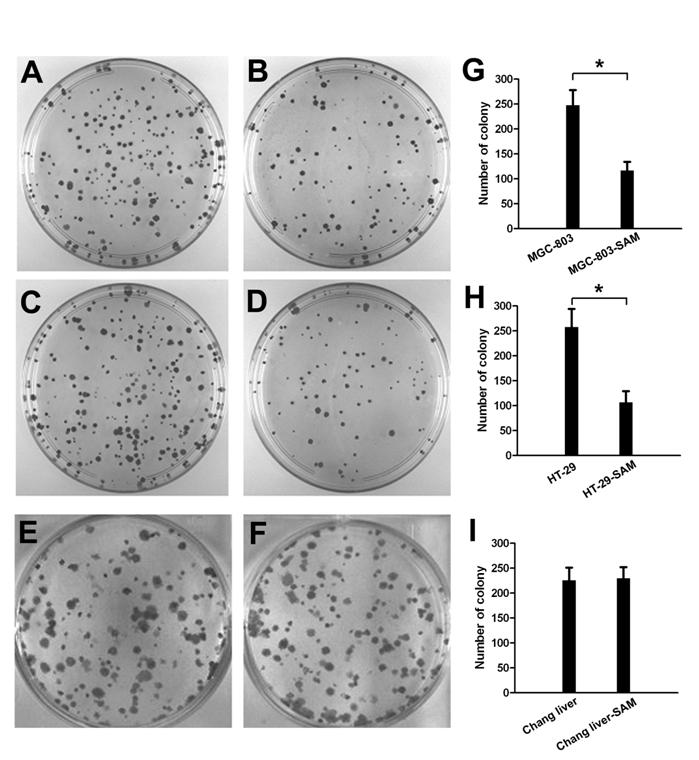
In colony formation assay, the cell growth inhibition effect of SAM treatment was much higher in gastric cancer cells (Fig. 2 A, B) and colon cancer cells (Fig. 2 C, D) than in normal cells (Fig. 2 E, F), and this difference was significant (p <0.05).
MTT assay showing cell growth viability of cancer cells and normal cells in response to SAM treatment. (A) Gastric cancer cells (MGC-803). (B) Colon cancer cells (HT-29). (C) Normal cells (normal chang liver cells). * p <0.05.
The colony formation assay showing cell growth inhibition of cancer cells and normal cells in response to SAM treatment. Representative colony images are shown. (A), (B) with or without SAM treatment in gastric cancer cells (MGC-803). (C), (D) with or without SAM treatment in colon cancer cells (HT-29). (E), (F) with or without SAM treatment in normal cells (normal chang liver cells). (G), (H), (I) data analysis of number of colony. * p <0.05.
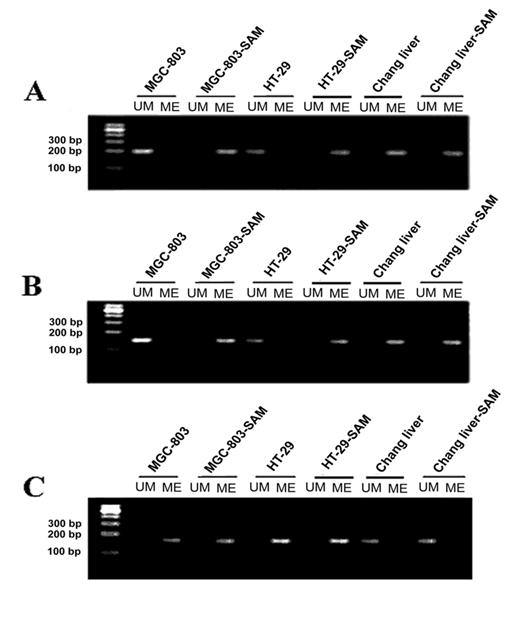
Determining the status of methylation on promoter regions of c-myc and p16 (INK4a) genes by Methylation-specific PCR assay (MSP)
After the treatment with SAM, in MGC-803 cells and HT-29 cells, the CpG islands on the promoter region of c-myc were heavily methylated as evidenced by all the cytosines remaining as cytosines, while in the control groups all the cytosines in CpG dinucleotides had been converted to thymidine, indicating that no cytosine was methylated (Fig.3 A). In sharp contrast, the normal cells, whose CpG islands were highly methylated, no significant change of methylation pattern was observed upon the SAM treatment. These results demonstrate that SAM could specifically induce DNA methylation on oncogenic c-myc, which was active in cancer cells. To test the generality of this observation, we investigated another oncogene, H-ras, in the same cells. Similar to what we observed on c-myc, the H-ras promoter region was in a non-methylated state, which was reversed by SAM treatment (Fig.3 B).
In normal cells, oncogenic c-myc and H-ras are supposed to be hypermethylated, therefore SAM treatment should not have any effect on their methylation pattern. To test this hypothesis, normal human Chang liver cells were used. Indeed, we found that the c-myc and H-ras promoters displayed hypermethylation before and after SAM treatment, with no detectable difference. (Fig.3 A and B)
It has been found that tumor suppressor genes are hypermethylated in cancer cells. To investigate whether SAM treatment can change the methylation pattern of a tumor suppression gene, we studied the methylation status of the P16 (INK4 a) promoter. As expected, we observed a high level of methylation on the P16 promoter, and that no significant change of methylation was found after treating with SAM (Fig.3 C).
Quantitative RT-PCR detection of c-myc, H-ras and P16 expression level
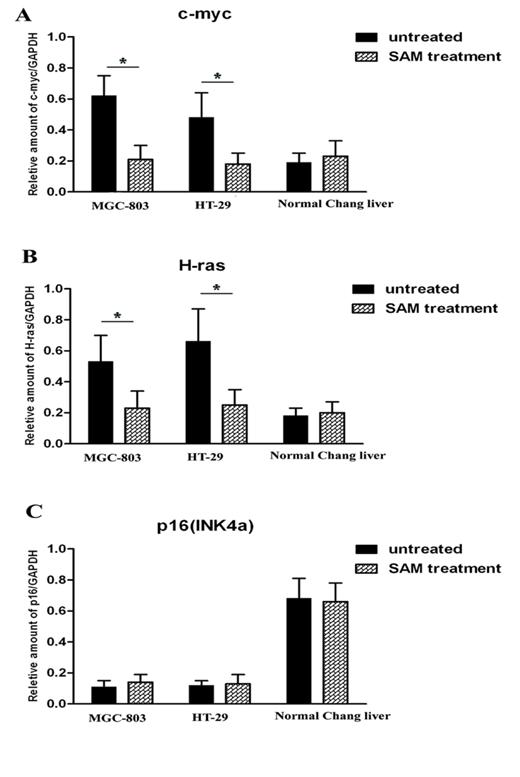
It is predicted that the methylation status of promoters is correlated with gene transcription levels. We thus investigated the mRNA expression level of c-myc, H-ras and P16 in the presence and absence of SAM treatment. In the cancer cells MGC-803 and HT-29, c-myc and H-ras expression was much higher than that in normal cells (p <0.05), while P16, as a tumor suppression gene, exhibits the opposite pattern. After SAM treatment, c-myc and H-ras expression was dramatically decreased. However, we observed no difference in P16 expression level before or after SAM treatment, so as to the mRNA expression of c-myc, H-ras and p16 (INK4a) in normal cells (p >0.05) (Fig.4 A, B, C).
The analysis of methylation status of c-myc, H-ras and P16(INK4a) promoter by MSP assay in cancer cells MGC-803 and HT-29 and normal cells with or without SAM treatment. (A) c-myc promoter. (B) H-ras promter. (C) p16 promoter. M, DNA ladder markers; ME, amplified by methylated primers; UM, amplified by non-methylated primers.
Quantitative RT-PCR analysis of c-myc, H-ras and p16 expression level in cancer cells and normal cells with or without SAM treatment. (A) c-myc mRNA expression. (B) H-ras mRNA expression. (C) p16 mRNA expression. The ratio of c-myc, H-ras and p16 mRNA expression and GAPDH mRNA expression was shown. * p <0.05.
Western blot analysis of C-MYC, H-RAS and P16 (INK4A) proteins
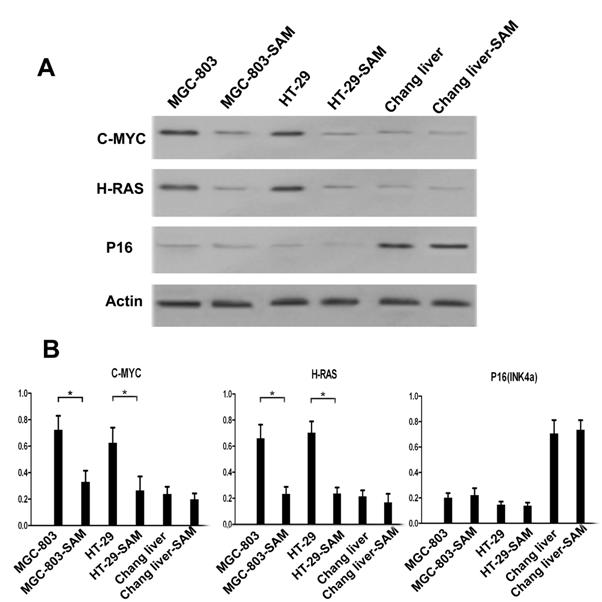
We investigated the protein expression level of C-MYC, H-RAS and P16 in the presence and absence of SAM treatment to explore the relationship of the methylation status of promoters and protein expression levels. In the cancer cells MGC-803 and HT-29, C-MYC and H-RAS expression was much higher than that in normal cells (p <0.05), while P16, as a tumor suppression gene, exhibits the opposite pattern. After SAM treatment, C-MYC and H-RAS expression was dramatically decreased. However, we observed no difference in P16 expression level before or after SAM treatment, so as to the protein expression of C-MYC, H-RAS and P16 (INK4a) in normal cells (p >0.05) (Fig.5 A, B).
Protein Expressions of C-MYC, H-RAS and P16 (INK4A) assayed by immunofluorescence
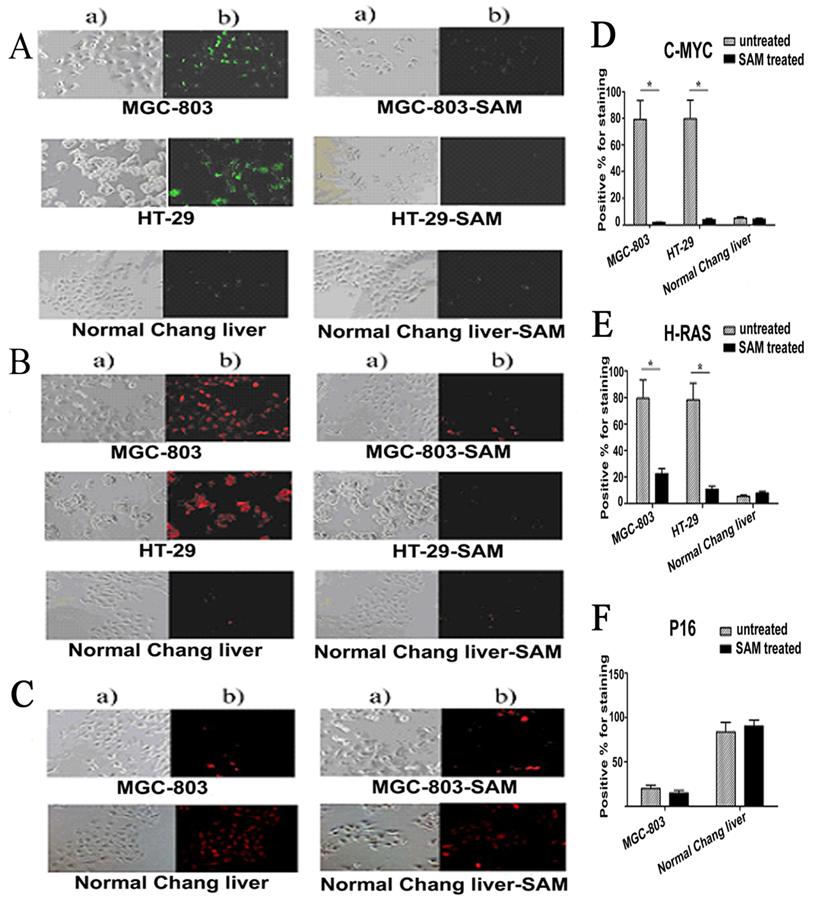
Given that SAM treatment decreased c-myc and H-ras gene transcription by altering DNA methylation on its promoter region in cancer cells but not normal cells, we then asked whether the protein level of these genes were also affected by SAM. Protein levels of c-myc, H-ras and P16 was determined by immunofluorescence, in which antibodies against c-myc, H-ras and P16 were used to visualize the presence and abundance of proteins. In untreated MGC-803 and HT-29 cells, as much as 79.39% and 79.79% of cells, respectively, were positive for c-myc staining. After SAM treatment, however, only 1.85% and 3.94%of cells, respectively, were found having a detectable c-myc expression (Fig. 6 A). Similar to what we observed with c-myc, in untreated MGC-803 and HT-29 cells, as much as 79.32% and 78.18% of cells, respectively, were positive for H-RAS staining. After SAM treatment, however, only 22.64% and 11.0% of cells, respectively, were found having a detectable H-RAS expression (Fig. 6 B).
In contrast, P16 (INK4A) protein levels were low with only 20.0% and 15.02% cells positive for staining in MGC-803 control and SAM treated cell, respectively, indicating that P16 expression was insensitive to SAM treatment. (p >0.05) (Fig. 6 C).
As expected, we found that the protein levels of C-MYC and H-RAS in MGC-803 and HT-29 cells were significantly higher than that in the normal cells, while P16 (INK4A) protein in MGC-803 cells and HT-29 cells was much lower than that in the normal cells (p <0.05). In the normal cells, those treated with SAM showed no difference from the untreated cells in terms of C-MYC, H-RAS and P16 protein levels ( p >0.05) (Fig. 6. A, B, C), demonstrating that normal cells were not sensitive to SAM treatment.
Western blot analysis of C-MYC, H-RAS and P16 expression level in cancer cells and normal cells with or without SAM treatment. (A) C-MYC, H-RAS, P16 and Actin protein expression. (B) Data analysis. The ratio of C-MYC, H-RAS and P16 protein expression and Actin expression was shown. * p <0.05.
Expression of C-MYC, H-RAS and P16 protein assayed by cell immunofluorescence in cancer cells and normal cells with or without SAM treatment. The cells with expressed C-MYC (A), H-RAS (B) and P16 (C) were stained as a green fluorescence or red fluorescence, respectively. The statistical analysis of expression of C-MYC,H-RAS and P16 protein assayed by cell immunofluorescence was shown in (D), (E), and (F) respectively. * p <0.05. a) The cells scored by a bright field microscopy (× 200); b) C-MYC or H-RAS positive cells scored by counting the number of cells with green fluorescence (× 200).
Discussion
The initiation and development of cancer involve the coordinate changes in the expression levels of multiple genes. The epigenome is one of the factors affecting the regulation of gene expression, so that the epigenomic change in genome likely plays a critical role in carcinogenesis. The progression of tumors involves the disruption of machinery that keeps gene expression at a proper level. For instance, some tumor suppressor genes that are normally active in normal cells are silenced and many oncogenes that are necessary for migration, invasion and metastasis are activated [16-18].
The change of methylation patterns in the promoter region of genes is one of the pathways for regulating gene expression at a transcription level [19, 20]. Numerous studies have suggested that promoters of tumor suppressor genes are hypomethylated or even non-methylated in normal cells. However, hypermethylation of tumor suppressor genes is frequently found in tumor cells, thus resulting in the down-regulation of gene expression and an increased proliferation capacity for cancerous cells [21-24]. Meanwhile, accumulated evidence demonstrates that inversing the hypermethylated status of tumor suppressor genes by using demethylated drugs led to the restoration of gene expression, thus inhibiting tumor cell growth [25-27].
In cancer cells, a global hypomethylation on a gene promoter seems to be much less frequent than hypermethylation. However, the loss of DNA methylation often happens on the DNA sequence controlling gene transcription [28]. A recent study demonstrated that the gene encoding the protease urokinase (PLAU/uPA) was hypomethylated so that its expression was up-regulated, which was proposed to correlate with the progression of prostate cancer [29]. Increased hypomethylation of uPA in cancer invasion was induced by incubation of cancer cells with 5-azadeoxycytidine and was associated with upregulation of uPA gene [30]. There are other genes exhibiting hypomethylation and active transcription in carcinogenesis, such as S100A4, PGP9.5, POMC [31-34]. In our study, the oncogenes c-myc and H-ras were hypermethylated and had low expression levels in the normal control cell line. On the contrary, in tumor cells, c-myc and H-ras had aberrant hypomethylation and their expressions were upregulated. This hypomethylated status was tumor-specific, presenting a potential mechanism to be used as a molecular marker for clinical detection of tumors.
S-Adenosylmethionine (SAM) is a methyl donor for numerous methylation reactions and acts as an inhibitor of intracellular demethylase activity, which results in hypermethylation of DNA [35]. Zhao et al. [36] found that SAM inhibited the growth of gastric cells (SGC-7901 and MKN-45 cells) and the effects were enhanced with the increased concentration of SAM and treatment time course. The expression of c-myc and uPA in gastric cells significantly decreased after SAM treatment and was due to partial or complete methylation of c-myc and uPA. In vivo, the tumor volume was significantly lower in the SAM treatment group than in the control group. Shukeir N et al. [37] tested the hypothesis that cell invasiveness and tumorigenesis are driven by hypomethylation of genes in prostate cancer cells. SAM treatments resulted in a dose- and time-dependent inhibition of key genes, such as uPA, MMP-2, and VEGF to decrease tumor cell invasion in vitro and in vivo. No change was detected in the levels of expression of genes already known to be methylated, such as glutathione S-transferase P1 and the androgen receptor. Their data supported the hypothesis that DNA hypomethylation controls the activation of oncogens and provides valuable insight into developing novel therapeutic strategies against this common disease, which targets the demethylation machinery.
SAM is a cytotoxic drug which can kill tumor cells while no toxicity has been observed in normal cells. Lu et al. [38, 39] suggested that predisposition to hepatocellular carcinoma (HCC) could be partly explained by the effect of SAM on cell growth. SAM inhibited the mitogenic effect of growth factors such as hepatocyte growth factor. Interestingly, not only could SAM control liver growth, it also regulated apoptosis. SAM is anti-apoptotic in normal hepatocytes but pro-apoptotic in liver cancer cells. In liver cancer cells, but not in normal human hepatocytes, SAM selectively induced Bcl-x(S), an alternative splice variant of Bcl-x(L) that promotes apoptosis. Therefore, SAM could be used as an attractive agent for both chemoprevention and treatment of HCC. The apoptotic effect of SAM treatment has also been found in colon cancer cells, but no toxic effects in normal colon epithelial cells. This is similar to the effect of SAM on liver cancer cells but with different molecular mechanism. SAM may via down-regulate the expression of cFLIP (cFLIP's over-expression was able to prevent SAM-induced apoptosis) to induce apoptosis [40].
Nowadays, SAM has been applied to clinical trials. SAM is used to treat intrahepatic cholestasis and alcoholic liver disease. Human clinical trials have showed that after patients with cholestasis given to SAM administration, cholestasis and liver function were improved obviously. Serum levels of TB, AKP, ALT, AST, GT were markedly decreased in the third week, and normalized in the fourth week [41]. So we take into account that SAM is a cytoprotective agent against acute and chronic toxic liver injury in humans. SAM is also used to treat psychiatric depression. A study indicated that 195 patients were given 400 mg of intramuscular SAM for 15 days, their depressive symptoms showed remission after the treatment with SAM [42]. Although the side effects of SAM in short-term use are few, there is no evidence on side effect or toxicity in long-term. Besides, a large dose of SAM given to patients may induce hypomania to mania in children and adolescents, and the safest dose for a depressed patient was not clear [43].
In our present study, we found that SAM significantly inhibited tumor cell growth with a minor effect on normal cells in MTT assay (growth rate decreased by 22% and 20.3% vs. 6.8% upon treatment in gastric cancer, colon cancer and normal cells, respectively), and colony formation assay, suggesting that SAM could be used for cancer treatment. Our data also shows that SAM is able to effectively induce the DNA methylation on oncogenes, such as c-myc and H-ras, but not the tumor suppressor gene p16, which probably is due to the fact that in cancer cells, tumor suppressor genes are usually hypermethylated. In normal cells, oncogenic c-myc and H-ras are supposed to be hypermethylated, therefore SAM treatment should not have any effect on their methylation pattern. To examine this hypothesis, normal human Chang liver cell lines were used negative control cells. Indeed, we found that the c-myc and H-ras promoters displayed hypermethylation before and after SAM treatment, with no detectable difference. Interestingly, in normal cells where the p16 promoter was hypomethylated, SAM treatment was unable to increase the methylation level on p16, indicating that normal cells might use a different pathway that is SAM insensitive for regulating DNA methylation. Taken together, our data are consistent with the hypothesis that the hypomethylation of critical genes like c-myc and H-ras plays an important role in carcinogenesis. We propose that SAM, as a DNA hypermethylating agent, could be used as a novel therapeutic drug to silence the oncogene c-myc and H-ras and block the progression of gastric and colon cancers.
Acknowledgements
We are grateful to Dr. Yong Zhao (The university of Texas Southwestern Medical Center, USA) and Dr. Phillip Smiraldo (The university of Texas Southwestern Medical Center, USA) for critical review of the manuscript. This work was supported by Chinese National Natural Science Foundation Grant (No. 30901703), Tianjin Education Committee Technology Development Grant (No. 20080107) and Tianjin Medical University Natural Science Grant (No. 2008ky02).
Abbreviations
SAM: S-Adenosylmethionine; MSP: Methylation-Specific Polymerase chain reaction; MTT: 3-(4:5-dimethylthiazol-2-yl)-2:5-diphenyltetrazolium bromide; DMSO: dimethyl sulfoxide.
Conflict of Interests
The authors declare that no conflict of interest exists.
References
1. Baylin SB, Ohm JE. Epigenetic gene silencing in cancer - a mechanism for early oncogenic pathway addiction? Nat Rev Cancer. 2006;6:107-116
2. Laird PW. Principles and challenges of genome-wide DNA methylation analysis. Nat Rev Genet. 2010;11:191-203
3. Bhutani N, Brady JJ, Damian M. et al. Reprogramming towards pluripotency requires AID-dependent DNA demethylation. Nature. 2010;463:1042- 1047
4. Daura-Oller E, Cabre M, Montero MA. et al. Specific gene hypomethylation and cancer: New insights into coding region feature trends. Bioinformation. 2009;3:340-343
5. Tomita H, Hirata A, Yamada Y. et al. Suppressive effect of global DNA hypomethylation on gastric carcinogenesis. Carcinogenesis. 2010;31:1627-1633
6. Wang Z, Xu J, Geng X. et al. Analysis of DNA methylation status of the promoter of human telomerase reverse transcriptase in gastric carcinogenesis. Arch Med Res. 2010;41:1-6
7. McCabe MT, Brandes JC, Vertino PM. Cancer DNA methylation: molecular mechanisms and clinical implications. Clin Cancer Res. 2009;15:3927-3937
8. Escoubet-Lozach L, Lin IL, Jensen-Pergakes K. et al. Pomalidomide and lenalidomide induce p21 WAF-1 expression in both lymphoma and multiple myeloma through a LSD1-mediated epigenetic mechanism. Cancer Res. 2009;69:7347-7356
9. Majid S, Dar AA, Ahmad AE. et al. BTG3 tumor suppressor gene promoter demethylation, histone modification and cell cycle arrest by genistein in renal cancer. Carcinogenesis. 2009;30:662-670
10. Richards KL, Zhang B, Baggerly KA. et al. Genome-wide hypomethylation in head and neck cancer is more pronounced in HPV-negative tumors and is associated with genomic instability. PLoS One. 2009;4:e4941
11. Choi JY, James SR, Link PA. et al. Association between global DNA hypomethylation in leukocytes and risk of breast cancer. Carcinogenesis. 2009;30:1889-1897
12. Szyf M, Pakneshan P, Rabbani SA. DNA methylation and breast cancer. Biochem Pharmacol. 2004;68:1187-1197
13. Wolff EM, Byun HM, Han HF. et al. Hypomethylation of a LINE-1 promoter activates an alternate transcript of the MET oncogene in bladders with cancer. PLoS Genet. 2010;6:e1000917
14. Luka Z, Mudd SH, Wagner C. Glycine N-methyltransferase and regulation of S-adenosylmethionine levels. J Biol Chem. 2009;284:22507-22511
15. Bale S, Ealick SE. Structural biology of S-adenosylmethionine decarboxylase. Amino Acids. 2010;38:451-460
16. Pino MS, Chung DC. The chromosomal instability pathway in colon cancer. Gastroenterology. 2010;138:2059-2072
17. Zhang J, Liu X, Datta A. et al. RCP is a human breast cancer-promoting gene with Ras-activating function. J Clin Invest. 2009;119:2171-2183
18. Whittaker S, Marais R, Zhu AX. The role of signaling pathways in the development and treatment of hepatocellular carcinoma. Oncogene. 2010;29:4989-5005
19. Vanyushin BF. Enzymatic DNA methylation is an epigenetic control for genetic functions of the cell. Biochemistry (Mosc). 2005;70:488-499
20. Turner JD, Pelascini LP, Macedo JA. et al. Highly individual methylation patterns of alternative glucocorticoid receptor promoters suggest individualized epigenetic regulatory mechanisms. Nucleic Acids Res. 2008;36:7207-7218
21. Taghavi N, Biramijamal F, Sotoudeh M. et al. p16INK4a hypermethylation and p53, p16 and MDM2 protein expression in Esophageal Squamous Cell Carcinoma. BMC Cancer. 2010;10:138
22. Calvisi DF, Ladu S, Gorden A. et al. Mechanistic and prognostic significance of aberrant methylation in the molecular pathogenesis of human hepatocellular carcinoma. J Clin Invest. 2007;117:2713-2722
23. Gonzalo V, Lozano JJ, Muñoz J. et al. Aberrant gene promoter methylation associated with sporadic multiple colorectal cancer. PLoS One. 2010;5:e8777
24. Wang X, Lau KK, So LK. et al. CHD5 is down-regulated through promoter hypermethylation in gastric cancer. J Biomed Sci. 2009;16:95
25. Szyf M. The role of DNA hypermethylation and demethylation in cancer and cancer therapy. Curr Oncol. 2008;15:72-75
26. Liu Z, Marquez M, Nilsson S. et al. Incubation with somatostatin, 5-aza decitabine and trichostatin up-regulates somatostatin receptor expression in prostate cancer cell. Oncol Rep. 2008;20:151-154
27. Chuang JC, Warner SL, Vollmer D. et al. S110, a 5-Aza-2'-deoxycytidine-containing dinucleotide, is an effective DNA methylation inhibitor in vivo and can reduce tumor growth. Mol Cancer Ther. 2010;9:1443-1450
28. Paliwal A, Vaissière T, Krais A. et al. Aberrant DNA methylation links cancer susceptibility locus 15q25.1 to apoptotic regulation and lung cancer. Cancer Res. 2010;70:2779-2788
29. Pulukuri SM, Estes N, Patel J. et al. Demethylation-linked activation of urokinase plasminogen activator is involved in progression of prostate cancer. Cancer Res. 2007;67:930-939
30. Ateeq B, Unterberger A, Szyf M. et al. Pharmacological inhibition of DNA methylation induces proinvasive and prometastatic genes in vitro and in vivo. Neoplasia. 2008;10:266-278
31. Rosty C, Ueki T, Argani P. et al. Overexpression of S100A4 in pancreatic ductal adenocarcinomas is associated with poor differentiation and DNA hypomethylation. Am. J. Pathol. 2002;160:45-50
32. Sato N, Fukushima N, Matsubayashi H. et al. Identification of maspin and S100P as novel hypomethylation targets in pancreatic cancer using global gene expression profiling. Oncogene. 2004;23:1531-1538
33. Lee YM, Lee JY, Kim MJ. et al. Hypomethylation of the protein gene product 9.5 promoter region in gallbladder cancer and its relationship with clinicopathological features. Cancer Sci. 2006;97:1205-1210
34. Ye L, Li X, Kong X. et al. Hypomethylation in the promoter region of POMC gene correlates with ectopic overexpression in thymic carcinoids. J. Endocrinol. 2005;185:337-343
35. Detich N, Hamm S, Just G. et al. The methyl donor S-Adenosylmethionine inhibits active demethylation of DNA: a candidate novel mechanism for the pharmacological effects of S-Adenosylmethionine. J Biol Chem. 2003;278:20812-20820
36. Zhao Y, Li JS, Guo MZ. et al. Inhibitory effect of S-adenosylmethionine on the growth of human gastric cancer cells in vivo and in vitro. Chin J Cancer. 2010;29:752-760
37. Shukeir N, Pakneshan P, Chen G. et al. Alteration of the methylation status of tumor-promoting genes decreases prostate cancer cell invasiveness and tumorigenesis in vitro and in vivo. Cancer Res. 2006;66:9202-9210
38. Lu SC, Mato JM. S-Adenosylmethionine in cell growth, apoptosis and liver cancer. J Gastroenterol Hepatol. 2008;23(Suppl1):S73-77
39. Ramani K, Yang H, Kuhlenkamp J. et al. Changes in the expression of methionine adenosyltransferase genes and S-adenosylmethionine homeostasis during hepatic stellate cell activation. Hepatology. 2010;51:986-995
40. Li TW, Zhang Q, Oh P. et al. S-Adenosylmethionine and methylthioadenosine inhibit cellular FLICE inhibitory protein expression and induce apoptosis in colon cancer cells. Mol Pharmacol. 2009;76(1):192-200
41. Li N, Zhang HH, Wang SH. et al. S-adenosylmethionine in treatment of cholestasis after total parenteral nutrition: laboratory investigation and clinical application. Hepatobiliary Pancreat Dis Int. 2002;1(1):96-100
42. Silveri MM, Parow AM, Villafuerte RA. et al. S-adenosyl-L-methionine: effects on brain bioenergetic status and transverse relaxation time in healthy subjects. Biol Psychiatry. 2003;54(8):833-839
43. Schaller JL, Thomas J, Bazzan AJ. SAMe use in children and adolescents. Eur Child Adolesc Psychiatry. 2004(5):332-334
Author contact
![]() Corresponding author: Xin Geng, Department of Biochemistry, Tianjin Medical University, Tianjin, 300070 China. Tel: 86-22-23542521, E-mail: gengxin111com.
Corresponding author: Xin Geng, Department of Biochemistry, Tianjin Medical University, Tianjin, 300070 China. Tel: 86-22-23542521, E-mail: gengxin111com.

 Global reach, higher impact