Impact Factor ISSN: 1449-2288
- Issue 12; 2026
- Issue 11; 2026
- Issue 10; 2026
- Issue 9; 2026
- Issue 8; 2026
- Volume 22; 2026
- Past Issues
- Advance Articles
- Editorial Board
- Cover Images
- Index & Coverage
- Cover Suggestion
- Special Issues
INTRODUCTION
MATERIALS and METHODS
RESULTS
DISCUSSION
Supplementary Material
Acknowledgements
References

 Global reach, higher impact
Int J Biol Sci 2011; 7(3):308-322. doi:10.7150/ijbs.7.308 This issue Cite
Research Paper
Rat Mitochondrion-Neuron Focused Microarray (rMNChip) and Bioinformatics Tools for Rapid Identification of Differential Pathways in Brain Tissues
Yan A. Su ![]() , Qiuyang Zhang, David M. Su, Michael X. Tang
, Qiuyang Zhang, David M. Su, Michael X. Tang
Department of Gene and Protein Biomarkers, GenProMarkers Inc., Rockville, MD 20850, USA
Received 2011-1-1; Accepted 2011-3-25; Published 2011-3-29
Abstract
Mitochondrial function is of particular importance in brain because of its high demand for energy (ATP) and efficient removal of reactive oxygen species (ROS). We developed rat mitochondrion-neuron focused microarray (rMNChip) and integrated bioinformatics tools for rapid identification of differential pathways in brain tissues. rMNChip contains 1,500 genes involved in mitochondrial functions, stress response, circadian rhythms and signal transduction. The bioinformatics tool includes an algorithm for computing of differentially expressed genes, and a database for straightforward and intuitive interpretation for microarray results. Our application of these tools to RNA samples derived from rat frontal cortex (FC), hippocampus (HC) and hypothalamus (HT) led to the identification of differentially-expressed signal-transduction-bioenergenesis and neurotransmitter-synthesis pathways with a dominant number of genes (FC/HC = 55/6; FC/HT = 55/4) having significantly (p<0.05, FDR<10.70%) higher (≥1.25 fold) RNA levels in the frontal cortex than the others, strongly suggesting active generation of ATP and neurotransmitters and efficient removal of ROS. Thus, these tools for rapid and efficient identification of differential pathways in brain regions will greatly facilitate our systems-biological study and understanding of molecular mechanisms underlying complex and multifactorial neurodegenerative diseases.
Keywords: Microarray, bioinformatics, mitochondrion, canonical pathway, neuroscience
INTRODUCTION
Mitochondrial function is of particular importance in brain because of its high energy (ATP) demand. Ninety percent (90%) of the cell ATP are generated via mitochondrial oxidative phosphorylation (OXPHOS). Although the human brain represents only 2% of body weight, it receives 15% of the body's cardiac output, and uses 20% of total body oxygen. The high levels of oxygen and energy needs are continuous, and a brief period of deprivation may impair neuron function and even result in neuron death. In addition, mitochondrial dysfunctions are frequently documented as a key pathogenic factor in stress related mental disorders[1-3].
Mitochondria are the double-membrane-enclosed intracellular organelles and widely known as the “energy factories” of the cell for their role in ATP production via OXPHOS, a process that also produce reactive oxygen species (ROS) as the byproducts. The high ATP production in the neurons implies an efficient removal of ROS. Other roles of mitochondria include β-oxidation, the tricarboxylic acid (TCA) and urea cycles, the synthesis of steroid hormones and heme, calcium signaling, mitochondrial fission and fusion, regulation of lipid concentration in the mitochondrial membranes and the mitochondrial permeability, and control of cell cycle, survival and death[4;5]. Mitochondria are the only organelles possessing DNA (mtDNA) as well as transcription and translation machineries in the cytoplasm[6]. The number of mitochondria per cell varies widely from a single mitochondrion to thousands of mitochondria per cell[7;8]. mtDNA encodes only 37 gene products; the vast majority of mitochondrial proteins are encoded by the nuclear DNA (nDNA), synthesized by ribosomes in the cytoplasm, and imported into the organelles[9]. The highly integrated cross-functionality between nuclear and mitochondrial genomes is essential for maintenance of cellular homeostasis. Defects and abnormal expression of mitochondria-focused genes are correlated to rare disease (e.g., Leigh syndrome and lethal infantile cardiomyopathy)[10;11] and are also recognized in common diseases, such as neurodegeneration, aging, cancer, obesity and diabetes[12-14].
Here, we described the development of rat mitochondrion-neuron focused oligonucleotide microarray (rMNChip) and integrated bioinformatics tools. rMNChip contains the 37 mtDNA-encoded genes, 1,098 nDNA-encoded and mitochondria-related genes[15], and 365 nDNA-encoded and neuron-related genes, each in triplicate. The rMNChip bioinformatics tool consists of an algorithm for authentic identification of differentially expressed genes, and a database for straightforward and intuitive interpretation for microarray results. Applying these tools for analysis of RNA samples derived from rat frontal cortex (FC), hippocampus (HC) and hypothalamus (HT) led to rapid identification of the interrelated, differentially-expressed signal-transduction-bioenergenesis and neurotransmitter-synthesis pathways between the frontal cortex and the hippocampus or hypothalamus. Thus, the rMNChip and integrated bioinformatics tools are useful for rapid identification of differential pathways and will facilitate our systems-biologic study and understanding of molecular mechanisms underlying complex and multifactorial neurodegenerative diseases.
MATERIALS and METHODS
Gene selection, oligonucleotide design and preparation: rMNChip contains 1,500 genes including 37 mitochondrial DNA (mtDNA)-encoded genes, 1,098 nuclear DNA (nDNA)-encoded and mitochondria-focused genes[15], and 365 neuron-related genes. These 365 genes were derived by searching the NCBI database (www.ncbi.nlm.nih.gov/gene) using the key words: fear response, circadian rhythms and signal transduction. The oligonucleotides were designed from the full length mRNA sequences as the templates by using the software MacVector v10.6.0 (MacVector). The criteria for selecting oligonucleotides included 50 nucleotides in length (50-mer), absence of hairpin structures in the sequence, 45-55 percent of G+C contents and a Tm higher than 65oC[16]. An amino-C6 was added to the 5' end of each probe to enhance binding of the DNA to glass slides and accessibility for hybridization with target DNA. 5'-amino-C6 modified 50-mers were synthesized and extracted to high purity by a commercial service (Eurofins MWG Operon).
Microarray design and fabrication: The 1,500 test genes (including 80 “housekeeping” genes as positive control) and 36 negative controls (non rat DNA) were printed, each in triplicates, onto the N-hydroxysuccinimide ester reactive groups-coated glass slides (CodeLink Activated Slide, SurModics, Eden Prairie, Minnesota). DNA probes in the print buffer (50 mM sodium phosphate) at the final concentration of 20 μM of 5'-amino-C6 modified 50-mers were printed in the Class 100 super-clean environment as described previously[15;17;18], using 100-micron pins and the GeneMachine OmniGrid 100 Microarrayer (Genomic Solutions, Ann Arbor, MI).
Microarray labeling and hybridization, image scanning and processing: RNA samples of rat brain tissues were purchased from Zyagen (San Diego, California). One microgram RNA per sample was used for Cy5-dUTP (Enzo Life Sciences, Plymouth Meeting, Pennsylvania) labeling of cDNA. The cDNA synthesis and microarray hybridization were carried out by use of the express array detection kit (3DNA Array 900, Genisphere, Hatfield, Pennsylvania) following the manufacturer's instructions. Slides were scanned using the ScanArray Microarray Scanner (PerkinElmer) at 90% laser power, 68 PMT voltages, 5 micron resolution and LOWESS method. Microarray images were quantified by use of the rMNChip gene array list file. In the digitized data, each scanned spot was labeled by a flag either as “0” (found but not good), “1” (not found), “2” (absent), “3” (good), or “4” (bad). The “good” spots were defined by the scanner software setups as the spot with a calculated footprint <100 μm.
Database and data analysis: A database includes individual and relational expression files, and relational and category bioinformation files were compiled with the software FileMaker Pro (FileMaker, Inc., Santa Clara, CA) as described previously[15]. Microarray data were filtered within the database using the following criteria: (i) test gene spots, being included for further analysis; (ii) spot flag = 0 or 2, being removed; spot flag = 1, being removed if it occurs in all samples; spot flag = 3, being included; spot flag = 4, being removed; and (iii) signal to noise ratio (i.e., spot mean pixel intensity minus background mean pixel intensity and then divided by background standard deviation) ≥1 in all genes and samples. To normalize spot data, the background-subtracted mean intensities of a spot were multiplied by the corresponding spot area ([diameter÷2]2 π) and then, the resultant values were divided by a common area with the spot diameter of 100 microns. Data were normalized across all intra- and inter-slide spots and array experiments, and then used for the calculation of means, standard deviations, fold changes, moderated p values and false discovery rates (FDR).
Gene bioinformation: Gene IDs, official symbols and names were downloaded from the NCBI database (www.ncbi.nlm.nih.gov/gene). Ontology (molecular function, biological process, and cellular component), phenotype (genetic disorder), Kyoto Encyclopedia of Genes and Genomes (KEGG) pathways and Online Mendelian Inheritance in Man (OMIM) were from DAVID Bioinformatics Resources (http://david.abcc.ncifcrf.gov). Drug targets associated with gene products were from PharmGKB pharmacogenomics knowledge base (http://www.pharmgkb.org/search/index.jsp).
Statistics: The quantile normalization method (27) in software R/Bioconductor version 2.7.1 (The R Foundation for Statistical Computing) was used to normalize data. Means, standard deviations and fold changes were calculated from triplicate experiments using XLSTAT 2006 (XLSTAT, New York, NY, USA). Differentially expressed genes were identified arbitrarily as having a ≥1.25-fold change in the average expression of the background-subtracted mean intensity ratios of a gene between comparisons. The moderated p-values and false discovery rate (FDR) for multiple statistical testing with Benjamini and Hochberg methods [19] were calculated with the software R/Bioconductor. The level of statistical significance was set at a p-value <0.05 with a specific FDR indicated.
RESULTS
Fifteen hundred genes and oligonucleotide probes on rMNChip
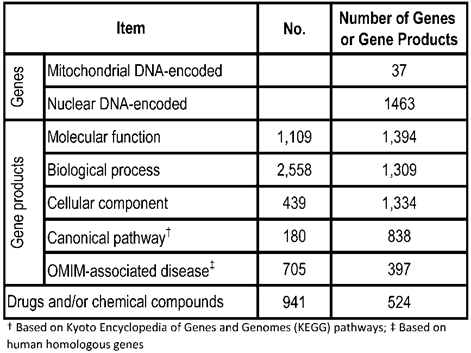
rMNChip contains 1,500 rat genes, consisting of 37 mtDNA-encoded genes, 1,098 nDNA-encoded and mitochondrial structure- and function-related genes, and 365 genes relevant to stress response, circadian rhythms and signal transduction. Our gene bioinformatic analysis of these 1,500 genes revealed 1,109 molecular functions associated with 1,394 genes, 2,558 biological processes with 1,309 genes, 439 cellular components with 1,334 genes, 180 canonical pathways with 838 genes, 705 OMIM-associated diseases with 397 genes, and 941 drugs and/or chemical compounds with 524 genes (Table 1). Using the uniform criteria, we designed 1,500 probes of 5'-amino-C6 modified 50-mers and created the rMNChip microarrays. Supplementary Material: Table S1 lists 1500 rat gene ID, the official gene symbols, and the probe sequences.
Bioinformation of 1,500 Genes on rMNChip Gene Chip
Uniform spot shape, low background, and high signal-to-noise ratio of rMNChip microarrays
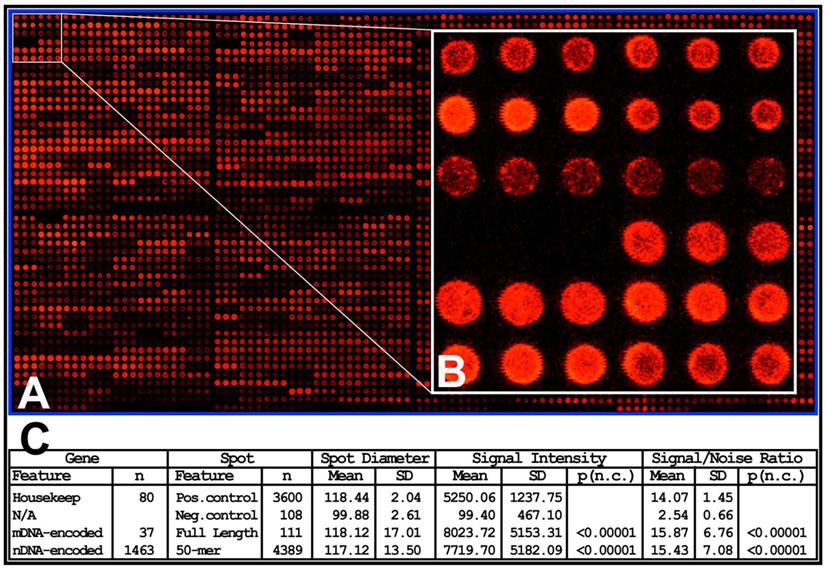
The rMNChip quality was assessed by microarray experiments with technical and experimental triplicates using RNA samples of rat frontal cortex, hippocampus, hypothalamus, cerebrum and cerebellum. The microarray images showed a uniform spot shape, low background intensities, high signal-to-noise ratios and overall consistent signal intensities on hybridized chips (Fig. 1). Specifically, the diameters of 108 negative control, 240 positive control, 111 mtDNA-encoded gene and 4,149 nDNA-encoded gene spots were 99.88±0.33, 118.44±2.04, 118.12±2.17, and 117.20±2.21 microns, respectively. The corresponding background-subtracted mean pixel intensities were 9.95±29.07, 5017.37±1141.38, 5516.82±1487.24, and 5293.43±1258.56, respectively. On average, the signal intensities of mtDNA-encoded gene spots (5516.82 units per pixel) and nDNA-encoded gene spots (5293.43 units per pixel) were 554.5-fold and 532.0-fold higher than those of the negative control (9.95 units per pixel), respectively. The mean signal-to-noise ratios of the negative control, positive control, mtDNA-encoded and nDNA-encoded gene spots were 2.33±0.31, 14.07±1.45, 15.70±1.98, and 15.17±1.83, respectively. The differences between the test genes or positive controls and the negative controls were all highly significant (p <0.0001). In contrast, the differences among the positive controls, mtDNA- and nDNA-encoded genes were not statistically significant (p >0.05), as expected (Fig. 1).
High quality rMNChip microarray. (A) Representative microarray image of rMNChip. This pseudo-colored image represents an rMNChip microarray hybridized with the Cy5-labeled target cDNA reverse-transcribed from a rat brain RNA sample. Eight printing pinss were used to print 8 sub-arrays of rMNChip and each element was printed as a spot of technical triplicates adjacent to each other. The pixel intensities on spotted probes reflect abundances of hybridized target cDNA. (B) The inset shows details of spots morphologies of 12 genes (36 spots) with signal intensities ranging from high, to low and undetectable. (C) A table summarizes information of the genes and spots in the negative controls, positive controls, mtDNA- and nDNA-encoded test genes. The differences between the negative control and the others were highly significant (p<0.0001) while the difference between the positive control and the test spots were not statistically significant (p>0.05), as expected.
Consistent intra- and inter-chip results
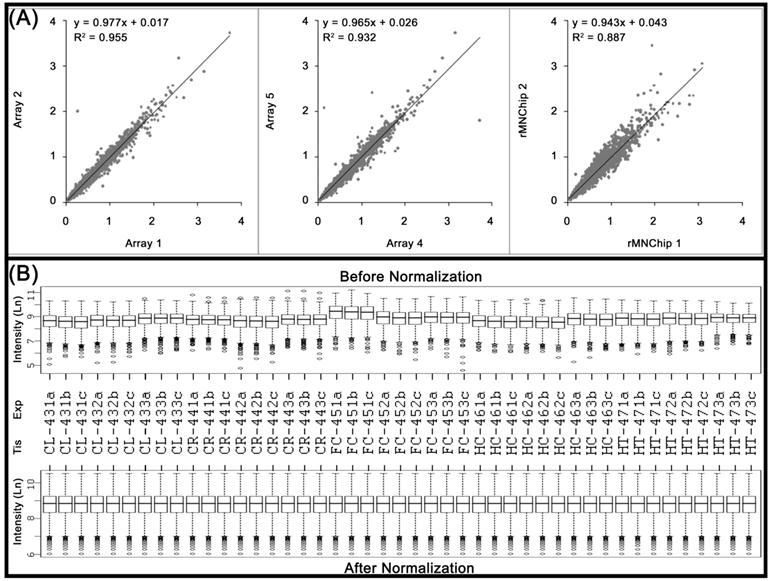
The consistency between rMNChip microarrays was evaluated by two-by-two comparisons of the normalized (but not log transformed) mean pixel intensities between the same rMNChip spots (intra-chip comparison) and between the different rMNChip spots (inter-chip comparison) hybridized with cDNA labeled using the same RNA samples. Our results revealed high similarities between the comparisons (Fig.2A). Specifically, when one set of genes (Array 1) was compared with another (Array 2), a linear relationship of y=0.977x + 0.017 and a coefficient of determination of r2=0.955, were obtained on a scatter plot of the normalized mean pixel intensities between the comparison. A linear relationship of y=0.965x + 0.026 and the coefficient of determination of r2=0.932 were found in the comparison between Arrays 4 and 5. In the case of the inter-chip comparison, a linear relationship of y=0.943x + 0.043 and the coefficient of determination of r2=0.887 were derived (Fig. 2A).
Consistency of the rMNChip microarrays and data normalization. (A) The consistency in gene expression levels between the intra and inter rMNChip microarrays hybridized with the same RNA sample. A scatter plot and fitted line of signal intensities of 1,465 informative genes between two sets of genes on Array 1 and Array 2 on Slide 1 (left panel) and Array 4 and Array 5 on Slide 2 (middle panel), and between two different rMNChip microarrays (right panel). Each array was hybridized with Cy5-labeled cDNA sample synthesized from the same RNA samples via parallel microarray experiments. The normalized (but not log-transformed) signal intensities of 1,465 informative genes from one were plotted against those of the other. The strong linear relationship (y = ax + b) and the positive coefficient of determination (r2) were computed from the scatter plots and indicated in each comparison. “x”: signal intensity of a spot on one microarray, “y”: signal intensity of the corresponding spot on the other microarray. (B) Box plots of expression data before and after normalization. The quantile normalization algorithms were used to adjust the values of the background-subtracted mean pixel intensities of each and every set of 4,395 spots across intra- and inter- rMNChip microarrays hybridized with Cy5-labeled RNA samples indicated. In contrast to the boxplot of pre-normalization data (top panel), the post-normalized data distributes in the same intervals with the same density center, indicating successful adjustment of data. The post-normalized data were used for further analysis. Ln: the natural logarithm, Tis: brain tissue, Exp: microarray experiments including technical and experimental triplicates, CL: cerebellum, CR: cerebrum, FC: frontal cortex, HC: hippocampus, and HT: hypothalamus.
rMNChip computing procedures for identification of differentially expressed genes
The customized computational procedures include microarray image evaluation, data filtering, spot size correction, inclusion, normalization and comparison. Microarray image evaluation is aimed at revealing image quality including background, signal-to-noise ratio, and overall consistent spot pixel intensities. An image with a uniformly low background, high signal-to-noise ratios and overall consistency is used for data acquisition. Data filtering is aimed at removing data that may lead to false positives or negatives. Spot size correction is aimed at normalizing spot signal intensities; spot sizes need to be normalized because a spot's area changes slightly as the hybridized signal intensities do. Data inclusion is aimed at determining whether all spots passing the data filtering should be used for further analysis. Because not all 9 spots per gene per sample (i.e., triplicate spots/chip and triplicate experiments/sample) may pass the filter criteria, inclusion of genes with fewer than 9 spots per gene may complicate data analysis due to the missing spots. Alternatively, one may choose to include only genes with all the 9 spots fulfilling the filtering criteria for further analysis, but the number of genes in the final result may be reduced.
Data normalization is aimed at removing non-biological variations that can arise in any step of microarray experiments, such as array printing, RNA preparation, labeling, hybridization, or scanning[20]. Before and after performing quantile normalization[21], the pixel intensities of 65,925 spots (i.e., triplicate spots/gene/chip, of 1465 genes included, from triplicate array experiments, performed on five rat brain tissue samples) were transformed into the natural log. The transformed values were plotted as the boxplots to visualize successful adjustment of the data (Fig. 2B).
Data comparison is aimed at computing the means, standard deviations, fold changes, p-values and FDR of the normalized gene pixel intensities between desired comparisons, in order to reveal differentially expressed genes. Significantly differentially expressed genes between the frontal cortex and the hippocampus or hypothalamus, and between hippocampus and hypothalamus were presented as the supplementary data (See Supplementary Material: Table S2, Table S3 and Table S4). The cerebrum and cerebellum contain a numerous brain regions and their data were not further analyzed.
rMNChip database
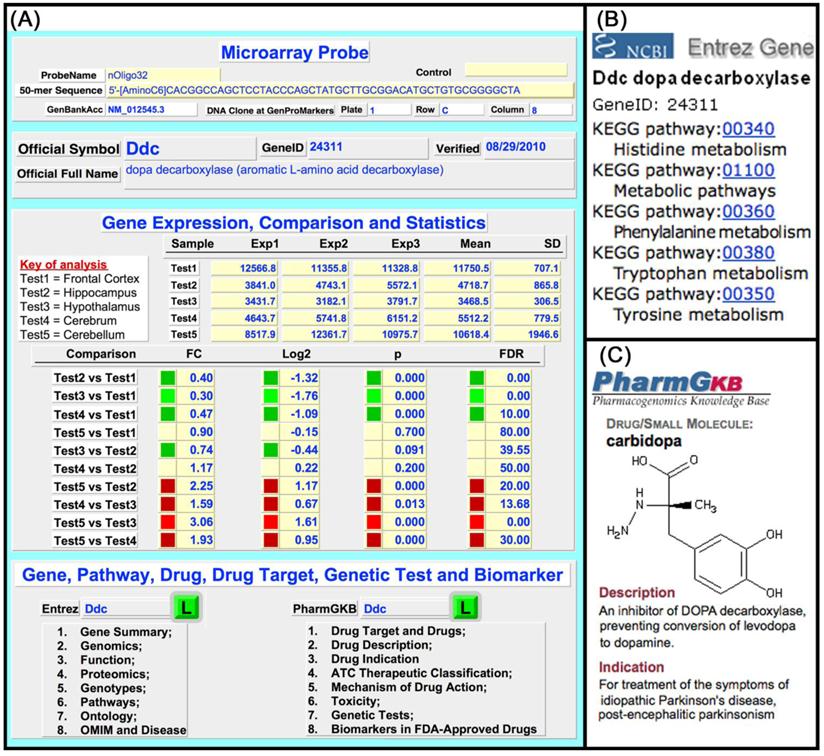
The rMNChip database was built to expedite data analysis and interpretation of results. Figure 3A shows a user interface of the rMNChip database; Figure 3B and 3C show the linked canonical pathway and drug webpages viewable by clicking the Entrez “L” or the PharmGKB “L” on the user interface. The user-interface allows importing, searching, browsing, comparing, displaying, and exporting of (i) genes of interest, with the associated expression changes and canonical pathways, (ii) expression changes of interest, with the associated genes and canonical pathways, and (iii) canonical pathways of interest, with the associated genes and expression results. Pre-linked with the NCBI Entrez gene database and the PharmGKB drug database is for conveniently updating gene information.
rMNChip database compiled in FileMaker Pro including individual expression files, gene information files and a relational expression file. Individual expression files keep raw microarray data imported from a microarray image and is linked with the relational expression file via index (a unique numerical ID to each spot on rMNChip). A gene information file keeps gene biological information, for example, canonical pathways and drug targets of genes. A relational expression file contains information on probes, array design, expression data and comparison, gene symbols and full names, and direct-links with the NCBI Entrez Gene Ontology and the PharmaGKB drugs and drug targets as indicated here. (A) A user-interface of relational gene information file displaying microarray probes, gene ID, official gene symbols and full names, gene expression comparisons and statistics, pathways, drugs and drug targets, as well as direct-links via gene IDs to the NCBI Entrez Gene website and the PharmaGKB for instantly checking or updating information. (B) An example of linking of dopa decarboxilase (Ddc) to the NCBI Entrez Gene KEGG pathways. (C) An example of linking of Ddc to the PharmGKB drugs. The rMNChip databases allow searching, browsing, displaying, modifying, updating and exporting information.
Differential signal-transduction-bioenergenesis and neurotransmitter-synthesis pathways
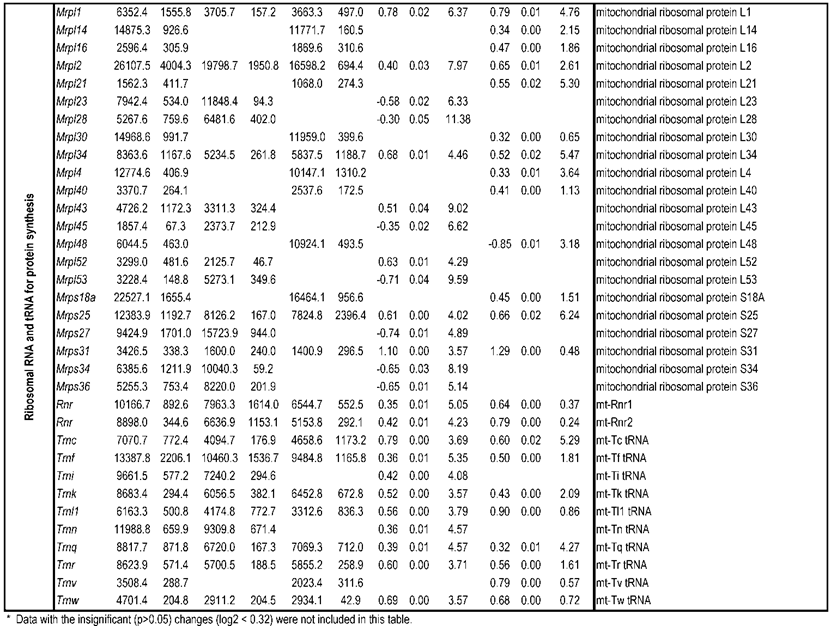
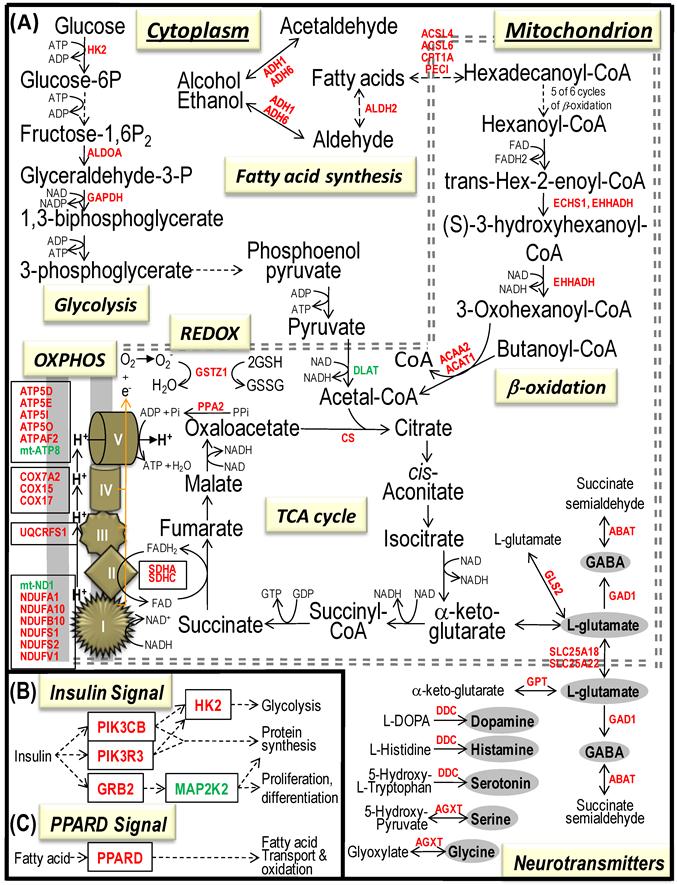
To identify differential pathways, we browse the regulatory (signal transduction), carbohydrate and fatty acid metabolisms, TCA cycle, OXPHOS, REDOX, protein and neurotransmitter synthesis pathways together with the associated genes within the rMNChip database. Our results showed the pathways including glycolysis/gluconeogenesis (ADH1, ADH6, ALDH2, ALDO, DLAT, GAPDH and HK2), the TCA cycle (CS,DLAT, FH1, IDH3A, IDH3G, OGDH, PDK2, SDHA, SDHB, SDHC and SUCLA2), fatty acid metabolism (ACAA2, ACAT1, ACSL3, ACSL4, ACSL6, ADH1, ADH6, ALDH2, CPT1A, ECHS1, EHHADH, PECI and SLC25A29,), OXPHOS (ATP5D, ATP5E, ATP5I, ATP5O, ATP6V1E1, ATPAF2, COX15, COX17, COX18, COX6C, COX7A2, MIPEP, mt-ATP8, mt-ND1, NDUFA1, NDUFA10, NDUFA4, NDUFAB1, NDUFAF1, NDUFB10, NDUFB4L1, NDUFS1, NDUFS2, NDUFV1, PPA2, SDHA, SDHB, SDHC and UQCRFS1), REDOX (GPX1, GSTZ1 and PRDX1), and neurotransmitter production and transport (ABAT, AGXT, CAD, DDC, GAD1, GLS2, GLUD1, GPT, SLC25A18 and SLC25A22). The regulatory pathways include insulin signaling (ELK1, GRB2, HK2, MAP2K2, MKNK1, PIK3CB, PIK3R3, PRKAR2A and PRKAR2B) and peroxisome proliferator-activated receptor delta (PPARD) signaling (ACSL3, ACSL4, ACSL6, APOA1, CPT1A, EHHADH, FABP3, FABP4, HMGCS2, PPARD, RXRA, SCP2 and SLC27A2). In protein synthesis pathways, 34 genes (MRPL1, MRPL14, MRPL16, MRPL2, MRPL21, MRPL23, MRPL28, MRPL30, MRPL34, MRPL4, MRPL40, MRPL43, MRPL45, MRPL48, MRPL52, MRPL53, MRPS18A, MRPS25, MRPS27, MRPS31, MRPS34, MRPS36, mt-RNR1, mt -RNR2, mt -TC, mt -TF, mt -TI, mt -TK, mt -TL1, mt -TN, mt -TQ, mt -TR, mt -TV and mt -TW) were expressed differentially among the frontal cortex, hippocampus, and hypothalamus (Table 2). The integrated map of these pathways revealed an overwhelming number of the genes that were expressed significantly higher in the frontal cortex than in either the hippocampus (55 vs. 6, Fig. 4) or the hypothalamus (55 vs. 4, Fig. 5).
Pathways and Differentially Expressed Genes between Frontal Cortex and Hippocampus and between Frontal Cortex and Hypothalamus*
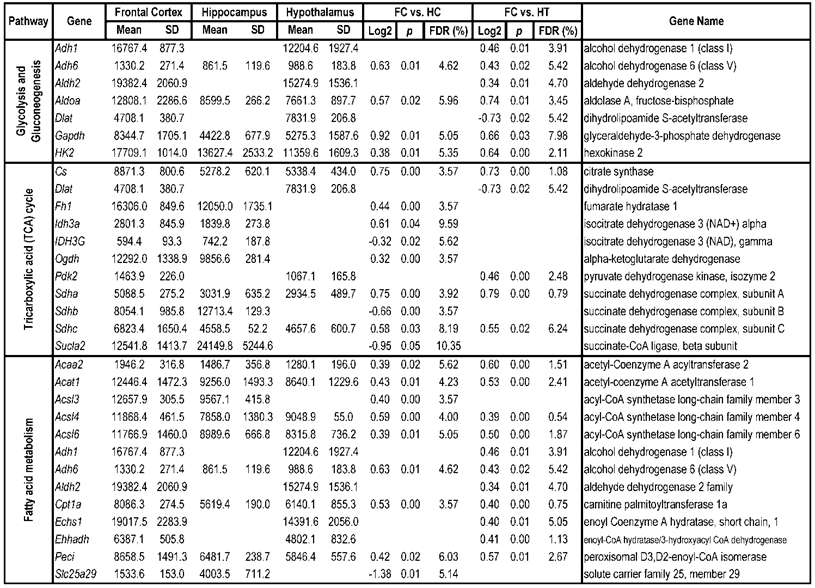

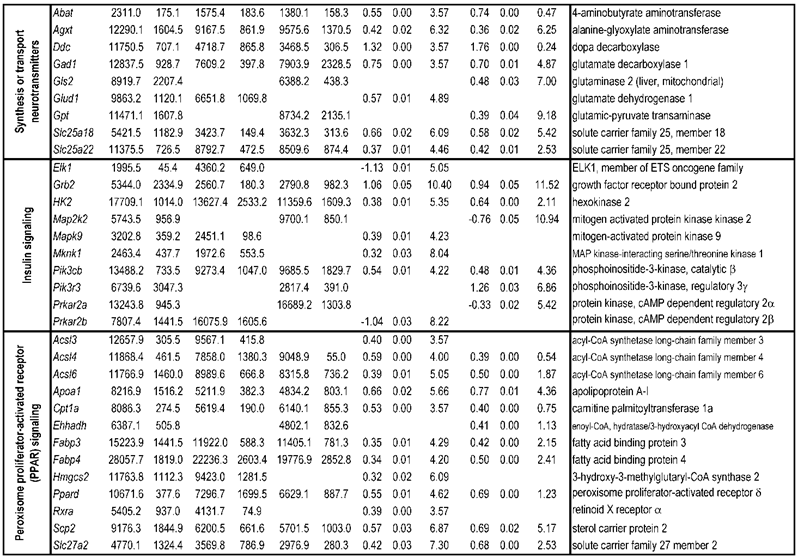
Bioenergenesis neurotransmitter pathways with differentially expressed genes between frontal cortex and hippocampus. A solid line with arrowhead indicates a direct reaction or transport. A dashed line with arrowhead indicates more than one steps involved in passages. The RNA levels of genes in red or green colors were expressed significantly higher or lower in the frontal cortex than in hippocampus, respectively. If the changes in RNA levels were not significant (p>0.05) or less than 1.25-fold, the gene symbols or enzymes are not shown in the flow chat. The mean expression levels, standard deviations, fold changes, p-values, false discovery rate (FDR) and the full name of genes are listed in Table 2. (A) Bioenergenesis neurotransmitter pathways include glycolysis, fatty acid synthesis, and neurotransmitter synthesis in cytoplasm and β-oxidation, TCA cycle and OXPHOS, REDOX, and neurotransmitter synthesis in mitochondria. Double dashed lines represent the inner and outer mitochondrial membranes, of which a portion was enlarged to illustrate OXPHOS complexes I, II, III, IV and V with differentially expressed genes in each complex. A proton (H+) flow and ATP synthesis are indicated. REDOX enzymes (GPX1, GSTZ1 and PRDX1) are involved in removal of ROS (e.g. O2-). Mitochondrial and cytoplasmic enzymes with RNA levels higher in the frontal cortex than in hippocampus for synthesis of neurotransmitters (gray ovals) include Glud1 for synthesis of the most abundant excitatory neurotransmitter L-glutamate, GAD1 and ABAT for the most abundant inhibitory neurotransmitter γ-aminobutyric acid [GABA], DDC for dopamine, histamine and serotonin, and AGXT for serine and glycine. SLC25A18 and SLC25A22 are involved in transport of L-glutamate across mitochondrial membranes. (B) Insulin signaling pathway. Insulin binding to its receptor results in the tyrosine phosphorylation of insulin receptor substrates. This leads to activation of phosphoinositide-3-kinase (PIK3CB) and growth factor receptor-bound protein (GRB2). These in turn lead to upregulation of insulin-responsive genes including hexokinase 2 (HK2) and MAP kinase interacting serine/threonine kinase 1 (MKNK1). HK2 at the outer mitochondrial membrane phosphorylates glucose into glucose-6-phosphate, the first rate-limiting step of glycolysis pathway. MKNK1 in cytoplasm phosphorylates the eukaryotic translation initiation factor (EEIF4E) initiating protein synthesis, of which 18 of 25 genes displayed RNA levels higher in the frontal cortex than in hippocampus (Table 2). MKNK1 also modifies proteins posttranslationally. ELK1 member of ETS oncogene family (ELK1) plays a critical role in mitogen growth factor signal transduction, and its downregulation suggests decreased activities in proliferation and differentiation. (C) PPARD signaling pathway. Peroxisome proliferator-activated receptor delta (PPARD) is a nuclear hormone receptor and transcriptional regulator. Retinoid X receptor alpha (RXRA) is a steroid and thyroid hormone receptor and transcriptional regulator. Both PPARD and RXRA are involved in fatty acid transport and oxidation via binding to DNA and regulating transcription.
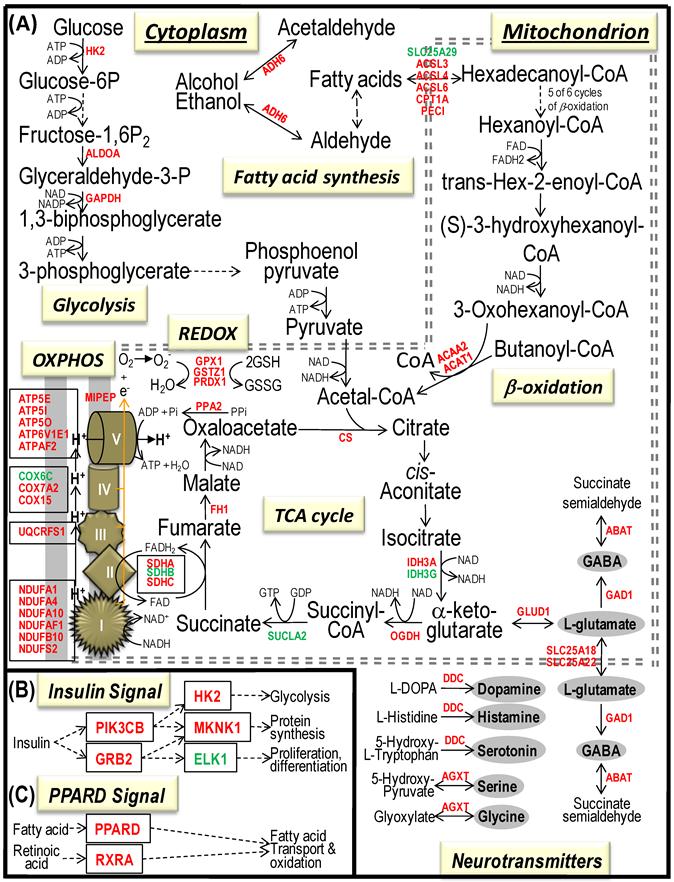
Bioenergenesis neurotransmitter pathways with differentially expressed genes between frontal cortex and hypothalamus. A solid line with arrowhead indicates a direct reaction or transport. A dashed line with arrowhead indicates more than one steps involved in passages. The RNA levels of genes in red or green colors were expressed significantly higher or lower in the frontal cortex than in hypothalamus, respectively. If the changes in RNA levels were not significant (p>0.05) or less than 1.25-fold, the gene symbols or enzymes are not shown in the flow chat. The mean expression levels, standard deviations, fold changes, p-values, false discovery rate (FDR) and the full name of genes are listed in Table 2. (A) Bioenergenesis neurotransmitter pathways include glycolysis, fatty acid synthesis, and neurotransmitter synthesis in cytoplasm and β-oxidation, TCA cycle and OXPHOS, REDOX, and neurotransmitter synthesis in mitochondria. Double dashed lines represent the inner and outer mitochondrial membranes, of which a portion was enlarged to illustrate OXPHOS complexes I, II, III, IV and V with differentially expressed genes in each complex. A proton (H+) flow and ATP synthesis are indicated. REDOX enzyme (GSTZ1) is involved in removal of ROS (e.g. O2-). Mitochondrial and cytoplasmic enzymes with the RNA levels higher in the frontal cortex than in hypothalamus for synthesis of neurotransmitters (gray ovals) include GLS2 and GPT for synthesis of the most abundant excitatory neurotransmitter L-glutamate, GAD1 and ABAT for the most abundant inhibitory neurotransmitter γ-aminobutyric acid [GABA], DDC for dopamine, histamine and serotonin, and AGXT for serine and glycine. SLC25A18 and SLC25A22 are involved in transport of L-glutamate across mitochondrial membranes. (B) Insulin signaling pathway. Insulin binding to its receptor results in the tyrosine phosphorylation of insulin receptor substrates. This leads to activation of phosphoinositide-3-kinase (PIK3CB and PIK3R3) and growth factor receptor-bound protein (GRB2). The activated PIK3CB and PIK3R3 lead to upregulation insulin-responsive genes including hexokinase 2 (HK2). HK2 localizes to the outer mitochondrial membrane and phosphorylates glucose into glucose-6-phosphate, the first rate-limiting step of glycolysis pathway. PIK3CB and PIK3R3 also activate protein synthesis, of which 22 of 23 genes displayed RNA levels higher in the frontal cortex than in hypothalamus (Table 1). Mitogen-activated protein kinase kinase (MAP2K2) plays a critical role in mitogen growth factor signal transduction, and its downregulation suggests decreased activities in transferring the GRB2 signal for proliferation and differentiation. (C) PPARD signaling pathway. Peroxisome proliferator-activated receptor delta (PPARD) is a nuclear hormone receptor and transcriptional regulator and is involved in fatty acid transport and oxidation via binding to DNA and regulating transcription.
DISCUSSION
Microarray and bioinformatics analysis of the entire mitochondrial transcriptomes is of importance in the systems-biological study of mitochondrial functions, especially, of the brain because of its high demand for energy. High level production of ATP in brain neurons requires accurate regulation of bioenergenesis pathways to maintain physiological homeostasis including appropriate disposal of ROS. Otherwise, overproduction of ROS (oxidative stress) as inevitable byproducts of the highly active ATP synthesis may become an endogenous pathogenic or toxic factor damaging neuron function and survival, a characteristics of neurodegenerative diseases[22;23]. Previously, our laboratory and other groups have developed human and mouse mitochondria-focused microarrays and bioinformatics tools for expression profiling, including hMitChip2[24], hMitChip3[15], h-MitoArray[25], HuMOTIchip[26], and mouse MitoChips[27;28]. These customized gene chips and bioinformatics tools facilitated hypothesis-driven studies of human diseases such as glucocorticoid-induced transcriptional adaptations and MAO-A-mediated oxidative stress[29], proliferation rates of human malignant melanoma (MM) cells [15], molecular mechanisms underlying survival-apoptosis of human MM cells[30], expression profiles of survival-apoptosis genes in human MM[31], candidate biomarkers in postmortem brain tissues of patients with posttraumatic stress disorder (PTSD)[3], ANT1-mediated regulation of mouse oxidative phosphorylation, antioxidant, and apoptotic genes [28], and mouse mitochondrial involvement in drug-induced toxicities[27]. rMNChip reported here is, to our knowledge, the first customized mitochondrion-neuron focused microarray with its integrated bioinformatics tools for the systems-biological study of neurodegeneration in rat models.
Unlike other mitochondrial microarrays[32], rMNChip was designed specifically for study of neurodegenerative diseases. First, rMNChip contains 1,135 rat genes homologous to all the known human mitochondrial genes[15] and 365 genes relevant to stress response, circadian rhythms and signal transduction. Second, the rMNChip algorithms reduce non-random variance. Third, as a focused microarray, rMNChip is particularly useful for hypothesis-driven experiments. Most importantly, the rMNChip software greatly simplifies microarray data analysis and allows rapid identification of differential pathways rather than only a list of the differentially expressed genes, offering straightforward and intuitive interpretation for microarray results. Moreover, the pros and cons of a customized gene chip versus a generic gene chip with whole transcriptomes of a species are described previously[15]. It is also worth mentioning that, in contrast to a generic gene chips with whole transcriptomes, the reduction of the number of genes makes rMNChip affordable for routinely carrying out microarray experiments with technical triplicates, experimental triplicates and biological repeats (statistical power). These assure the generation of reproducible and verifiable microarray results[3;15;30;31;33-35]. Finally, the pre-link to the web-based databases allows instant update of the pathway and pharmacogenomics information.
The high quality and consistent microarray results of rMNChip were achieved by (i) using the established criteria for design of 50-mer oligonucleotide DNA probes, (ii) attaching the amino-C6 motif to the 5'-end of each probe, (iii) printing 5'-amino-C6 modified 50-mer probes on glass slides in the Class 100 super-clean environment, (iv) covalently linking probes via 5'-amino groups to the N-hydroxysuccinimide ester reactive groups coated on the glass slides which allow flexible probes to access to and hybridization with target DNA sequences, and (v) blocking the remaining reactive groups on the glass slides to reduce background. The high quality rMNChip was demonstrated by consistent microarray images and statistical analysis.
Our results revealed 356 differentially expressed genes (DEGs) between the frontal cortex and hippocampus (Supplementary Material: Table S2), 343 DEGs between the frontal cortex and hypothalamus (Supplementary Material: Table S3), but only 68 DEGs between the hippocampus and hypothalamus (Supplementary Material: Table S4). These findings indicate that the molecular differences between the frontal cortex with either hippocampus or hypothalamus were greater than those between hippocampus and hypothalamus. The greater differences also imply more active molecular and cellular functions of the frontal cortex than the other two. Supporting this view, the number of upregulated genes in the frontal cortex is much greater than that of downregulated genes when compared with either hippocampus (FC vs. HC = 310 vs. 46) or hypothalamus (FC vs. HT = 315 vs. 28). These results strongly suggest higher transcriptional activities in the frontal cortex than the other two brain regions. Although one might expect that 50% DEGs would be upregulated while the other 50% would be downregulated, this statistical expectation ought to be carefully evaluated in relationship to biological systems under study and to a total number of genes in measurement. In addition, it is worth mentioning that the changes of many DEGs in these comparisons were less than 2 fold (log2-ratio of +/- 1). Our confidence on the resultant DEGs would have been decreased if without technical triplicates and experimental triplicates for the measurement of each and every gene on the rMNChip microarrays.
Our application of the rMNChip and bioinformatic tools led to rapid identification of the differentially expressed regulation (signal transduction), metabolism, bioenergenesis and neurotransmitter biosynthesis pathways in rat brain tissues. These pathways contain an overwhelming number of the genes that were expressed significantly higher in the frontal cortex than in either the hippocampus (55 vs. 6 genes) or the hypothalamus (86 vs. 4). The results strongly suggest that the production of ATP, removal of ROS, and synthesis and transport of the excitatory and inhibitory neurotransmitters are more efficient in the frontal cortex than in the other two. The facts that the neurotransmitter genes (L-glutamate, GABA, dopamine, serotonin, histamine, serine and glycine) were expressed significantly higher in the frontal cortex than in the hippocampus or hypothalamus and that these neurotransmitters are known to be involved in learning, memory, attention, and problem-solving, mood, appetite and sleep[36-41] implies highly active neuronal functions in the frontal cortex. These findings are exciting and we begin to believe that the different brain regions at the different developmental stages under the different body-and-mind activities may require the different amount of ATP and fire the different amount and types of neurotransmitters. Thus, rMNChip and software are useful for rapid identification of differential pathways and facilitate our systems-biological study and understanding of molecular mechanisms underlying complex and multifactorial neurodegenerative diseases.
Supplementary Material
Table S1. 1,500 rMitChip Genes and Probe Sequences. Table S2. 356 Differentially Expressed Genes between Frontal Cortex (FC) and Hippocampus (HC). Table S3. 343 Differentially Expressed Genes between Frontal Cortex (FC) and Hypothalamus (HT). Table S4. 68 Differentially Expressed Genes between Hippocampus (HC) and Hypothalamus (HT).
Acknowledgements
This work was supported by the U.S. Army Medical Research and Materiel Command grant W81XWH-08-2-0568. Y.A.S., Q.Z., and M.X.T. were supported partially by the grant W81XWH-08-2-0568 and partially by GenProMarkers Inc. D.M.S. was supported by Department of Gene and Protein Biomarkers, GenProMarkers Inc.
Competing Interests
Authors state that there is no competing conflict of interests related to this publication.
References
1. Zhang L, Zhou R, Li X, Ursano RJ, Li H. Stress-induced change of mitochondria membrane potential regulated by genomic and non-genomic GR signaling: a possible mechanism for hippocampus atrophy in PTSD. Med Hypotheses. 2006;66(6):1205-8
2. Manoli I, Alesci S, Blackman MR, Su YA, Rennert OM, Chrousos GP. Mitochondria as key components of the stress response. Trends Endocrinol Metab. 2007Jul;18(5):190-8
3. Su YA, Wu J, Zhang L, Zhang Q, Su DM, He P. et al. Dysregulated mitochondrial genes and networks with drug targets in postmortem brain of patients with posttraumatic stress disorder (PTSD) revealed by human mitochondria-focused cDNA microarrays. Int J Biol Sci. 2008;4(4):223-35
4. Scheffler IE. A century of mitochondrial research: achievements and perspectives. Mitochondrion. 2001Jun;1(1):3-31
5. McBride HM, Neuspiel M, Wasiak S. Mitochondria: more than just a powerhouse. Curr Biol. 2006Jul25;16(14):R551-R560
6. Margulis L. Archaeal-eubacterial mergers in the origin of Eukarya: phylogenetic classification of life. Proc Natl Acad Sci U S A. 1996Feb6;93(3):1071-6
7. Clayton DA. Replication and transcription of vertebrate mitochondrial DNA. Annu Rev Cell Biol. 1991;7:453-78
8. Graff C, Clayton DA, Larsson NG. Mitochondrial medicine--recent advances. J Intern Med. 1999Jul;246(1):11-23
9. Chinnery PF. Searching for nuclear-mitochondrial genes. Trends Genet. 2003Feb;19(2):60-2
10. Zeviani M, Corona P, Nijtmans L, Tiranti V. Nuclear gene defects in mitochondrial disorders. Ital J Neurol Sci. 1999Dec;20(6):401-8
11. Leonard JV, Schapira AH. Mitochondrial respiratory chain disorders I: mitochondrial DNA defects. Lancet. 2000;355(9200):299-304
12. Enns GM. The contribution of mitochondria to common disorders. Mol Genet Metab. 2003Sep;80(1-2):11-26
13. Wallace DC. A mitochondrial paradigm of metabolic and degenerative diseases, aging, and cancer: a dawn for evolutionary medicine. Annu Rev Genet. 2005;39:359-407
14. Wang BD, Rennert OM, Su YA. Mitochondrial oxidative phosphorylation, obesity and diabetes. Cells Science Reviews. 2008;4(4):57-81
15. Bai X, Wu J, Zhang Q, Alesci S, Manoli I, Blackman MR. et al. Third-generation human mitochondria-focused cDNA microarray and its bioinformatic tools for analysis of gene expression. Biotechniques. 2007Mar;42(3):365-75
16. He Z, Wu L, Li X, Fields MW, Zhou J. Empirical establishment of oligonucleotide probe design criteria. Appl Environ Microbiol. 2005Jul;71(7):3753-60
17. Su YA, Bittner ML, Chen Y, Tao L, Jiang Y, Zhang Y. et al. Identification of tumor-suppressor genes using human melanoma cell lines UACC903, UACC903(+6), and SRS3 by comparison of expression profiles. Mol Carcinog. 2000Jun;28(2):119-27
18. Su YA, Trent JM. Isolation of tumor suppressor genes in melanoma by cDNA microarray. Nickoloff BJ, editor. Methods in Molecular Medicine.Totowa. NJ: The Human Press Inc. 2001:15-29
19. Benjamini Y, Hochberg Y. Controlling the False Discovery Rate - A Practical and Powerful Approach to Multiple Testing. Journal of the Royal Statistical Society Series B-Methodological. 1995;57(1):289-300
20. Hartemink AJ, Gifford DK, Jaakkola TS, Young RA. Maximum-likelihood estimation of optimal scaling factors for expression array mormalization. In: (ed.) Bittner M. et al. Microarrays: Optical Technologies and Informatics. San Jose, California: Proc SPIE. 2001:132-40
21. Bolstad BM, Irizarry RA, Astrand M, Speed TP. A comparison of normalization methods for high density oligonucleotide array data based on variance and bias. Bioinformatics. 2003;19(2):185-93
22. Lin MT, Beal MF. Mitochondrial dysfunction and oxidative stress in neurodegenerative diseases. Nature. 2006Oct19;443(7113):787-95
23. DiMauro S, Schon EA. Mitochondrial disorders in the nervous system. Annu Rev Neurosci. 2008;31:91-123
24. Alesci S, Manoli I, Michopoulos VJ, Brouwers FM, Le H, Gold PW. et al. Development of a human mitochondria-focused cDNA microarray (hMitChip) and validation in skeletal muscle cells: implications for pharmaco- and mitogenomics. Pharmacogenomics J. 2006Sep;6(5):333-42
25. Cizkova A, Stranecky V, Ivanek R, Hartmannova H, Noskova L, Piherova L. et al. Development of a human mitochondrial oligonucleotide microarray (h-MitoArray) and gene expression analysis of fibroblast cell lines from 13 patients with isolated F1Fo ATP synthase deficiency. BMC Genomics. 2008;9:38
26. Voss JG, Raju R, Logun C, Danner RL, Munson PJ, Rangel Z. et al. A focused microarray to study human mitochondrial and nuclear gene expression. Biol Res Nurs. 2008Apr;9(4):272-9
27. Desai VG, Lee T, Delongchamp RR, Moland CL, Branham WS, Fuscoe JC. et al. Development of mitochondria-specific mouse oligonucleotide microarray and validation of data by real-time PCR. Mitochondrion. 2007Sep;7(5):322-9
28. Subramaniam V, Golik P, Murdock DG, Levy S, Kerstann KW, Coskun PE. et al. MITOCHIP assessment of differential gene expression in the skeletal muscle of Ant1 knockout mice: coordinate regulation of OXPHOS, antioxidant, and apoptotic genes. Biochim Biophys Acta. 2008Jul;1777(7-8):666-75
29. Manoli I, Le H, Alesci S, McFann KK, Su YA, Kino T. et al. Monoamine oxidase-A is a major target gene for glucocorticoids in human skeletal muscle cells. FASEB J. 2005Aug;19(10):1359-61
30. Zhang Q, Wu J, Nguyen A, Wang BD, He P, Laurent GS. et al. Molecular mechanism underlying differential apoptosis between human melanoma cell lines UACC903 and UACC903(+6) revealed by mitochondria-focused cDNA microarrays. Apoptosis. 2008Aug;13(8):993-1004
31. Su DM, Zhang Q, Wang X, He P, Zhu YJ, Zhao J. et al. Two types of human malignant melanoma cell lines revealed by expression patterns of mitochondrial and survival-apoptosis genes: implications for malignant melanoma therapy. Mol Cancer Ther. 2009 Epub
32. Johnston DS, Su YA, Alesci S. Mitochondrial gene profiling: translational perspectives. Pharmacogenomics. 2009Oct;10(10):1645-55
33. Su YA, Li H, He P, Webster MJ, Zhang Q, Zhang L. et al. Identification of stress-responsive genes, canonical pathways, molecular networks and drug targets in brain tissues of human and animals for systems-biology study of post-traumatic stress disorder. The DOD Congressionally Directed Medical Research Programs, the third Military Health Research Forum (MHRF), Hallmark Crown Center, Kansas City, Missouri.August 31 - September 3. 2009
34. Hsiao YH, Su YA, Tsai HD, Mason JT, Chou MC, Man YG. Increased invasiveness and aggressiveness in breast epithelia with cytoplasmic p63 expression. Int J Biol Sci. 2010;6(5):428-42
35. Su YA, Yang J, Tao L, Nguyen H, He P. Undetectable and Decreased Expression of KIAA1949 (Phostensin) Encoded on Chromosome 6p21.33 in Human Breast Cancers Revealed by Transcriptome Analysis. J Cancer. 2010;1:38-50
36. McEntee WJ, Crook TH. Glutamate: its role in learning, memory, and the aging brain. Psychopharmacology (Berl). 1993;111(4):391-401
37. Watanabe M, Maemura K, Kanbara K, Tamayama T, Hayasaki H. GABA and GABA receptors in the central nervous system and other organs. Int Rev Cytol. 2002;213:1-47
38. Heijtz RD, Kolb B, Forssberg H. Motor inhibitory role of dopamine D1 receptors: implications for ADHD. Physiol Behav. 2007Sep10;92(1-2):155-60
39. Browman KE, Curzon P, Pan JB, Molesky AL, Komater VA, Decker MW. et al. A-412997, a selective dopamine D4 agonist, improves cognitive performance in rats. Pharmacol Biochem Behav. 2005Sep;82(1):148-55
40. Mohammad-Zadeh LF, Moses L, Gwaltney-Brant SM. Serotonin: a review. J Vet Pharmacol Ther. 2008Jun;31(3):187-99
41. Berger M, Gray JA, Roth BL. The expanded biology of serotonin. Annu Rev Med. 2009;60:355-66
Author contact
![]() Corresponding author: Yan A. Su, M.D., Ph.D., GenProMarkers Inc., 9700 Great Seneca Highway, Suite 182, Rockville, Maryland 20850. Phone: (301) 326-6523; Email:gpmyascom
Corresponding author: Yan A. Su, M.D., Ph.D., GenProMarkers Inc., 9700 Great Seneca Highway, Suite 182, Rockville, Maryland 20850. Phone: (301) 326-6523; Email:gpmyascom