10
Impact Factor
ISSN: 1449-2288
Int J Biol Sci 2011; 7(8):1188-1202. doi:10.7150/ijbs.7.1188 This issue Cite
Research Paper
Glatiramer Acetate Treatment Increases Stability of Spinal Synapses and Down Regulates MHC I during the Course of EAE
1. Department of Anatomy, Cell Biology, Physiology and Biophysics - Institute of Biology, University of Campinas (UNICAMP) Campinas, SP, Brazil.
2. Departament of Morphology - Human Anatomy section, UFU - campus Umuarama, Brazil.
Received 2011-6-29; Accepted 2011-9-29; Published 2011-10-27
Abstract
The recent discovery that the major histocompatibility complex of class I (MHC I) expression has a role in the synaptic elimination process, represented an insight into understanding the cross talk between neurons. In the present study, the possibility that glatiramer acetate (GA) treatment influences the MHC class I expression and the synaptic plasticity process in the spinal cord during the course of EAE was investigated. C57BL/6J mice were induced to EAE and submitted to treatment either with a placebo solution or with GA (0.05mg/animal, subcutaneously, on a daily basis). All the animals were sacrificed at the peak disease (14 days after induction) or at the point of recovery of the clinical signs (21 days after induction). The spinal cords were removed and submitted to immunohistochemical examination, Western blotting and transmission electron microscopy analysis. The results showed that GA treatment was able to decrease synaptic loss during the course of EAE, which correlates with the downregulation of the MHC I complex. The present results reinforce the neuroprotective role of GA treatment, by reducing synaptic loss during the course of the disease. Such action may be associated with the recently described role of MHC I regulation during the synaptic plasticity process.
Keywords: EAE, MHC class I, spinal cord, motoneuron, immunomodulator, glatiramer acetate.
Introduction
Spinal motoneurons represent the final motor pathway connecting the central nervous system to the muscle. Their cell bodies are located in the CNS territory and possess numerous dendrites that extend for several micrometers within the lamina IX. Dendrites receive a massive number of inputs which are finely selected during development and maintained throughout the life span. The cell bodies also receive a number of inputs, which are thought to have major influence on deflagration of the action potential [1].
Although the morphological features and architecture of the spinal cord have been well known for several decades, how the organization of so many synapses is achieved and maintained throughout adulthood, and how motoneurons select the inputs that should be kept or eliminated under different situations is still obscure [2].
The new discovery that the major histocompatibility complex of class I (MHC I) expression in neurons and glial cells has a novel function in the CNS, represented an insight into understanding of the cross talk between neurons and glial cells. It is known that MHC I expression by neurons is not only important during development but also after lesion and during the course of neurological diseases. It has also been shown to influence the establishment of neuromuscular junctions, so that knock out mice that were unable to express MHC I molecules displayed morphological and functional alterations [3, 4].
A recent study has shown that MHC class I is expressed in axons and presynaptic terminals at skeletal neuromuscular junction level, especially in spinal cord motor neurons. Such expression is higher after axonal lesion in the peripheral nerve. In contrast, the absence of MHC I lead to a disturbed organization in neuromuscular junctions, suggesting that MHC I effects could be mediated by Schwann cells, which present receptors to MHC I [5].
Although the synaptic elimination in the spinal cord after lesion is possibly driven by motoneurons, astrocytes and microglia are also involved, both because of the intimate contact they have with the motoneuron membrane surface and because they are able to express both MHC I and possible ligants to such complexes [6].
Another recent study investigated the hypothesis that synaptic elimination after sciatic nerve axotomy was also dependant on the MHC I expression [7]. In this sense, beta-2 microglobulin (a co-subunit of the MHC class I complex) deficient mice were subjected to unilateral sciatic nerve crush or transection. As a result, the beta-2 microglobulin deficient animals showed greater synaptic elimination, and an ultrastructural analysis showed that the inhibitory synaptic terminals were the most compromised, since non mutant axotomized animals showed a smaller reduction in inhibitory terminals. Another study on the regenerative capacity and MHC I expression performed with different mice strains showed that C57BL6/J mice naturally expressed reduced amounts of MHC I and had a lower regenerative potential and lower percentage of synaptic detachment after nerve injury as compared to A/J mice, which expressed higher amounts of MHC I and had an increased regenerative capacity coupled with a greater rate of synaptic retraction post axotomy [8].
The concept that MHC I is relevant to synaptic plasticity after lesion was also strengthened by upregulating its expression after lesion and treatment with interferon beta, which is a cytokine used to treat the remittent/recurrent form of Multiple Sclerosis (MS), an inflammatory/neurodegenerative disease that affects the central nervous system (CNS) [9-11]. Experimental autoimmune encephalomyelitis (EAE) is an animal model for (MS) and can be induced in monkeys, pigs, rats or mice. Also these models reproduce the same mechanisms of demyelination and axonal injury [12-14]. The disease can develop in a monophasic form, with an acute paralysis episode (onset), followed by complete recovery, or present relapsing/remitting episodes which involve multiple cycles of inflammation with partial recovery between exacerbations [13]. EAE induction in C57BL/6 mice with myelin oligodendrocyte glycoprotein (MOG35-55) has been studied for several years, and it has been shown that induced animals present territories with mononuclear infiltrates in the white matter of the spinal cord, associated with local demyelination [14]. CD4 T cell activation is the major factor for EAE induction, which is worsened by macrophage and microglia activation, resulting in tissue destruction and demyelination [15, 16]. The Inflammation and demyelination are reduced when mice recover from the clinical signs and are therefore beginning to solve the histopathological changes [17].
In addition to interferon beta, another substance that has been used with success to control the evolution of relapsing-remitting MS is glatiramer acetate (GA, Copaxone), which is an immunomodulatory drug composed of a synthetic polypeptide mixture with a 4 amino acid sequence - L-Glutamic acid, L-lysine, L-alanine and L-tyrosine [18-20]. Although its action mechanism is still not fully understood, two possible pathways may account for the drug effectiveness. One indicates that GA promotes immunoregulatory Th2 cell activation, driving the immune response to an anti-inflammatory response. Also, it has been shown that Th2 cells secrete important neurotrophins for neural survival and axonal protection. In the second, GA may stimulate immune cells of local glial cells to secrete neurotrophins in the CNS territory. This may promote neuronal network repair and increase cell survival [21, 22]. In this sense, Marques et al. [21] showed that the GA treatment in Lewis rats subjected to EAE led to synaptic input preservation in the spinal cord during the onset of the disease and in the remission phase. Such effects were coupled with a decrease in the seriousness of the disease, indicating that synaptic network preservation may contribute to a reduction in the clinical signs of the disease.
Taking into account that GA immunomodulates different levels of the immune response and that the first level of activity is on the MHC complex, it is possible that its action also influences the neuronal response to injury by competing with other ligants, possibly provided by pre-synaptic neurons and/or glial cells. GA may also indirectly influence the synaptic plasticity process by driving the immune response to an anti-inflammatory profile, contrary to what happens after lesion or during the course of EAE.
In the present study evidence is presented that GA can influence the MHC class I expression and the synaptic plasticity process in the spinal cord during the course of remittent/recurrent EAE. Such changes, induced by GA treatment, involve neurons and glia and are possibly related to a downregulation of the MHC I expression in the spinal cord microenvironment.
Material and Methods
Animals
Seventy adult female C57Bl/6 mice (6-8 weeks old, ~ 25g body weight) were obtained from the Multidisciplinary Center for Biological Investigation of the University of Campinas / SP - Brazil (CEMIB ⁄ UNICAMP) and housed under a 12h light ⁄dark cycle with free access to food and water. The study was approved by the Institutional Committee for Ethics in Animal Experimentation (CEEA/ IB/ UNICAMP, proc. 1316-1) and the experiments were performed in accordance with the guidelines of the Brazilian College for Animal Experimentation.
The mice were allocated into three groups and each group was divided into two subgroups. The first group of mice (n= 30) was submitted to EAE, treated with placebo (n=15) or treated with GA (n=15) and sacrificed when presenting paraplegia (grade 3); whereas the second group of mice (n= 30) was also treated with placebo (n=15) and treated with GA (n=15), but was sacrificed when the clinical signs decreased (~21 days) after the peak of the EAE (remission phase). A third group of mice (n=10) was used as the normal control and were not subjected to any experimental procedure. In all cases, after being sacrificed, the spinal cords were processed either for an immunohistochemical examination, Western Blotting or for an ultrastructural analysis (n=5 for each group).
Induction of experimental autoimmune encephalomyelitis and GA treatment
All reagents were obtained from Sigma-Aldrich (St Louis, MO, USA) except for those specifically mentioned. The mice were immunized with a single injection of 100 µl of myelin oligodendrocyte glycoprotein (MOG35-55) associated with heat-inactivated Mycobacterium tuberculosis H37RA (1.5 mg/mL; Difco Laboratories, Detroit, MI, USA) and complete Freund's adjuvant emulsion. This solution was injected subcutaneously into the base of the tail. Two Bortetella pertussis injections were then administered; one after the MOG injection and the second, 48 hours later. The treatment with GA (0.05mg/animal; batch n° 334190, Teva, Israel) or placebo solution was started 30 minutes after induction and was carried out subcutaneously on a daily basis. A daily analysis of the signs and symptoms of EAE severity was determined as follows: grade 0, no clinical signs; grade 1, tail weakness or paralysis; grade 2, hind limb paraparesis; grade 3, hind limb paralysis; grade 4, complete paralysis (tetraplegy). The animals were sacrificed 14 days after induction (exacerbation/onset group) and 21 days after induction (remission group).
Specimen preparation
The animals were anesthetized with a mixture of Kensol (xylazine) and Vetaset (ketamine) and the vascular system rinsed by transcardial perfusion with phosphate buffer (pH 7.4). For the immunohistochemical detection of synaptophysin, glial fibrillary acidic protein (GFAP) and microglia (Iba1), the mice were fixed by vascular perfusion with 4% paraformaldehyde in phosphate buffer (pH 7.4).
The lumbar intumescences were then dissected out, post-fixed overnight, washed in phosphate buffer and stored in sucrose (20%) for 8h before freezing.
For Western Blotting the vascular system of the mice was rinsed by transcardial perfusion with phosphate buffer (pH 7.4) without the use of a fixative solution. The lumbar intumescences were dissected out and stored at -80°C.
For transmission electron microscopy, 100 ml of a fixative containing 2.5% glutaraldehyde and 0.5% paraformaldehyde in phosphate buffer (pH 7.4) were perfused through the ascending aorta, following the rinsing process described above. The lumbar spinal cords were removed and stored overnight in the same fixative at -4°C. The specimens were then trimmed and osmicated, dehydrated and embedded in Durcupan (Fluka, Steinheim, Switzerland). Ultra-thin sections from the L4-L6 segments were collected on formvar-coated copper grids, contrasted with uranyl acetate and lead citrate, and examined under a Leo906 (Zeiss, Germany) transmission electron microscope operated at 60 kV.
Immunohistochemistry
Transverse sections of the spinal cord (12 μm thick) were cut in a cryostat (Microm), transferred to gelatin coated slides and incubated with the following primary antibodies: rabbit anti-synaptophysin (Dako, 1:100), goat antiglial fibrillary acidic protein (Santa Cruz, 1:200) and rabbit anti- Iba1 (Wako, 1:700). The sections were incubated overnight in a moist chamber at 4°C. The primary antisera were diluted in a solution containing bovine serum albumin (3%) and Triton X (0.2%) in 0.1m phosphate-buffer (PB). After rinsing, the secondary antibodies were applied and incubated for 45 min, according to the host of the primary antibodies (CY-2 and CY-3, Jackson Immunoresearch, 1:250). The sections were then rinsed in PB, mounted in a mixture of glycerol ⁄ PB (3:1) and observed under a fluorescence microscope (TS-100, Nikon, Tokyo, Japan) equipped with a CCD camera (DMX1200, Nikon). For quantitative measurements, 3 representative images of synaptophysin, glial fibrillary acidic protein and Iba1 immunoreactivity, from alternate sections of the L5 ventral horn, were captured for each animal of all the experimental groups, totaling 15 sampled images for each group. Quantification was performed with the enhance contrast and density slicing feature of the IMAGEJ software (version 1.33u, National Institute of Health, USA). The integrated density of pixels was systematically measured in six representative areas of the lateral motor nucleus. The mean and SE were calculated for each group and a statistical analysis was performed.
Western blotting
For total MHC class I quantification, 3mm of the lumbar spinal cords were cut out. The specimens were then sonicated for 1min in Rippa protein extraction buffer (150mM NaCl, 50 mM Tris pH 8.0, 1mM PMSF, 1mM EDTA, 0.5% Na-deoxycholate acid, 0.1% SDS and 1% Triton X-100). The total protein concentration was measured using the Bio-Rad Bradford protein assay.
Western blotting was performed after the electrophoresis of 30 to 80μg protein of each tissue sample on a 10% polyacrylamide gel under reducing conditions, and electric transfer for nitrocellulose membranes (Hybond-ECL; Amersham Biosciences, Chalfont St. Giles, United Kingdom). The membranes were blocked for 1h with 1% or 5% non fat dry milk in TBS-T (Tris buffered saline plus 0.2% Tween 20) at room temperature with agitation. Rat anti-MHC class I (ER-HR52 monoclonal antibody, Peninsula, 1:500, diluted in 1% nonfat dry milk in TBS-T,) rabbit and anti-CD11b (BD Pharmingen, 1:1000, diluted in 1% nonfat dry milk in TBS-T) , rabbit anti-GFAP (polyclonal antibody, Dako, 1:2000, diluted in 1% non fat dry milk in TBS-T) and rabbit anti- Synaptophysin (monoclonal, Dako,1:200, diluted in 5% nonfat dry milk in TBS-T) were incubated overnight at 4°C. After the primary antisera, three TBS-T washes were carried out, and then HRP conjugated rabbit anti-rat IgG and goat anti-rabbit IgG (1:2500, in TBS-T, Zymed Laboratories, San Francisco, CA, USA) added for 1h at room temperature with agitation. After another set of washes, detection of bound antigen was achieved by chemiluminescence (Perkin-Elmer, Waltham, MA, USA). Band intensity was determined by densitometry using ImageJ Software (version 1.33u, National Institute of Health, USA). Load control blotting experiments were performed with beta-actin (polyclonal, 1:5000, Abcam, USA).
Analysis of the ultra-thin sections
Neurons with large cell bodies (> 35 μm in diameter) found in the sciatic motoneuron pool and cut in the nuclear plane, were identified as alpha motoneurons by the presence of C-type nerve terminals. The surface of the cells was then sequentially digitalized at a magnification of 12,930 and 21,000 with a video camera connected to a computerized system, using the acquisition feature of the kontron ks300 software (Zeiss). Synaptic terminals apposing the motoneuron somata were identified in the EAE animals treated with both placebo and GA.
Statistical analysis
The data were firstly subjected to descriptive statistics and presented normal distribution. Statistical differences between normal, placebo and GA treated groups were accessed by the one way ANOVA. Further intergroup comparisons were performed with Student's t test, assuming p<0.05 (*) and p<0.01 (**). The numerical results were presented as the mean ± se.
Results
Decreased MHC I expression after GA treatment in EAE induced mice
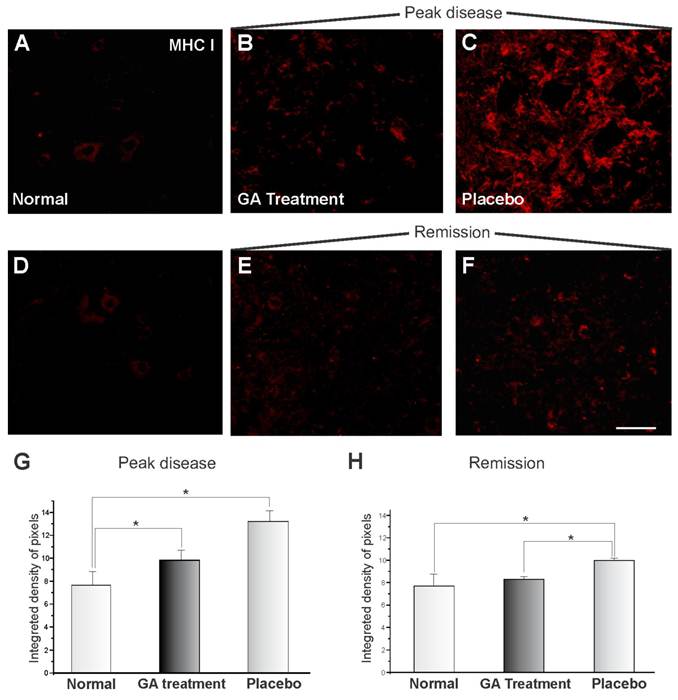
The MHC I expression of the animals submitted to EAE and treated with GA can be seen in Figure 1, showing immunoreactivity in the spinal cord motor ventral nuclei. Figures 1 A and D show the normal animals (control). The MHC I expression changed drastically during the onset of the disease after EAE induction, and MHC I upregulation can be observed in Figure 1C for the animals treated with placebo. GA treatment resulted in a decreased expression for MHC I (Figure 1B). Figures 1 E-F represent the disease remission phase, showing a decrease in the expression of MHC I in animals treated with GA (E) and with placebo (F). Also the clinical signs were milder at this stage than during exacerbation. The decrease in immunolabelling for MHC I after GA treatment as compared to those treated with placebo and normal animals (control) was statistically significant during the exacerbation phase, as shown in Figure 1G (normal, 7.69 ± 1.08; placebo, 13.18 ± 0.93; GA treatment 9.83 ± 0.83; Integrated density of pixels ×103; Mean ± SEM; p<0.05). The remission phase data can be seen in Figure 1H (normal, 7.69 ± 1.08; placebo, 10.0 ± 0.23; GA treatment, 8.32 ± 0.26; Integrated density of pixels ×103; Mean ± SEM; p<0.05).
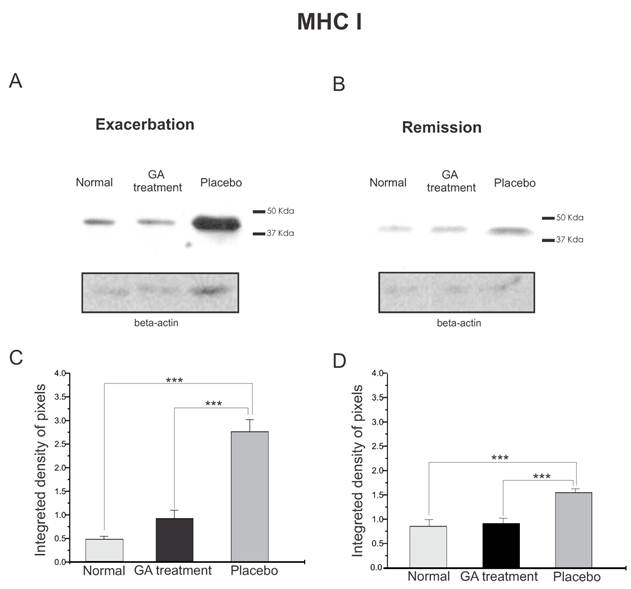
The quantitative MHC I protein expression by Western blotting can be seen in Figure 2. Figure 2 A shows the MHC I expression during exacerbation and Figure 2 B shows the MHC I expression during remission. It can be seen that the MHC I expression increased in both disease phases. The graph in C shows a statistical difference between the groups during exacerbation (normal, 0.47±0.07; treated, 0.93±0.17; placebo, 2.76±0.26, Integrated density of pixels ×103; Mean±SEM p <0.001). Note that the MHC I expression was lower in the remission stage and also the symptoms were reduced, especially in the GA treated group. The statistical differences between the groups can be seen in graph D (normal, 0.89 ± 0.15, treated, 0.95 ± 0.11, placebo, 1.60 ± 0.08, p <0.05, Integrated density of pixels ×103; Mean±SEM p <0.001).
MHC class I immunolabeling in the spinal cord ventral horn of C57BL/6 mice: normal (A and D), GA treated at the disease peak (B) and in the remission phase (E), and placebo treated at the disease peak (C) and in the remission phase (F). Note the low MHC I expression in the normal group and the overall increase in labeling in the placebo treated groups, especially at the disease peak. Quantification of the integrated density of pixels in each group is depicted in graphs G - disease peak and H - remission phase (*p<0.05, **p<0.01, ***p<0.001). Scale bar = 50 μm.
Western blotting of MHC class I expression (44KDa) within the lumbar intumescence in normal, placebo and GA treated mice at the disease peak (A) and during the remission phase (B). GA treatment resulted in a decreased MHC I expression in the motoneuron surroundings. Quantification of the bands is represented by graphs C and D for the disease peak and remission phase respectively (*p<0.05, **p<0.01, ***p<0.001).
Loss of synaptophysin immunoreactivity after GA treatment
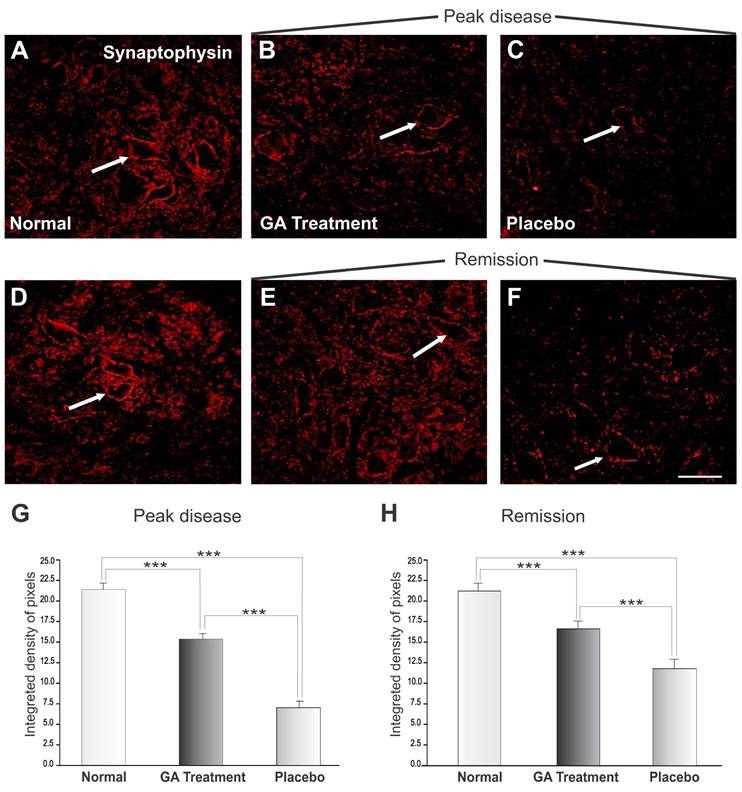
Figure 3 shows the immunoreactivity for synaptophysin in the spinal cord motor ventral nuclei. Figures 3 A and D represent normal animals with no disease. Figures 3 B and C show animals at the disease peak (onset), treated with GA and with placebo, respectively. It was observed that animals treated with placebo showed greater synaptic loss as compared with GA treated animals, which showed less prominent synaptic elimination. Figure 3G shows a statistical comparison between placebo and GA treated animals at the disease peak and normal animals (normal, 21.40 ± 0.49; placebo, 7.06 ± 0.81; GA treated, 15.37 ± 0.69; Integrated density of pixels ×103; Mean ± SEM; p<0.05).
The animals in the disease remission stage are represented in Figure 2 E-F, where those treated with GA (E) and with placebo (F) showed an improvement in immunolabeling as compared to the peak of the disease, in line with the reduction in clinical signs and also the decrease in MHC I expression. Figure 4G and H shows the statistically significant increase in labeling in the GA treated group as compared to normal and placebo treated groups (normal, 21.40 ± 0.49; placebo, 11.91 ± 0.67; GA treated, 16.80± 0.43; Integrated density of pixels ×103; Mean± SEM; p<0.001).
Synaptophysin immunolabeling in the spinal cord ventral horn of C57BL/6 mice: normal (A and D), GA treated at the disease peak (B) and in the remission phase (E), and placebo treated at the disease peak (C) and in the remission phase (F). Note the high synaptophysin expression in the normal group, particularly at the surface of the large motoneurons (arrows), and the overall decrease in labeling in the placebo treated groups, mostly at the disease peak. The GA treatment correlated with a significant preservation of inputs to the motoneuons at the disease peak. Quantification of the integrated density of pixels in each group is depicted in graphs G - disease peak and H - remission phase (*p<0.05, **p<0.01, ***p<0.001). Scale bar = 50μm.
Western blotting of synaptophysin expression (38KDa) within the lumbar intumescence in normal, placebo and GA treated mice during the disease peak (A) and remission phase (B). GA treatment resulted in preservation of the synaptophysin expression in the motoneuron surroundings, indicating that the treatment had a positive influence on the synaptic stability during the course of the disease. Quantification of the bands is represented in graphs C and D for the disease peak and remission respectively (*p<0.05, **p<0.01, ***p<0.001).
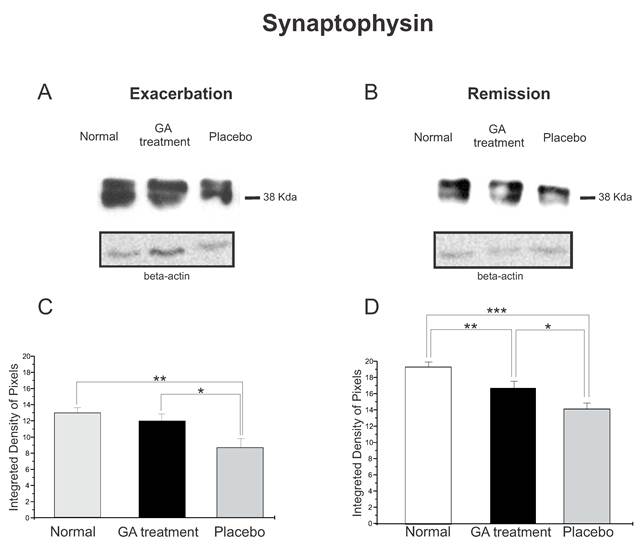
The synaptophysin protein expression by Western blotting showed a decrease in animals with EAE, Figure 4. Animals treated with GA in both phases of the disease analyzed showed better preservation of the synaptic covering when compared to the placebo treated mice. Such results indicated that GA administration had a positive influence on synaptic stability during the course of EAE. Figure 4 C illustrates the positive statistical differences between the groups during the exacerbation phase (normal, 12.96 ± 0.66; treated, 11.94 ± 0.88; placebo, 8.68 ± 1.10; Integrated density of pixels ×103; p <0.05). In addition, Figure 4 D shows the difference between the groups at the remission stage of the disease (normal, 18.24 ± 0.56; treated, 15.76 ± 0.78; placebo, 13.33 ± 0.68; Integrated density of pixels ×103; Mean±SEM; p < 0.01).
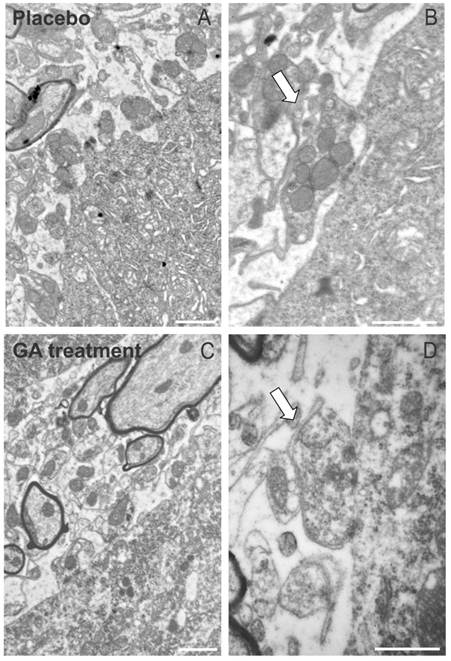
The immunohistochemical and Western blotting results were in line with the electron microscopy observations, which have shown a general better preservation of synapses apposed to alpha motoneurons in the ventral horn. As seen in Figure 5, placebo treated animals presented a number of retracted pre synaptic terminals, what is less evident in GA treated specimens.
Decrease in glial reaction in EAE induced animals after treatment with GA
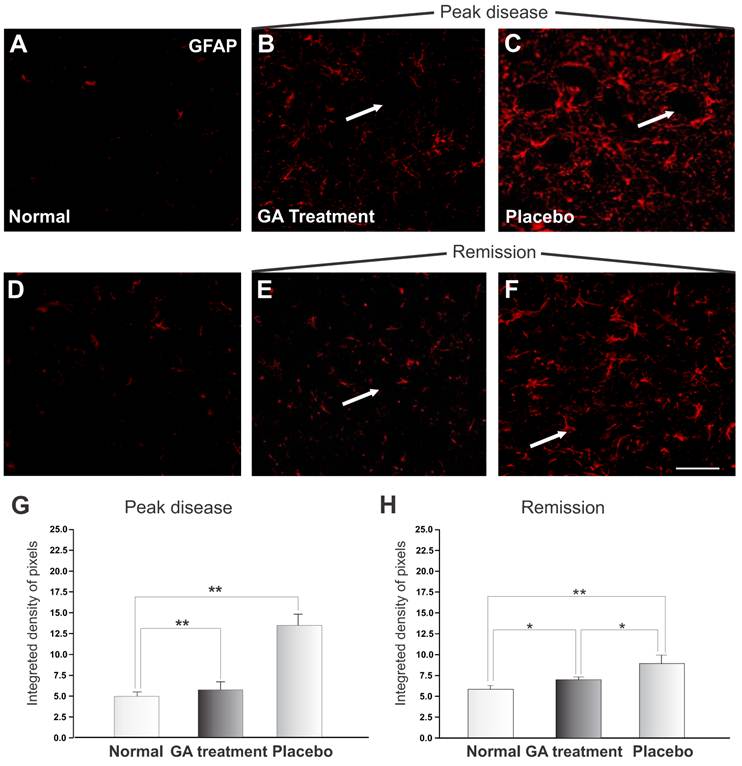
The reactivity of astrocytes may be measured by the GFAP expression. Figure 6 shows a significant increase in GFAP during the exacerbation of the disease. The pattern of labeling in the control group is represented in Figure 6 A and D. The immunolabeling of samples from the animals treated with placebo is shown in Figures 6 C and E, and of those from GA treated animals in Figures 6 B and F. During the exacerbation phase of the disease, the GFAP expression was elevated in animals treated with placebo, whilst the GA treated animals showed a decreased GFAP expression. A significant increase in astrocyte reactivity during exacerbation was demonstrated by the presence of reactive astrogliosis in the CNS. GA administration partially inhibited the glial response, as reflected in a decreased GFAP expression during the disease peak. The quantitative analysis is presented in Figure 6 G (normal, 4.83 ± 0.49; placebo, 13.14 ± 1.32; GA treated, 5.57 ± 0.97; Integrated density of pixels ×103; Mean±SEM; p<0.01).
At remission, animals treated with placebo showed a reduction in GFAP expression, indicating a decrease in local inflammation. Animals treated with AG still showed less astroglial reaction in comparison to the placebo treated group, as seen in Figure 6 H (normal, 4.83 ± 0.49; placebo, 9.78 ± 0.77; treated, 7.21 ± 0.37; Integrated density of pixels ×103; Mean±SEM; p <0.05).
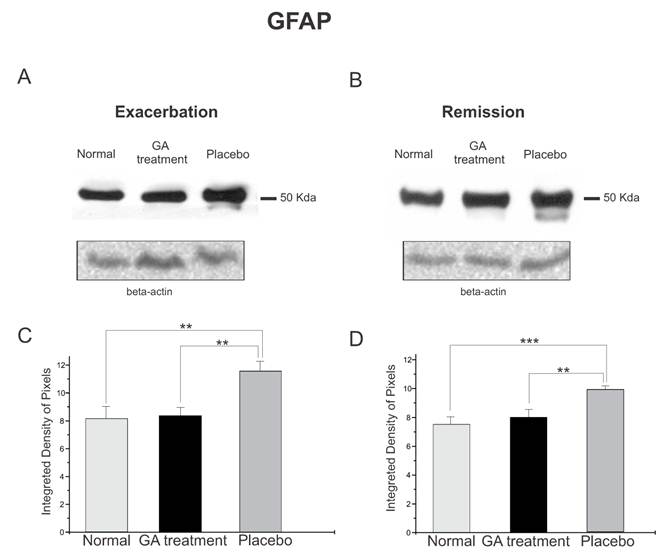
The protein expression of reactive astrocytes, GFAP, obtained by Western blotting quantification, confirmed the immunolabeling results, and showed an increased expression of this protein in placebo treated animals as compared to GA treated and normal animals during the exacerbation phase (Figure 7). During the exacerbation phase there was a statistical difference between normal, GA treated and placebo treated animals (normal, 8.17 ± 0.84; GA treated, 8.35 ± 0.57; placebo, 11.60 ± 0.70; Integrated density of pixels ×103; p<0.05, Figure 7 C). The same picture was seen at the remission stage, since the placebo treated animals also expressed greater amounts of GFAP (normal, 7.53 ± 0.51; GA treated, 8.01 ± 0.53; placebo, 9.89 ± 0.24; Integrated density of pixels ×103; p <0.05, Figure 7 D).
The ultrastructure at the surface of the alpha motoneurons, showing synapses in apposition to the cell membrane. (A) Placebo treated specimen depicting the retraction of terminals from the surface of a motoneuron. (B) A partially detached pre-synaptic terminal is shown in detail (arrow). (C) Preserved nerve terminals apposed to an alpha motoneuron at the disease peak, after treatment with GA. (D) Detail of a preserved input in almost complete apposition with the motoneuron plasma membrane (arrow). Note the presence of active electrondense zones in the synapse. Scale bar = 1μm.
GFAP immunolabeling in the spinal cord ventral horn of C57BL/6 mice: normal (A and D), GA treated at the disease peak (B) and remission phase (E), and placebo treated at the disease peak (C) and remission phase (F). Note the higher GFAP expression in the placebo treated group, particularly in the surroundings of the large motoneurons, and the overall decrease in labeling in the GA treated groups, particularly at the disease peak. Quantification of the integrated density of pixels in each group is depicted in graphs G -disease peak and H - remission phase. Scale bar = 50μm.
Western blotting of GFAP expression (50KDa) within the lumbar intumescence in normal, placebo and GA treated mice during the disease peak (A) and remission phase (B). The GA treatment kept astrogliosis close to the normal degree, whereas the placebo group showed a significant increase in this protein both at the disease peak and in the remission phase. Quantification of the bands is represented in graphs C and D for the disease peak and remission phase respectively (*p<0.05, **p<0.01, ***p<0.001).
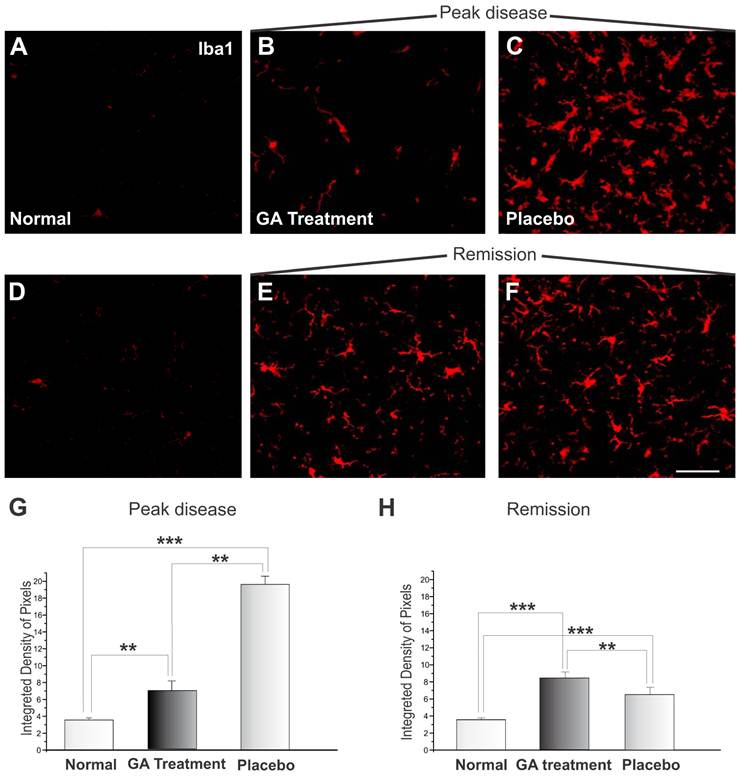
The microglial reaction of the spinal cord area surrounding the alpha motoneurons increased, as depicted by the immunohistochemistry examination. Immunolabeling against Iba1 is shown in Figure 8. Figures 8 A and D display the control animals, while Figures 8 C and F show the placebo treated sections during the exacerbation and remission phases. Figures 8 B and E represent specimens from GA treated animals during the exacerbation and remission phases, respectively. During the exacerbation phase, the GA treatment was able to reduce the reactivity of the microglia as compared to the placebo group (normal, 3.58 ± 0.24; placebo, 19.54 ± 0.97; GA treated, 6.88 ± 1.15, Integrated density of pixels ×103; Mean±SEM; p <0.01). The remission phase showed a decrease in Iba1 expression in the placebo treated group (Figure 8F). The GA treated group presented greater microglial expression at this stage than during the exacerbation (normal, 3.58 ± 0.24; placebo, 8.44 ± 0.39; GA treated, 6.58 ± 0.30, Integrated density of pixels ×103; Mean±SEM p <0.001).
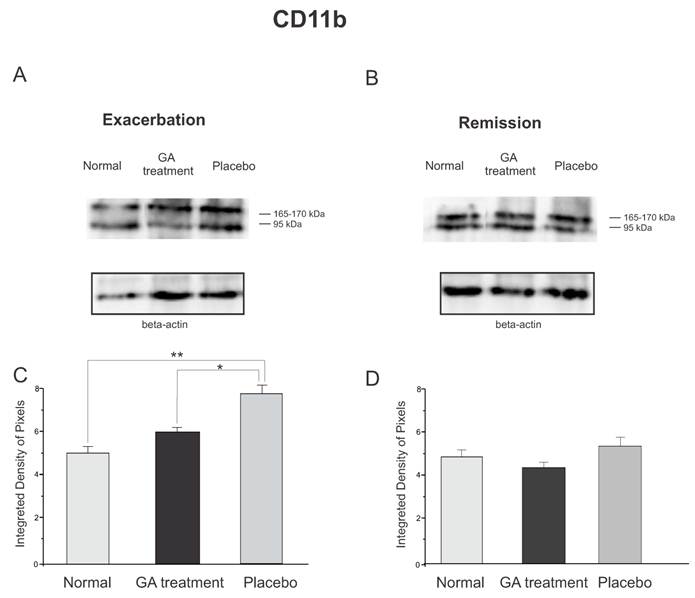
The protein expression of reactive microglia, relative to CD11b labeling, obtained by Western blotting quantification, confirmed the immunolabeling results, and showed an increased expression of this protein in placebo treated animals as compared to GA treated and normal animals during the exacerbation phase (Figure 9). During the exacerbation phase there was a statistical difference between normal, GA treated and placebo treated animals (normal, 4.96 ± 0.28; GA treated, 5.93 ± 0.21; placebo, 7.66 ± 0.26; Integrated density of pixels ×103; p <0.05, Figure 9 C). However, during the remission stage, no statistical differences were depicted between groups (normal, 4.83 ± 0.69; GA treated, 4.24 ± 0.19; placebo, 5.19 ± 0.23; Integrated density of pixels ×103; p <0.05, Figure 9 D).
Iba1 immunolabeling in the spinal cord ventral horn of C57BL/6 mice: normal (A and D), GA treated at the disease peak (B) and in the remission phase (E), and placebo treated at the disease peak (C) and in the remission phase (F). Note the higher Iba1 expression in the placebo treated group, particularly in the surroundings of the large motoneurons, and the overall decrease in labeling in the GA treated groups, particularly at the disease peak. Quantification of the integrated density of pixels in each group is depicted in graphs G - disease peak and H - remission phase. Scale bar = 50μm.
Western blotting of the Iba-1 expression (95, 165-170KDa) within the lumbar intumescence in normal, placebo and GA treated mice during the disease peak (A) and remission phase (B). GA treatment kept the microglial reaction at a level close to normal, whereas the placebo group showed a significant increase in this protein both at the disease peak and in the remission phase. In the remission phase no differences between groups were depicted. Quantification of the bands is represented in graphs C and D for the disease peak and remission, respectively (*p<0.05, **p<0.01, ***p<0.001).
Discussion
Multiple sclerosis is a chronic disease that affects a significant number of individuals usually at a very active age. The evolution of the disease involves a series of changes in the immune response so that an initially remittent/recurrent form may evolve to a progressive state within a few years [22]. Not until recently has it become accepted that the worsening of MS also involves a neurodegenerative process that may be present from the beginning, but seems to be subclinical, due to adaptive changes in the CNS that include synaptic plasticity and bypassing of ascending or descending pathways. The occurrence of such changes was reinforced by the work of Kerschensteiner et al. [23] with the use of an animal model of MS, namely experimental autoimmune encephalomyelitis (EAE). In this work it was demonstrated that axons remodel at multiple levels in response to a single neuroinflammatory lesion. Such plasticity included local changes in the spinal cord as well as modification in the corticospinal tract and in the motor cortex.
In a previous study, important network changes in the spinal cord of EAE induced rats during the course of the disease were also demonstrated [24]. The morphological changes, especially in the surroundings of the alpha spinal motoneurons, correlated with the worsening of the clinical signs of the disease and with the recovery from paralysis. In the present work, such changes were studied along with the expression of the MHC I complex, that has recently been implicated as part of a mechanism of synaptic plasticity.
The present results provide evidence that the MHC I expression is enhanced in the spinal cord during onset of the disease, and is concentrated in the surroundings of the motoneurons. As shown by Freria et al. [25] the motoneurons themselves, as well as glial cells, upregulate the expression of MHC I mRNA during the peak disease, coinciding with the period of greater synaptic remodeling. In the present study, the cytoplasmic MHC I protein expression could not be shown in the motoneurons, which possibly indicated a low level of nRNA translation. Nevertheless, knocking out the MHC I expression altered the pattern of synaptic elimination during development and after a peripheral nerve lesion [4, 25] so that, even at low levels, neuronal MHC I is of importance during plasticity of the synapses.
As shown by the immunohistochemical and Western blotting analyses, the GA treatment correlated with a decreased expression of MHC I during the induction phase of the disease. GA may also bind to the neuronal as well as to the glial MHC molecules expressed within the CNS. This may influences communication between such cells, contributing to the decreased loss of inputs to the motoneurons during the peak disease. Such preservation of inputs was depicted by the synaptophysin immunolabeling, transmission electron microscopy of the area surrounding the alpha spinal motoneurons, as well as by Western blotting analysis. These results also correlated with the less intense clinical signs during the course of the disease.
The positive action of GA during the course of EAE was previously reported with respect to the prevention of the demyelination typical of untreated induced animals. The ultrastructural analysis revealed that even if GA therapy was initiated after onset of the disease, the loss of myelin could be reduced. A possible induction of remyelination was also proposed. Altogether, it is possible to hypothesize that GA targets different processes in the CNS during the course of the disease, including modulation of the MHC I and its effects on the synapses in the spinal cord.
The GA treatment was also able to reduce gliosis during the peak disease, as seen by the GFAP (for astrocytes) and Iba1 (for microglia) analyses. These results are in line with the putative anti-inflammatory effects of GA by inducing Th2/3 cells, which secrete IL-4, IL-10 and transforming growth factor, but not Th1 related cytokines. Glial cells have been implicated in both positive and negative events that develop after neurological damage and disease [26-28]. It is possible that reactive astrocytes as well as microglia secrete pro-inflammatory substances that, in turn, increase synaptic lesion and retraction, decreasing the regenerative potential and survival of the neurons. Nevertheless, under an anti-inflammatory stimulus, such as GA treatment, they may secrete trophic factors and other substances that may be neuroprotective as well as stabilizing the neuronal circuits. The increase in the microglia reaction after GA treatment in the remission phase may be related to such a protective response, since it did not interfere in the synaptic covering, as shown by synaptophysin immunolabeling and by the ultrastructural analysis.
The idea that immunomodulating the evolution of the disease could also positively reflect on the synapses and glial cells in the CNS, may also apply to other situations such as mechanical damage. In this sense, Piehl et al. [26] and Barbizan & Oliveira [29] described a neroprotective effect of inflammation during the peak of EAE, if combined with ventral root avulsion. It was also demonstrated an increase in BDNF mRNA and protein expression within the damaged neuropil, which possibly accounted for the increase in neuronal survival [28].
Further studies are necessary in order to investigate the outcome of CNS and PNS regeneration after repair combined with GA treatment. A thorough analysis of the glial response as well as a comparison of the secreted cytokines and trophic factors after GA treatment, may also contribute to a better understanding of such immunomodulatory treatment.
In summary, the present results show that the GA treatment may decrease synaptic loss during the course of EAE, which correlates with downregulation of the MHC I complex, recently implicated as a participant during the rewiring of the nervous system. Also, the decrease, but not the absence, of the astroglial response indicates a possible anti-inflammatory effect of the GA treatment, that stimulates secretion of trophic factors and Th2 related cytokines both by immune and glial cells.
Acknowledgements
This work was supported by Fapesp and CAPES. Scorisa JM received a scholarship from CAPES (Brazil). Oliveira, A.L.R. receives a fellowship from CNPq (Brazil). We acknowledge the support of Fapesp (Fundação de Amparo à Pesquisa do Estado de São Paulo - Brazil), grant number 2011/18991-8.
Conflict of Interests
The authors have declared that no conflict of interest exists.
References
1. Cullheim S, Wallquist W, Hammarberg H, Lindå H, Piehl F, Carlstedt T, Risling M. Properties of motoneurons underlying their regenerative capacity after axon lesions in the ventral funiculus or at the surface of the spinal cord. Brain Res Brain Res Rev. 2002;40:309-16
2. Navarro X. Chapter 27: Neural plasticity after nerve injury and regeneration. Int Rev Neurobiol. 2009;87:483-505
3. Huh GS, Boulanger LM, Du H, Riquelme PA, Brotz TM, Shatz CJ. Functional requirement for class I MHC in CNS development and plasticity. Science. 2000;290(5499):2155-2159
4. Boulanger LM, Huh GS, Shatz CJ. Neuronal plasticity and cellular immunity: shared molecular mechanisms. Curr Opin Neurobiol. 2001;11(5):568-578
5. Cullheim S, Thams S. Classic major histocompatibility complex class I molecules: new actors at the neuromuscular junction. Neuroscientist. 2010;16(6):600-607
6. Neumann H, Schmidt H, Cavalié A, Jenne D, Wekerle H. Major histocompatibility complex (MHC) class I gene expression in single neurons of the central nervous system: differential regulation by interferon (IFN)-gamma and tumor necrosis factor (TNF)-alpha. J Exp Med. 1997;185(2):305-316
7. Oliveira ALR, Thams S, Lidman O, Piehl F, Hökfelt T, Kärre K, Lindå H, Cullheim S. A role for MHC class I molecules in synaptic plasticity and regeneration of neurons after axotomy. PNAS. 2004;101(51):17843-17848
8. Sabha M, Emirandetti A, Cullheim S, Oliveira ALR. MHC I expression and synaptic plasticity in different mice strains after axotomy. Synapse. 2008;62(2):137-148
9. Huitinga I, Ruuls SR, Jung S, Van Rooijen N, Hartung HP, Dijkstra CD. Macrophages in T cell line-mediated, demyelinating, and chronic relapsing experimental autoimmune encephalomyelitis in Lewis rats. Clin Exp Immunol. 1995;100(2):344-351
10. Hickey WF. The pathology of multiple sclerosis: a historical perspective. J Neuroimmunol. 1999;98(1):37-44
11. Krishnamoorthy G, Wekerle H. EAE: an immunologist's magic eye. Eur J Immunol. 2009;39(8):2031-2035
12. Baker D, Gerritsen W, Rundle J, Amor S. Critical appraisal of animal models of multiple sclerosis. Mult Scler. 2011 in press
13. Butterfield RJ, Blankenhorn EP, Roper RJ, Zachary JF, Doerge RW, Sudweeks J, Rose J, Teuscher C. Genetic analysis of disease subtypes and sexual dimorphisms in mouse experimental allergic encephalomyelitis (EAE): relapsing/remitting and monophasic remitting/nonrelapsing EAE are immunogenetically distinct. J Immunol. 1999;162(5):3096-3102
14. Spahn TW, Issazadah S, Salvin AJ, Weiner HL. Decreased severity of myelin oligodendrocyte glycoprotein peptide 33 - 35-induced experimental autoimmune encephalomyelitis in mice with a disrupted TCR delta chain gene. Eur J Immunol. 1999;29(12):4060-4071
15. Bauer J, Huitinga I, Zhao W, Lassmann H, Hickey WF, Dijkstra CD. The role of macrophages, perivascular cells, and microglial cells in the pathogenesis of experimental autoimmune encephalomyelitis. Glia. 1995;15(4):437-446
16. Voskuhl RR, Peterson RS, Song B, Ao Y, Morales LB, Tiwari-Woodruff S, Sofroniew MV. Reactive astrocytes form scar-like perivascular barriers to leukocytes during adaptive immune inflammation of the CNS. J Neurosci. 2009;29(37):11511-11522
17. Massey EJ, Sundstedt A, Day MJ, Corfield G, Anderton S, Wraith DC. Intranasal peptide-induced peripheral tolerance: the role of IL-10 in regulatory T cell function within the context of experimental autoimmune encephalomyelitis. Vet Immunol Immunopathol. 2002;87(3-4):357-372
18. Karandikar NJ, Crawford MP, Yan X, Ratts RB, Brenchley JM, Ambrozak DR, Lovett-Racke AE, Frohman EM, Stastny P, Douek DC, Koup RA, Racke MK. Glatiramer acetate (Copaxone) therapy induces CD8(+) T cell responses in patients with multiple sclerosis. J Clin Invest. 2002;109(5):641-649
19. Blanchette F, Neuhaus O. Glatiramer acetate: evidence for a dual mechanism of action. J Neurol. 2008;255:26-36
20. Aharoni R, Arnon R, Eilam R. Neurogenesis and neuroprotection induced by peripheral immunomodulatory treatment of experimental autoimmune encephalomyelitis. J Neurosci. 2005;25(36):8217-8228
21. Marques KB, Scorisa JM, Zanon R, Freria CM, Santos LM, Damasceno BP, Oliveira AL. The immunomodulator glatiramer acetate influences spinal motoneuron plasticity during the course of multiple sclerosis in an animal model. Braz J Med Biol Res. 2009;42(2):179-188
22. Prat E, Martin R. The immunopathogenesis of multiple sclerosis. J Rehabil Res Dev. 2002;39(2):187-199
23. Kerschensteiner M, Bareyre FM, Buddeberg BS, Merkler D, Stadelmann C, Brück W, Misgeld T, Schwab ME. Remodeling of axonal connections contributes to recovery in an animal model of multiple sclerosis. J Exp Med. 2004;200(8):1027-1038
24. Marques KB, Santos LM, Oliveira ALR. Spinal motoneuron synaptic plasticity during the course of an animal model of multiple sclerosis. Eur J Neurosci. 2006;24(11):3053-3062
25. Freria CM, Zanon RG Santos LM, Oliveira AL. Major histocompatibility complex class I expression and glial reaction influence spinal motoneuron synaptic plasticity during the course of experimental autoimmune encephalomyelitis. J Comp Neurol. 2010;518(7):990-1007
26. Wegner C, Stadelmann C. Gray matter pathology and multiple sclerosis. Curr Neurol Neurosci Rep. 2009;9(5):399-404
27. Herrmann AM, Göbel K, Simon OJ, Melzer N, Schuhmann MK, Stenner MP, Weishaupt A, Kleinschnitz C, Bittner S, Meuth P, Stuve O, Budde T, Kieseier BC, Wiendl H, Meuth SG. Glatiramer acetate attenuates pro-inflammatory T cell responses but does not directly protect neurons from inflammatory cell death. Am J Pathol. 2010;177(6):3051-3060
28. Piehl F, Hammarberg H, Tabar G, Hökfelt T, Cullheim S. Changes in the mRNA expression pattern, with special reference to calcitonin gene-related peptide, after axonal injuries in rat motoneurons depends on age and type of injury. Exp Brain Res. 1998;119(2):191-204
29. Barbizan R, Oliveira ALR. Impact of acute inflammation on spinal motoneuron synaptic plasticity following ventral root avulsion. J Neuroinflammation. 2010;7:29
Author contact
![]() Corresponding author: Dr. Alexandre L.R. Oliveira, Departamento de Anatomia, Instituto de Biologia, Universidade Estadual de Campinas (UNICAMP), CP 6109, CEP 13083-970, Campinas, SP, Brazil. Phone/Fax: +55 19 3521-6295. E-mail: alrolivbr
Corresponding author: Dr. Alexandre L.R. Oliveira, Departamento de Anatomia, Instituto de Biologia, Universidade Estadual de Campinas (UNICAMP), CP 6109, CEP 13083-970, Campinas, SP, Brazil. Phone/Fax: +55 19 3521-6295. E-mail: alrolivbr

 Global reach, higher impact