Impact Factor ISSN: 1449-2288
- Issue 12; 2026
- Issue 11; 2026
- Issue 10; 2026
- Issue 9; 2026
- Issue 8; 2026
- Volume 22; 2026
- Past Issues
- Advance Articles
- Editorial Board
- Cover Images
- Index & Coverage
- Cover Suggestion
- Special Issues
Introduction
Materials and Methods
Results
Discussion
Supplementary Material
Acknowledgements
References
Author Biography

 Global reach, higher impact
Int J Biol Sci 2012; 8(4):548-560. doi:10.7150/ijbs.4071 This issue Cite
Research Paper
Data Mining in Networks of Differentially Expressed Genes during Sow Pregnancy
Ligang Wang1*, Longchao Zhang1*, Yong Li1, Wen Li1, Weizhen Luo1, Duxue Cheng1, Hua Yan1, Xiaojun Ma1, Xin Liu1, Xin Song2, Jing Liang1, Kebin Zhao1, Lixian Wang1 ![]()
1. Key Laboratory of Farm Animal Genetic Resources and Germplasm Innovation of Ministry of Agriculture, Institute of Animal Science, Chinese Academy of Agricultural Sciences, 100193 Beijing, China.
2. College of Veterinary Medicine, Sichuan Agricultural University, Ya'an 625014, China.
* These authors contributed equally to this work.
Received 2012-1-20; Accepted 2012-4-12; Published 2012-4-16
Abstract
Small to moderate gains in Pig fertility can mean large returns in overall efficiency, and developing methods to improve it is highly desirable. High fertility rates depend on completion of successful pregnancies. To understand the molecular signals associated with pregnancy in sows, expression profiling experiments were conducted to identify differentially expressed genes in ovary and myometrium at different pregnancy periods using the Affymetrix Porcine GeneChipTM. A total of 974, 1800, 335 and 710 differentially expressed transcripts were identified in the myometrium during early pregnancy (EP) and late pregnancy (LP), and in the ovary during EP and LP, respectively. Self-Organizing Map (SOM) clusters indicated the differentially expressed genes belonged to 7 different functional groups. Based on BLASTX searches and Gene Ontology (GO) classifications, 129 unique genes closely related to pregnancy showed differential expression patterns. GO analysis also indicated that there were 21 different molecular function categories, 20 different biological process categories, and 8 different cellular component categories of genes differentially expressed during sow pregnancy. Gene regulatory network reconstruction provided us with an interaction model of known genes such as insulin-like growth factor 2 (IGF2) gene, estrogen receptor (ESR) gene, retinol-binding protein-4 (RBP4) gene, and several unknown candidate genes related to reproduction. Several pitch point genes were selected for association study with reproduction traits. For instance, DPPA5 g.363 T>C was found to associate with litter born weight at later parities in Beijing Black pigs significantly (p < 0.05). Overall, this study contributes to elucidating the mechanism underlying pregnancy processes, which maybe provide valuable information for pig reproduction improvement.
Keywords: gene network, microarray, myometrium, ovary, sow pregnancy
Introduction
Many agricultural enterprises and breeders have great interest in pig fertility because of its major impact on production and profit. As selection by litter size is limited due to its low heritability, strong heterosis and sex-limited nature [1], there is pressure to devise methods to improve fertility rates [2]. With the development of molecular biology, genetic characterization of litter size and factors that affect it (e.g. ovulation rate and embryo survival) will increase our understanding of the underlying physiology and may assist genetic improvement through use of marker assisted selection (MAS) [3]. A number of approaches have been utilized to isolate the factors influencing litter size. To date, 123 quantitative trait loci (QTLs) of litter size and reproductive traits (http://www.animalgenome.org/QTLdb/) [4] and some major candidate genes such as estrogen receptor (ESR), prolactin receptor (PRLR), follicular-stimulating hormone beta subunit (FSHβ), erythropoietin receptor (EPOR), osteopontin (OPN) and prolactin (PRL) [1, 5-11] have been identified, although the exact effects of these genes have not been fully determined among different breeds and/or different populations [7, 11-15].
The new genomic revolution associated with the sequencing and availability of new tools such as large-scale gene expression microarrays gives scientists and breeders the opportunity to benefit from the use of much more powerful methods to understand the biological basis of pregnancy. In order to better understand the cellular and molecular events during pregnancy, gene microarrays have been utilized widely. For instance, Bonnet et al. (2008) attempted to identify differentially expressed genes in pig granulosa cells along the terminal ovarian follicle growth and showed in particular the down-regulation of ribosomal protein, cell morphology and ion-binding genes [16]. Ross et al. (2009) investigated gene expression during porcine conceptus rapid trophoblastic elongation and attachment to the uterine luminal epithelium. When comparing filamentous day 12 conceptuses with large spherical conceptuses, as many as 482 genes changed by greater than 2-fold in expression, and the genes represented a large number of biological processes associated with cell motility, ATP utilization, cell growth, metabolism and intracellular transport [17]. Sun et al. (2011) used the Affymetrix Porcine Genechip™ to profile differentially expressed genes in ovarian follicles at the pre-ovulatory stage of a PMSG-hCG stimulated estrous cycle from 3 Chinese Taihu and 3 Large White cycling sows. The suggestive or significant associations of the BAX and BMPR1B genes with litter size indicated these genetic markers have the potential to be used in the pig industry after further validation of their genetic effects [18]. Amanda et al. (2011) analyzed ovarian gene expression during sow pregnancy and finally identified 221 differentially expressed probes, representing 189 genes. After integrating microarray data with the QTL positional information affecting litter size, the authors identified 27 differentially expressed genes co-localizing with QTL for litter size traits, which fulfilled the biological, positional and functional criteria [19].
Ovary and myometrium play crucial roles in pig pregnancy because they can synthesize different hormones that are essential for conceptus maintenance. Moreover, myometrium is the main tissue for conceptus transformation. Both of ovary and myometrium could influence embryo survival. Analyzing genes expression difference of these two tissues in different pregnant periods could be helpful to understand pregnant physiology. Previous reports have made some inroads into understanding the molecular mechanism underlying development of pregnancy, but little research on the functional adaptation of the ovary and myometrium during their transitions from relative quiescence to activation. Because non-infectious causes probably account for 70% or more of the cases of embryonic death [20], understanding how gene expression is altered during pregnancy is particularly important. In this study, the Affymetrix Porcine GeneChipTM was used to detect the differentially expressed transcripts in different pregnancy periods in both ovary and myometrium. The aim of this work was to comprehensively analyze the mechanisms underlying pregnancy development.
Materials and Methods
Animals and tissue collection
All animal procedures were performed according to guidelines developed by the China Council on Animal Care, and protocols were approved by the Animal Care and Use Committee of Beijing, China. The approval ID or permit numbers are SYXK (Beijing) 2008-007 and SYXK (Beijing) 2008-008. In order to ensure all the pigs could meet our demands, a population was elaborately designed for a long time. Nine Large White sows which were half siblings were selected to supply ovaries and myometrial tissues. These nine pigs were divided into three groups: non-pregnant (NP, n=3), early pregnant (EP, n=3, pregnant for 25-30 days), and late pregnant (LP, n=3, pregnant for 75-80 days). The NP pigs were all 8 months old. The pregnant pigs were all about 12 months old. All the pigs were sacrificed at the same time. The ovaries and myometrial tissues were collected and washed in phosphate-buffered saline (PBS) immediately and then frozen in liquid nitrogen. All samples were stored at -80°C until RNA was extracted.
RNA preparation
TRIzol (Invitrogen, USA) and RNeasy Mini Kit (Qiagen, Germany) were used for RNA extraction and purification, respectively, following the manufacturers' instruction. RNA quality was assessed and confirmed to be high using the Agilent 2100 Bioanalyzer. All RNA samples were diluted to consistent concentration. Three RNA pools were obtained by mixing the three samples in each group and prepared for microarray hybridization.
Microarray hybridization
RNA labeling and hybridization were performed by a commercial Affymetrix array service (Genetech Biotechnology Limited Company, Shanghai, China). Briefly, GeneChipTM One-Cycle target labeling and control reagents were used according to the manufacturer's protocol. Labeled RNA was prepared from approximately 20 μg of total RNA. Hybridization and washing were performed using the Affymetrix Fluidics Station 450 and Hybridization Oven 640 under standard conditions. Image processing was conducted using the Affymetrix GeneArray 3000 scanner. The Affymetrix Porcine GeneChipTM Array contains 23,937 probe sets representing 20,201 genes and 190 controls. The sequence information for this array was selected from public data sources, including UniGene Build 28 (August 2004), GenBank mRNAs up to March, 2007, and GenBank porcine mitochondrial and rRNA sequences.
Data normalization
Raw data from .CEL files were converted to gene signal files by MAS 5.0. The average intensity for all probes on the array was scaled to 500. Differentially expressed genes were filtered to exclude those either present in only LP and EP periods or that changed less than 2.0-fold compared with control. All data are MIAME compliant [21] and have been deposited in the Gene Expression Omnibus (GEO) database (http://www.ncbi.nlm.nih.gov/geo/) under the accession number: GSE32438.
Quantitative PCR (QPCR) validation
Six transcripts were selected for QPCR confirmation using myometrial tissue. Primers were designed using Primer Premier 5 software (Supplementary Material: Table S1). ReverTra AceTM for cDNA synthesis and SYBRTM Green PCR reagent were purchased from TOYOBO. Reverse transcription was conducted to synthesize the first-strand complementary DNA (cDNA) using M-MLV (Invitrogen, and the products were purified with QIAquick columns (Qiagen). Real-time PCR was performed on the iQ5™ Real-Time PCR Detection System (Bio-Rad). The quantities of the mRNA of six selected genes from the ovary and myometrium were normalized to β-actin and 18s rRNA to compensate for variations in input RNA. Relative gene expression levels were determined by employing the comparative Ct (ΔΔCt) method [22]. Correlations between QPCR results and array data were analyzed using SAS software (v9.1).
Data analyses
The significance level cut-off used for differentially expressed (DE) genes selection was p < 0.001. Furthermore, the false discovery rate (FDR), which was computed using the QVALUE software package [23], was also applied as a standard (FDR < 0.002) for DE genes selection. Hierarchical cluster analysis, which considers NP as a quiescence state and EP and LP as steeply up active states, was performed using Genespring software [24]. Details on the parameters can be obtained from the authors. Gene ontology (GO) analyses were conducted for significantly differentially expressed genes by the online Gene Functional Classification and Annotation Tool in the Database for Annotation, Visualization and Integrated Discovery (DAVID) [25]. Pathway analysis was used to identify the significant pathways of the differential genes according to the Kyoto Encyclopedia of Genes and Genomes (KEGG). Fisher's exact test was used to select each significant pathway, and the significance threshold was defined by the p value [26]. Networks were reconstructed by using GRNInfer [27, 28]. GRNInfer is a method based on linear programming and a decomposition procedure to combine multiple time-course microarray datasets from different conditions for inferring gene regulatory networks. The network was visualized using static and dynamic graph drawing tools of the Graphviz software program [29].
Gene selection, gene cloning and chromosomal mapping
The candidate genes were selected based on the cluster and network results. RT-PCR and 5`-RACE PCR were used to obtain the completed cDNA sequences of the selected expressed sequence tags (ESTs), with the primer pairs shown in Supplementary Material: Table S2. The IMpRH4 and pig-specific primer pairs (Supplementary Material: Table S3) were used for regional mapping of the selected ESTs. A negative control containing no DNA template was also included. The PCR products were scored on agarose gels. The PCR results for the three genes were analyzed using the IMpRH mapping tool 5 (http://imprh.toulouse.inra.fr/) [30]. The three ESTs were significantly linked (LOD > 6) to a marker of the first generation radiation hybrid map 6. Their chromosomal locations (Table 1) were inferred based on the positions of the closely linked markers directly localized on the cytogenetic map; if not, they were estimated by the positions of the proximal markers previously assigned to the cytogenetic map. The markers used to propose cytogenetic positions are indicated in Table 1.
Chromosomal assignments of three porcine genes
| No. | CM | LOD score | Porcine cytogenetic position |
|---|---|---|---|
| Ssc.315 | Sw1123 | 5.82 | 1p1.3 |
| Ssc.204 | S0299 | 10.56 | 6q32-q32 |
| Sw1647 | 12.61 | ||
| Ssc.256 | Swr73 | 6.38 | 4p12-p13 |
LOD, Limit of Detect; CM, Close Markers.
Polymorphism and association analysis
The completed cDNA sequences and location were used to obtain the full DNA sequences by bioinformatic approaches such as BLAST in the Ensembl website (www.ensembl.org). Seventeen pairs of primers for these three genes were designed using Primer Premier 5 software (Supplementary Material: Table S4). DNA pools from six pig breeds (Large White, Beijing Black, Bamei, Rongchang, Laiwu and Min) were sequenced to identify single nucleotide polymorphism (SNPs). The mutations were detected in 292 Beijing Black and 191 Large White using the restriction fragment length polymorphism (RFLP) method (Table 2). The litter sizes of the Beijing Black and the Large White sows were recorded for a total of 1523 and 596 parities, respectively. The total number born (TNB), number born alive (NBA) and live weight born (LWB) in each litter were recorded. These values were averaged for first parity and later parities (Beijing black, second through eleventh parities; Large White, second through third parities). Finally, association analysis between the SNPs and reproductive traits was carried out using the GLM (General Linear Model) procedure by SAS software V9.1 with parity, genotype, farm and season as fixed effects. The animal model is expressed as:
Mutation loci detected in three genes
| Gene | Mutation loci | Location | Type | Enzyme |
|---|---|---|---|---|
| DPPA5 | g.206 C>T | Exon2 | samesense | - |
| g.363 T>C | Exon2 | missense | BtsΙ | |
| g.844 G>T | Exon3 | missense | FspI | |
| FP | g.177 G>A | Exon1 | samesense | - |
| g.477 G>A | Exon1 | missense | BstUΙ | |
| g.546 A>G | Exon1 | missense | TaqΙ | |
| g.923 A>G | Intron | - | - | |
| g.934 A>G | Intron | - | - | |
| MAL2 | g.18813 A>G | Exon3 | samesense | - |
| g.18862 C>A | Exon3 | missense | PstΙ | |
| g.18865 C>G | Exon3 | missense | BsrBΙ |
Yijkl = μ + Pi + Sj + Fk+ Gl + eijkl,
where Yijkl is the observation of the trait, μ is the least square means, Pi is the effect of ith parity (i = 1, 2, 3, 4…), Sj is the effect of jth season, Fk is the effect of kth farm (k = 1, 2), Gl is the effect of lth genotype (l = 1-3) and eijkl is the random residual [31].
Results
Gene expression profiles of pig ovary and myometrium in early and late gestation
All transcripts that were either up-regulated or down-regulated by ≥2 fold during EP and LP in ovary and myometrium were statistically determined (Supplementary Material: Table S5). Many more differentially expressed transcripts were found in the myometrium than in the ovary during gestation. In the myometrium, there were more up-regulated transcripts in both the EP and LP periods. Furthermore, there were 974 (418 up- and 556 down-regulated transcripts, p<0.001, FDR<0.002) and 1800 (826 up- and 974 down-regulated, p<0.001, FDR<0.002) genes differentially expressed by more than 2-fold in the myometrium in EP and LP, respectively. Similarly, there were 335 (189 up- and 146 down-regulated, p<0.001, FDR<0.002) and 710 (236 up- and 487 down-regulated, p<0.001, FDR<0.002) genes differentially expressed by more than 2-fold in the ovary in EP and LP, respectively.
Validation of microarray data by QPCR
The correlation between QPCR results and array data is shown in Fig.1. Although the magnitude of fold change measured by QPCR was different than those obtained by microarray in some instances, the trends in expression of the six genes were similar. The regression equation is:
Comparison between GeneChip and QPCR results. (A) Scatter plots correlating the GeneChip results with the QPCR results. (B) Comparison of trends between GeneChip and QPCR results. FC: Fold Changes. EP1-6 represents transcripts AY35-1, NM-00-1, CN16-1, BX91-2, NM-21-2 and CF78-1 in early pregnant, respectively. LP1-6 represents transcripts AY35-1, NM-00-1, CN16-1, BX91-2, NM-21-2 and CF78-1 in late pregnant, respectively. Bars indicate different fold changes (negative and positive values represent down and up regulation, respectively).
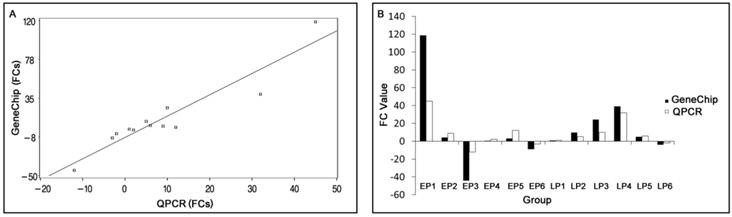
Y=2.3257X-8.0626 (p< 0.0001)
(Root MSE=13.9281; R2 = 0.8828)
where Y is the GeneChipTM fold change value, X is the QPCR fold change value, and R2 is the correlation coefficient. The QPCR data and array data were divided into two groups to perform paired t-tests of the means. The results indicated no significant difference between them, p (0.6214) > 0.05.
Cluster and GO analyses
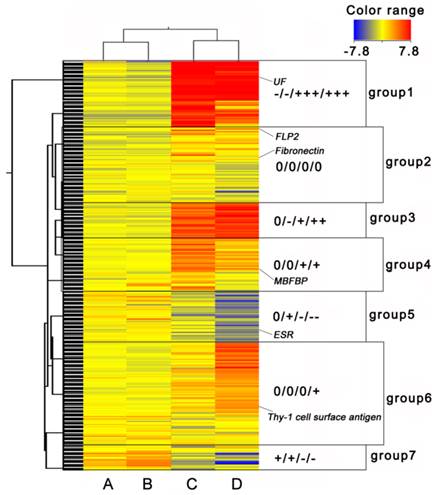
For cluster analysis, we considered the NP period as a quiescence state, and the EP and LP periods as active states. In all, 2854 transcripts with ≥ 2-fold changes were selected. Finally, 7 groups were classified as shown in the Self-Organizing Maps (Fig. 2). Genes in group 1, 3, 5 and 7 had opposite expression patterns in ovary and myometrium. Genes in group 2 were had same expression patterns in ovary and myometrium, and genes in group 4 and 6 were expressed only in the myometrium. Many sexual hormone regulation genes, such as ESR and uteroferrin (UF), were contained in group 1, 3, 5 and 7 and had different expression pattern in ovary and myometrium. These results indicated these groups may relate to hormone production. Genes in group 2 were not differentially expressed very high or low which indicated that this group may related to ordinary growth of the ovary and uterus. That many genes like membrane-bound folate binding protein (MBFBP) and Thy's-1 cell surface antigen be classified to group 4 and 6 suggested these groups were related to uterus immune, development and material transcription of the fetus.
Cluster heat map of differentially expressed genes. (A) EP period of ovary, (B) LP period of ovary, (C) EP period of myometrium, and (D) LP period of myometrium. ESR: Estrogen Receptor, UF: Uteroferrin, FLP2: Fibrinogen-Like Protein 2, MBFBP: Membrane-Bound Folate Binding Protein. “0”, 0 fold change log ratio; one “-” represents one “-2-fold” change log 2 ratio, one “+” represents one “2-fold” change log 2 ratio. Log 2 ratio “≥1” represents up regulation, “≤-1” represents down regulation. Color legend is on the top right corner (red and blue indicates increased and decreased transcript expression levels compared with non-pregnant samples, respectively).
Of the 2854 differentially expressed transcripts, 1020 were putatively identified based on BLASTX searches (Supplementary Material: Table S6-S9). Annotation of the 1020 transcripts was carried out using DAVID. Of the 1020 differentially expressed transcripts, 129 unique genes were identified as relevant ones closely related to reproduction.
However, according to the GO analysis (Supplementary Material: Table S10-S14), in the category of molecular function (MF), genes with MHC class II receptor activity and enzyme regulator activity in the LP period were not differentially expressed, nor were genes with MHC class I receptor activity in the EP period. Iron ion binding genes were only differentially expressed in the myometrium. Compared with the EP period, expression of genes in the ovary related to lipid binding, endopeptidase activity and chemokine activity changed distinctly. In the category of biological process (BP), in the LP period in ovary, the expression of genes with normal biological processes had small changes, while genes associated with stimulus and stress response changed more than those in the EP period in ovary and EP and LP periods in myometrium. In the EP period in myometrium, genes related to cell growth, regulation of cell size and cell cycle were differentially expressed. In the category of cellular component, the differentially expressed genes were all related to molecular membrane (MM). In the LP period of ovary and EP and LP of myometrium, expression of genes associated with plasma membrane, MHC protein complex, immunological synapse and protein complex were differentially regulated, with the expression of genes related to integral and intrinsic membrane components exhibiting the largest changes.
All KEGG pathways of DE genes were summarized in Supplementary Material: Table S13-S16, and the significant pathway categories (p<0.05) were list in Supplementary Material: Table S17. In order to better understand the pathways, these pathways were divided into two types based on the up- or down- regulated status of the DE genes (Table 3). There are 32 pathways which represent different regulation patterns involved in pig pregnancy. Some pathways such as the valine, leucine and isoleucine degradation pathways were up-regulated only in the ovary. And some pathways such as the allograft rejection pathway, PPAR signaling pathway and so on were up- or down-regulated only in the myometrium. And other pathways such as the ECM-receptor interaction pathway were up- or down-regulated in both ovary and myometrium.
Signaling pathways of DE genes.
| Pathways | OE | OL | ME | ML |
|---|---|---|---|---|
| ABC transporters | ↑ | |||
| Allograft rejection | ↓ | ↓ | ||
| Amino sugar and nucleotide sugar metabolism | ↑ | |||
| Antigen processing and presentation | ↓ | ↓ | ||
| Arachidonic acid metabolism | ↑ | |||
| Asthma | ↓ | |||
| Autoimmune thyroid disease | ↓ | ↓ | ||
| Cell adhesion molecules (CAMs) | ↓ | ↓ | ||
| Cell cycle | ↓ | |||
| Complement and coagulation cascades | ↑ | ↑ | ↑ | |
| Cysteine and methionine metabolism | ↓ | |||
| ECM-receptor interaction | ↓ | ↑ | ||
| Glutathione metabolism | ↑ | |||
| Glycine, serine and threonine metabolism | ↓ | ↓ | ||
| Glycosaminoglycan degradation | ↑ | |||
| Glycosphingolipid biosynthesis | ↑ | |||
| Graft-versus-host disease | ↓ | ↓ | ||
| Hematopoietic cell lineage | ↓ | |||
| Intestinal immune network for IgA production | ↓ | ↓ | ||
| Lysosome | ↑ | ↑ | ||
| Other glycan degradation | ↑ | ↑ | ||
| Pentose and glucuronate interconversions | ↑ | |||
| Porphyrin and chlorophyll metabolism | ↑ | |||
| PPAR signaling pathway | ↑ | ↑ | ||
| Primary immunodeficiency | ↓ | ↓ | ||
| Renin-angiotensin system | ↑ | |||
| Sphingolipid metabolism | ↑ | ↑ | ||
| Steroid hormone biosynthesis | ↑ | ↑ | ||
| Toll-like receptor signaling pathway | ↓ | |||
| Type I diabetes mellitus | ↓ | ↓ | ||
| Valine, leucine and isoleucine degradation | ↑ | ↑ |
ME, Myometrium Early Pregnant Period; ML, Myometrium Late Pregnant Period; OE, Ovary Early Pregnant Period; OL, Ovary Late Pregnant Period. ” ↑” represents up regulation, ” ↓” represents down regulation.
Generation of EP and LP signature networks
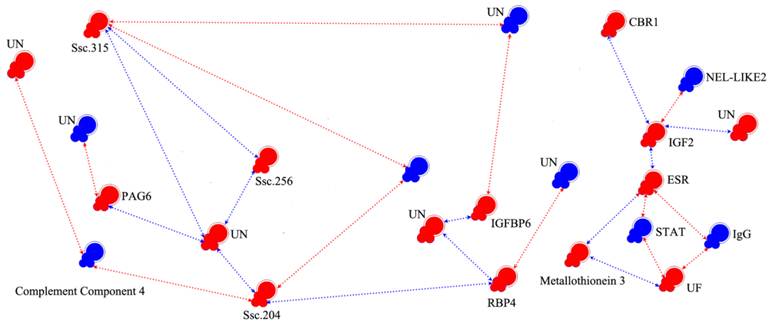
We chose 237 (5-fold changes) and 704 transcripts (3-fold changes) for EP and LP, respectively, as nodes to reconstruct the pregnancy gene regulatory network. As shown in Supplementary Material: Fig.S1, the network was composed with nodes representing genes and regression edges indicating the relationship of each gene. Ordinarily speaking, if a transcript has more feedback edges, it will have a larger effect and thus would be considered a key gene. For example, among the 237 nodes of the network, m6, m140, m158 and m178 were key nodes. In order to clarify the network of known reproduction related genes, we eliminated the majority of unknown genes and genes which had no feedback edges. Finally, we obtained the interaction model (Fig. 3 and Table 4), showing that IGF2 and ESR interact with each other directly; the neural tissue-specific epidermal growth factor-like repeat domain-contained protein (NEL-LIKE2, NELL2) have down-regulated effect to ESR through IGF2; the STAT and IgG have negative effect to ESR and UF in the ESR-signal transducer and activator of transcription (STAT)-UF and ESR-IgG-UF pathway. In the ESR-metallothionein 3-UF pathway, the metallothionein 3 has positive effect to ESR and UF. Transmembrane 4 superfamily member 10 and pregnancy-associated glycoprotein 6 (PAG6) can be regulated by glutathione peroxidase and two unknown transcripts, respectively. The selected network also showed that some unknown genes play important roles in the regulation of pregnancy.
Interaction networks of candidate genes. Colored symbols (nodes) represent genes. Red and blue nodes correspond to genes with microarray data showing significant up- and down-regulation, respectively. The line and arrowheads represent the directions of interaction. Red line and arrowheads indicate the repressing roles of genes, blue line and arrowhead indicate the promoting roles. ESR: Estrogen Receptor, UF: Uteroferrin, CBR1: Carbonyl Reductase1, IGFBP: Insulin-like Growth Binding Proteins, RBP4: Retinol-Binding Protein-4, STAT: Signal Transducer and Activator of Transcription, PAG6: Pregnancy-Associated Glycoprotein 6, HFABP: Heart-Adipocyte Fatty Acid-Binding Protein, IgG: Immunoglobulin G, NEL-LIKE2: Neural Tissue-Specific Epidermal Growth Factor-Like Repeat Domain-Contained Protein, IGF2: Insulin-Like Growth Factor II.
Annotation of genes involved in the interaction model
| Gene Symbol | Gene Annotation | Fold Changes (Log 2 ratio) | FDR (q) |
|---|---|---|---|
| ESR | Estrogen Receptor | 3.9 | 7.32E-04 |
| UF | Uteroferrin | 8.9 | 2.44E-04 |
| CBR1 | Carbonyl Reductase1 | 9.6 | 2.44E-04 |
| IGFBP6 | Insulin-like Growth Binding Proteins 6 | 4.9 | 2.44E-04 |
| RBP4 | Retinol-Binding Protein-4 | 5.5 | 2.44E-04 |
| STAT | Signal Transducer and Activator of Transcription | -2.7 | 1.22E-03 |
| PAG6 | Pregnancy-Associated Glycoprotein 6 | 8.9 | 2.44E-04 |
| IgG | Immunoglobulin G | -5.5 | 1.93E-03 |
| NELL2 | Neural Tissue-Specific Epidermal Growth Factor-Like Repeat Domain-Contained Protein | -3.8 | 1.42E-03 |
| IGF2 | Insulin-Like Growth Factor II | 5.5 | 1.93E-03 |
| - | Metallothionein 3 | 1.6 | 7.32E-04 |
| - | Complement Component 4 | -3.5 | 1.93E-03 |
| Ssc.204 | take part in pregnancy regulation | 3.2 | 2.44E-04 |
| Ssc.315 | may have effect to embryo development | 3.1 | 4.88E-04 |
| Ssc.256 | may have direct relationship with pregnancy | 2.1 | 2.44E-04 |
Fold Changes (Log 2 ratio): Gene expression level following LP myometrium compared to NP myometrium, “≥1.0” represents up regulation, “≤1.0” represents down regulation. FDR: Estimate False Discovery Rate
Candidate gene selection, gene cloning and chromosomal mapping
Transcripts which have more than ten feedback edges were selected to do further research. As most of these transcripts without definite functional information, BLAST searching against known genes in GenBank was done to predict their function. These transcripts with predicted functions were then searched in the cluster group. And finally, three transcripts (Table 5) which have similar functions with the cluster group were selected.
New gestation related candidate gene selection
| No. | Feedback Edges | Predicted Function |
|---|---|---|
| Ssc.204 | 16 | Similar with FP, take part in pregnancy regulation |
| Ssc.315 | 31 | Similar with DPPA, may have effect to embryo development |
| Ssc.256 | 13 | On the top layer of the network, may have direct relationship with pregnancy |
Feedback Edges: Number of transcripts connects with this transcript.
These completed cDNA sequences submitted to GenBank under the accession numbers FJ436413, FJ750950, and FJ603023 were 596 bp, 5003 bp and 2585 bp in length and localized to chromosome regions of 1p1.3, 6q31-q32 and 4p12-p13, respectively (Table 1). Furthermore, we BLAST searched these completed cDNA sequences in the Ensembl genome browser version Sus scrofa 9 (http://www.ensembl.org) for physical mapping. These three sequences located on chromosome 1, 6 and 4 were confirmed to be development pluripotency associated 5 (DPPA5), prostaglandin F receptor (FP) and T-cell differentiation protein 2 (MAL2), respectively. After amplification, the full coding sequences (CDS) of these three genes were acquired, and the full DNA sequence lengths of DPPA5, FP and MAL2 were determined to be 1.12 kb, 43.35 kb and 22.31 kb, respectively.
Association analysis
After sequencing the DNA of six breeds, 11 nucleotide mutations were identified in these three genes (Table 2). Three of them were missense mutations. Two missense mutations g.363 T>C (Cys 93 Arg) and g.844 G>T (Arg 101 Leu) were found in exon 2 and exon 3 of the porcine DPPA5 gene, respectively. The allelic frequencies and genotype frequencies of g.363 T>C, which had lower polymorphism information content (PIC), were in Hardy-Weinberg equilibrium (p > 0.05) by chi-square analysis in both Beijing Black and Large White populations. On the contrary, the allelic frequencies and genotype frequencies of g.844 T>C were in disequilibrium (p < 0.01) in both breeds and had intermediate PIC. The mutation g.363 T>C was significantly associated with litter born weight at later parities in Beijing Black pigs (Table 6, p < 0.05). Besides, at later parities, DPPA5 g.844 G>T was associated with the total number of births in Beijing Black pigs (Table 7, p < 0.05) and with litter born weight in Large White pigs (Table 7, p < 0.01).
Association between genotype of g.363 T>C and reproductive traits
| Breeds | Parity | Traits | (μ ± SE) Genotype | ||
|---|---|---|---|---|---|
| TT | TC | CC | |||
| BB | FP | N | 177 | 68 | 5 |
| TNB | 9.38 ± 0.20 | 9.59 ± 0.34 | 9.01 ± 1.20 | ||
| NBA | 8.45 ± 0.20 | 8.95 ± 0.35 | 7.80 ± 1.47 | ||
| LWB | 9.57 ± 0.24 | 9.99 ± 0.39 | 9.49 ± 1.83 | ||
| LP | N | 189 | 70 | 3 | |
| TNB | 11.57 ± 0.22 | 11.93 ± 0.36 | 10.35 ± 1.67 | ||
| NBA | 9.63 ± 0.21 | 10.07 ± 0.32 | 8.88 ± 1.00 | ||
| LWB | 10.77 ± 0.26a | 11.36 ± 0.39ab | 13.17 ± 3.21b | ||
| LW | FP | N | 3 | 32 | 140 |
| TNB | 9.52 ± 1.86 | 10.82 ± 0.47 | 11.07 ± 0.25 | ||
| NBA | 8.52 ± 2.00 | 9.82 ± 0.45 | 10.02 ± 0.25 | ||
| LWB | 10.36 ± 2.82 | 13.55 ± 0.68 | 13.68 ± 0.35 | ||
| LP | N | 3 | 31 | 136 | |
| TNB | 11.41 ± 0.88 | 9.95 ± 0.63 | 9.53 ± 0.30 | ||
| NBA | 9.41 ± 0.88 | 8.38 ± 0.67 | 8.33 ± 0.30 | ||
| LWB | 13.56 ± 1.91 | 14.11 ± 1.08 | 13.55 ± 0.46 | ||
BB, Beijing Black; LW, Large White; FP, First parity; LP, Later parities; all data in the table are least square means ± standard error. a, b Means with different superscripts differ (P < 0.05).
Association between genotype of g.844 G>T and reproductive traits
| Breeds | Parity | Traits | (μ ± SE) Genotype | ||
|---|---|---|---|---|---|
| GG | GT | TT | |||
| BB | FP | N | 51 | 72 | 117 |
| TNB | 9.24 ± 0.35 | 9.56 ± 0.30 | 9.56 ± 0.27 | ||
| NBA | 8.66 ± 0.35 | 8.61 ± 0.30 | 8.61 ± 0.28 | ||
| LWB | 9.84 ± 0.42 | 9.75 ± 0.37 | 9.68 ± 0.31 | ||
| LP | N | 64 | 66 | 115 | |
| TNB | 11.42 ± 0.39ab | 12.00 ± 0.33a | 10.80 ± 0.30b | ||
| NBA | 9.59 ± 0.37 | 9.78 ± 0.30 | 9.34 ± 0.27 | ||
| LWB | 10.44 ± 0.43 | 11.03 ± 0.40 | 10.56 ± 0.35 | ||
| LW | FP | N | 29 | 19 | 114 |
| TNB | 10.25 ± 0.37 | 10.70 ± 0.80 | 10.73 ± 0.29 | ||
| NBA | 9.54 ± 0.36 | 9.56 ± 0.68 | 9.76 ± 0.29 | ||
| LWB | 13.72 ± 0.41 | 13.26 ± 0.85 | 13.53 ± 0.60 | ||
| LP | N | 30 | 18 | 112 | |
| TNB | 10.13 ± 0.56 | 11.14 ± 0.81 | 9.31 ± 0.35 | ||
| NBA | 8.69 ± 0.55 | 9.99 ± 0.75 | 8.01 ± 0.35 | ||
| LWB | 14.40 ± 0.87AB | 16.86 ± 1.15A | 12.97 ± 0.53B | ||
BB, Beijing Black; LW, Large White; FP, First parity; LP, Later parities; all data in the table are least square means ± standard error. a, b Means with different superscripts differ (P < 0.05). A ,B Means with different superscripts differ (P < 0.01).
A synonymous mutation, g.546 A>G (182 Ser), was detected in exon 1 of the FP gene. The allelic frequencies and genotype frequencies were in Hardy-Weinberg equilibrium (p > 0.05) in both Beijing Black and Large White populations by chi-square analysis, and it had intermediate PIC and no significant relationship with any reproductive traits in either of the two pig populations.
In exon 3 of the MAL2 gene, two missense mutations, g.18862 C>A (Gln 138 Lys) and g.18865 C>G (Pro 139 Ala), were found with intermediate PIC. In contrast with g.18862 C>A, Hardy-Weinberg disequilibrium (p < 0.01) was detected in both allelic frequencies and genotype frequencies of g.18865 C>G in the two pig populations. No significant associations among the different genotypes of the two polymorphisms with any reproductive traits in either Beijing Black or Large White populations were found.
Discussion
Successful progression through pregnancy requires complex molecular signals that impact the reproductive performance of the sow. The Porcine Affymetrix GeneChipTM is useful for studying the complicated gene regulatory network during pregnancy. In order to minimize confounding factors, we used half sibling pigs in one farm to build the research population. Moreover, all pigs were sacrificed at the same time, and the collected samples were homozygous.
In order to validate the differential expression of various genes identified using the microarray, six transcripts with different range of fold changes were selected for QPCR analyses. In EP myometrium, four transcripts were up-regulated from 1.01- to 118.64-folds, and two transcripts were down-regulated 8.67- and 44.07-folds. In the LP myometrium, five transcripts were up-regulated from 1.01- to 39.25-folds, and one transcript was down-regulated 3.98-folds. Fold changes (FCs) measured by QPCR and microarrays were not completely consistent due to the greater quantitative accuracy provided by QPCR in comparison to microarrays, the differences in the dynamic range of the two techniques, and the lack of specificity in the primers designed to discriminate gene family members at the level of primary screening by DNA arrays[32]. And in our work, the correlation coefficient between QPCR and microarray data was 0.8828. However, the expression trends were similar, and the hypothesis test showed no significant difference in results between these two methods, indicating the reliability of our microarray data.
The cluster results showed that the EP and LP periods could be classified naturally which were consistent with current knowledge of pregnancy. This result indicates the reliability of not only our microarray data but also the cluster method itself.
In the GO analysis, we found that the expression of many genes changed over the course of pregnancy. Most represented functional groups were related to immune system response activation against external stimulus, integrated genes that regulate maternal homeostasis by complement and coagulation cascades, and the genes involved in lipid and fatty acid enzymes of metabolic processes, which participate in the steroidogenesis pathway, and similar result were reported by Amanda et al.(2011) [33].The expression of growth factors and transforming growth factor was far more different in EP than in other pregnancy periods, which also showed in the paper of Kayser et al.(2006) [34]. Previous research also showed that in the EP period, genes related to iron ion binding, lipid binding and immune defenses are highly expressed, which were consistent with our results [35]. Although the exact same results were not obtained, similar trends were observed in GO analysis as with the expression data. Anyhow, from the GO annotation terms analysis, we could obtain the DE genes, MF, BP and MM representation in different period of pig pregnancy which may be helpful for the preliminary understanding of pig reproductive system.
In order to investigate how these genes work together and better understanding the pig reproductive system, pathway analysis were employed. From the pathways (Table 3), we can acquire the mechanisms of immune response, material transportation, cell growth, regulation of cell size and cell cycle related genes affecting pregnancy. For example, in steroid hormone biosynthesis pathway (Supplementary Material: Fig. S2A), 11-beta hydroxysteroid dehydrogenase isoform 1, cytochrome P450 family, hydroxy-delta-5-steroid hydrogenase, 3 beta-and steroid delta-isomerase 1, hydroxysteroid (11-beta) dehydrogenase 2, UDP-glucuronosyltransferase, catechol-O-methyltransferase, steroid 5-alpha-reductase 2 and sulfotransferase family 1E were all up-regulated in EP and LP myometrium. These transcripts are wide-ranging distributed and mainly act on the estrone, cortisol, dehydroepiandrosterone and so on. This result suggested that node genes, even node genes that are not DE in the pathway, such as 3-beta-hydroxysteroid dehydrogenase (3beta-HSD) [36, 37] in steroid hormone biosynthesis pathway, may play important roles in regulating sow pregnancy.
Studying genes at the pathway level is also important to identify the potential function pattern of interesting positional candidate genes. For example, OPN is a controversial gene which could affect pig production traits. To our knowledge, OPN belongs to the small integrin-binding ligand N-linked glycoprotein (SIBLING) family of proteins known to interact with cell-surface integrins via their Arg-Gly-Asp (RGD) sequence and to associate with mineral via their phosphate groups and stretches of acidic amino acid residues [38]. Few reports have been found to study the mechanism of OPN gene influencing pregnancy. In ECM-receptor pathway we have detected (Supplementary Material: Fig. S2B), the Ssc.101.1.S1_at (OPN), Ssc.16663.1.S1_at (similar to integrin, alpha 5 (Fibronectin receptor, alpha polypeptide)) and Ssc.924.3.A1_at (Thrombospondin 1) were all up- (in LP myometrium) or down- regulated (in LP ovary). This result indicated that the three genes could cooperate with each other. The OPN gene locus mutation may result in the decrease expression of OPN protein and finally inhibit the expression of fibronectin receptor and thrombospondin 1 to influence sow pregnancy.
In our work, gene regulatory networks were reconstructed using a pure mathematical method with differentially expressed sequences obtained from different periods during pig pregnancy, which were seldom reported in previous research. The method is based on linear programming and a decomposition procedure. It can be used not only for time-point experiment design in different conditions for inferring gene regulatory networks but also for new gene regulatory relationship prediction. And some works about gene network construction using this method has been reported [39-41].
Although many approaches such as robust testing can be used to verify the results based on serial mathematical calculations, there is no direct method to determine the biological feasibility of the network, especially with so many unknown transcripts. One potential solution is to pre-digest the networks and to perform the analysis with known gene information. And fortunately, the interaction model (Fig. 3) we pre-digested can be partly validated by traditional research: insulin-like growth binding proteins (IGFBP) 2, 3 & 4, as well as ESR, indicate co-activation of IGF and ESR signaling [42-45], and the expression of ESR is known to be regulated by STAT [46]. Estrogen could stimulate NELL2 transcription by binding to the two half-EREs, and the NELL2 gene is trans-activated by ESR [47]. Similar result was also found in our work. From the model we can also see that although some genes such as IGFBP6 and retinol-binding protein-4 (RBP4), which may play important roles in the regulation of pregnancy [48], are in important positions in the network and connect only with unknown genes.
Analysis of the regulatory networks demonstrated that in selecting candidate genes related to reproductive traits, the genes interacting with them should first be analyzed. For example in this study, choosing STAT, or IGF2 and STAT, or IGF2 and ESR at the same time maybe better than choosing ESR. The effect of genes such as STAT, IGF2 and UF in the same network should be ascertained. Once one gene is confirmed to play a more important role than others, this gene can be used to take the place of ESR. The same case may exist in different small networks such as the IGFBP6 and RBP4 network. Some researchers have used the interactions between gene polymorphisms as a tool for the selection of prolific pigs [49]. Many potential networks identified in this study clearly merit further investigation.
Another highlight of our research is that several unknown genes were considered as candidate genes for reproductive traits. The Ssc.204 transcript is located in the middle of the network with a length of 806 bp. By alignment, we found that it is similar to the human FP gene, which is known to play an important role in pregnancy and development of normal mouse fetuses [50, 51]. In our study, the mRNA expression of FP in the EP and LP myometrium is constantly changing and in particular plays a key role in initiation of parturition. The 576 bp Ssc.315 transcript is located in the top of the network and is 85% similar to the human DPPA5 gene. DPPA5 was first found in mouse embryonal carcinoma cells (ECCs) and is important for embryonic growth [52]. DPPA5 is also known to be expressed in primordial germ cells of the early embryo [53], but whether the DPPA5 gene plays a role in the degeneration of ovarian oocytes specifically in eutherian mammals requires further investigation [54]. The Ssc.256 transcript, which was highly expressed in both EP and LP and also located at the top of the network, contains a signal peptide domain and a low overlap domain in its amino acid sequence, similar to the MAL2 gene. As the MAL gene functions in vesicular transport carriers or tight junction regulation [55], the Ssc.256 transcript may play an important role in placenta material transportation. Association analysis indicated that, instead of FP and MAL2, polymorphisms of DPPA5 were found to associate with reproduction traits significantly.
In summary, we have identified the global changes in gene expression in porcine ovary and myometrium during different pregnancy periods. Our results indicated that a series of genes are activated after pregnancy, particularly genes related immune response, material transportation, cell growth, regulation of cell size and cell cycle. This founding could contribute to explaining the complicated mechanism of pig pregnancy process. The reconstructed gene regulatory network provided us with some key genes which may be important to reproduction. In addition, the interaction model of the known and unknown candidate genes related to reproduction can also be pre-digested from the network. We identified polymorphisms of some key genes in reconstructed network could significantly associated with reproduction traits. The present microarray analysis provides new information to increases our understanding of the pig pregnancy.
Supplementary Material
Table S1 - S17 and Fig.S1 - S2.
Acknowledgements
This research was supported by the National Key Technology R&D Program of China (No.2011BAD28B01), earmarked fund for Modern Agro-industry Technology Research System, and Chinese Academy of Agricultural Sciences Foundation (No.2011cj-5). We thank Dr. Hongbo Chen (Wuhan Polytechnic University) and Zhengkui Zhou (Chineses Academy of Sciences) for the final read-through of the manuscript.
Competing Interests
The authors have declared that no competing interest exists.
References
1. Rothschild MF, Vincent AL, Tuggle CK. et al. A mutation in the prolactin receptor gene is associated with increased litter size in pigs. Anim Genet. 1998;29:60-74
2. Evans AC, Forde N, O'Gorman GM. et al. Use of microarray technology to profile gene expression patterns important for reproduction in cattle. Reprod Domest Anim. 2008;43(Suppl 2):S359-S367
3. Gladney CD, Bertani GR, Johnson RK. et al. Evaluation of gene expression in pigs selected for enhanced reproduction using differential display PCR and human microarrays: I. Ovarian follicles. J Anim Sci. 2004;82:17-31
4. Hu ZL, Dracheva S, Jang WH. et al. A QTL resource and comparison tool for pigs: PigQTLDB. Mamm Genome. 2005;16:792-800
5. Yan H, Wang LX, Wang LG. et al. Genetic polymorphism of six genetic loci and their correlation with reproductive traits. Journal of Agricultural Biotechnology. 2009;17:249-255
6. Melville JS, Gibbin AM, Robinson JA. et al. A Meishan positive QTL for prolificacy traits found at the NCOA1 locus on SSC3. Proceedings of the 7th World Congress on Genetics Applied to Livestock Production. 2002:19-23
7. Kossakowska K, Danura C, Cieslak D. et al. The polymorphism of the reproduction-linked in line 990 sows. Anim Sci Pap Rep. 2001;19:265-276
8. Putnova L, Knol A, Drorak J. et al. A new HpaⅡ PCR-RFLP within the porcine prolactin receptor (PRLR) gene and study of its effect on litter size and number of teats. J Anim Breed Genet. 2002;119:57-63
9. Kmieć M, Dybus A, Terman A. Prolactin receptor gene polymorphism and its association with litter size in polish landrace. Archiv fur Tierzucht (Dummerstorf). 2001;44:547-551
10. Linville RC, Pomp D, Johnson RK. et al. Candidate gene analysis for loci affecting litter size and ovulation rate in swine. J Anim Sci. 2001;79:60-67
11. Shi QS, Liu XC, Liu Z W. et al. Effect of five genetic loci related to pig litter size. J Hereditas. 2006;28(6):652-658
12. Short TH, Rothschild MF, Southwood O. et al. Effect of the estrogen receptor locus on reproduction and production traits in four commercial pig lines. J Anim Sci. 1997;75:3138-3142
13. Isler BJ, Irvin KM, Neal SM. et al. Examination of the relationship between the estrogen receptor gene and reproductive traits in swine. J Anim Sci. 2002;80:2334-2339
14. Zhao YF, Li N, Xiao L. et al. The retrotransponsons insert mutation of pig FSHβ subunit gene and correlation with litter size. Sci China Ser C. 1999;29:81-86
15. Kmieć M, Terman A. Polymorphism in the PRLR/AluI gene and its effect on litter size in Large White sows. Anim Sci Pap Rep. 2004;22:523-527
16. Bonnet A, La Cao KA, SanCristobal M. et al. In vivo gene expression in granulosa cells during pig terminal follicular development. Reproduction. 2008;136:211-24
17. Ross JW, Ashworth MD, Stein DR. et al. Identification of differential gene expression during porcine conceptus rapid trophoblastic elongation and attachment to uterine luminal epithelium. Physiol Genomics. 2009;36:140-148
18. Sun XJ, Mei SQ, Tao H. et al. Microarray profiling for differential gene expression in PMSG-hCG stimulated preovulatory ovarian follicles of Chinese Taihu and Large White sows. BMC Genomics. 2011;12:111
19. Amanda FR, Maria M, Almudena F. et al. Differential Gene Expression in Ovaries of Pregnant Pigs with High and Low Prolificacy Levels and Identification of Candidate Genes for Litter Size. Biol Reprod. 2011;84(2):299-307
20. Vanroose G, Kruif A, Soom AV. Embryonic mortality and embryo-pathogen interactions. Ani Repro Sci. 2000;60-61:131-143
21. Brazma A, Hingamp P, Quackenbush J. et al. Minimum information about a microarray experiment (MIAME)-toward standards for microarray data. Nat Genet. 2001;29:365-371
22. Pfaffl MW. A new mathematical model for relative quantification in real-time RT-PCR. Nucleic Acids Res. 2001;29(9):e45
23. Storey JD. A direct approach to false discovery rates. J R Stat Soc Ser B. 2002;64:479-498
24. Chu L, Scharf E, Kondo T. GeneSpring: Tools for Analyzing Microarray Expression Data. Genome Informatics. 2001;12:227-229
25. Huang DW, Sherman BT, Lempick RA. Systematic and integrative analysis of large gene lists using DAVID Bioinformatics Resources. Nat Protoc. 2009;4:44-57
26. Milan D, Hawken R, Cabau C. et al. IMpRH server: an RH mapping server available on the Web. Bioinformatics. 2000;16:558-559
27. Clifford W. Mason, BA, Peter W, et al. Identification of interactive gene networks: A novel approach in gene array profiling of myometrial events during guinea pig pregnancy. Obstet Gynecol. 2006;194:1513-1523
28. Wang Y, Trupti J, Zhang XS. et al. Inferring Gene Regulatory Networks from Multiple Microarray Datasets. Bioinformatics. 2006;22:2413-2420
29. Ellson J, Gansner E, Koutsofios L. et al. Graphviz and Dynagraph - Static and Dynamic Graph Drawing Tools. Graph Drawing Software. 2003:127-148
30. Draghici S, Khatri P, Tarca AL. et al. A system s biology approach for pathway level analysis. Genome Res. 2007;17:1537-1545
31. Zhang YH, Mei SQ, Peng XW. et al. Molecular characterization and SNPs analysis of the porcine Deleted in AZoospermia Like (pDAZL) gene. Anim Reprod Sci. 2009;112:415-422
32. Chen HB, Li CC, Fang MD. et al. Understanding Haemophilus parasuis infection in porcine spleen through a transcriptomics approach. BMC Genomics. 2009;10:64-81
33. Amanda FR, Maria M, Almudena F. et al. Differential Gene Expression in Ovaries of Pregnant Pigs with High and Low Prolificacy Levels and Identification of Candidate Genes for Litter Size. Biol Reprod. 2011;84:299-307
34. Kayser JP, Kim JG, Cerny RL. et al. Global characterization of porcine intrauterine proteins during early pregnancy. Reproduction. 2006;131:379-388
35. Vallet JL, Christenson RK, McGuire WJ. Association between uteroferrin, retinol-binding protein, and transferrin within the uterine and conceptus compartments during pregnancy in swine. Biol Reprod. 1996;55:1172-1178
36. Senthilkumaran B, Sudhakumari CC, Wang DS. et al. Novel 3beta-hydroxysteroid dehydrogenases from gonads of the Nile tilapia: phylogenetic significance and expression during reproductive cycle. Mol Cell Endocrinol. 2009;299:146-152
37. Villeneuve DL, Blake LS, Brodin JD. et al. Effects of a 3beta-hydroxysteroid dehydrogenase inhibitor, trilostane, on the fathead minnow reproductive axis. Toxicol Sci. 2008;104:113-123
38. Kaartinen MT, Murshed M, Karsenty G. et al. Osteopontin upregulation and polymerization by transglutaminase 2 in calcified arteries of matrix gla proteindeficient mice. J Histochem Cytochem. 2007;55:375-386
39. Wang L, Sun Y, Jiang M. et al. FOS proliferating network construction in early colorectal cancer (CRC) based on integrative significant function cluster and inferring analysis. Cancer Invest. 2009;27:816-824
40. Wang L, Sun Y, Jiang M. et al. Integrative decomposition procedure and Kappa statistics for the distinguished single molecular network construction and analysis. J Biomed Biotechnol. 2009:726-728
41. Huang JX, Wang L, Jiang MH. TNFRSF11B computational development network construction and analysis between frontal cortex of HIV encephalitis (HIVE) and HIVE-control patients. J Inflamm -Lond. 2010;7:50-57
42. Lemmey A, Maddison P, Breslin A. et al. Association between insulin-like growth factor status and physical activity levels in rheumatoid arthritis. J Rheumatol. 2001;28:29-34
43. Moussad EE, Rageh MA, Wilson AK. et al. Temporal and spatial expression of connective tissue growth factor (CCN2;CTGF) and transforming growth factor beta type 1 (TGF-beta 1) at the utero-placental interface during early pregnancy in the pig. Mol Pathol. 2002;55:186-192
44. Dahlman WK, Cavailles V, Fuqua SA. et al. International Union of Pharmacology. LXIV. Estrogen receptors. Pharmacol Rev. 2006;58:773-781
45. Pacher M, Seewald MJ, Mikula M. et al. Impact of constitutive IGF1/IGF2 stimulation on the transcriptional program of human breast cancer cells. Carcinogenesis. 2007;28:49-59
46. Joyce MM, Burghardt RC, Geisert RD. et al. Pig Conceptuses Secrete Estrogen and Interferons to Differentially Regulate Uterine STAT1 in a Temporal and Cell Type-Specific Manner. Endocrinology. 2007;148:4420-4431
47. Choi EJ, Kim DH, Kim JG. et al. Estrogen-dependent transcription of the NEL-like 2 (NELL2) gene and its role in protection from cell death. J Biol Chem. 2010;285(32):25074-84
48. Gadd TS, Osgerby JC, Wathes DC. Regulation of insulin-like growth factor binding protein-6 expression in the reproductive tract throughout the estrous cycle and during the development of the placenta in the ewe. Biol Reprod. 2002;67:1756-1762
49. Gonçalves IDV, Gonçalves PBD, Silva JC. et al. Interaction between estrogen receptor and retinol-binding protein-4 polymorphisms as a tool for the selection of prolific pigs. Genet Mol Biol. 2008;31:481-486
50. Sugimoto Y, Yamasaki A, Segi E. et al. Failure of Parturition in Mice Lacking the Prostaglandin F Receptor. Science. 1997;277:681-683
51. Olson DM, Zaragoza DB, Shallow MC. et al. Myometrial Activation and Preterm Labour: Evidence Supporting a Role for the Prostaglandin F Receptor—A Review. Placenta. 2003;24:S47-S54
52. Kim SK, Suh MR, Yoon HS. et al. Identification of developmental pluripotency associated 5 expression in human pluripotent stem cells. Stem Cells. 2005;23:458-462
53. Mitsui K, Tokuzawa Y, Itoh H. et al. he homeoprotein Nanog is required for maintenance of pluripotency in mouse epiblast and ES cells. Cell. 2003;113:631-642
54. Pierre A, Gautier M, Callebaut I. et al. Atypical structure and phylogenomic evolution of the new eutherian oocyte and embryo expressed KHDC1/DPPA5 /ECAT1/OOEP gene family. Genomics. 2007;90:583-594
55. Sánchez PL, Martín BF, Valencia A. et al. MARVEL: a conserved domain involved in membrane apposition events. Trends Biochem Sci. 2002;27(12):599-601
Author Biography
Dr. Lixian Wang heads the Pig Science Group, which focuses on pig breeding and the molecular mechanisms of porcine meat quality, reproduction, health, and production. The group is housed in Institute of Animal Science, Chinese Acadmy of Agricultural Sciences. Dr. Wang is a famous research scientist in China and with support by fund of National Key Technology R&D Program of China (2006-2008, 2008-2010, 2011-2015), National High-Tech Research and Development Program (2008-2010), earmarked fund for Modern Agro-industry Technology Research System.
Mr. Ligang Wang is a candidate Ph.D and has been engaged in pig genetics and breeding research, and has especially accumulated a wealth of experience in the study that elucidates the genetic and molecular mechanism in pig performance.
Dr. Longchao Zhang is one of the members of Pig Science Group, Institute of Animal Science, Chinese Acadmy of Agricultural Sciences. Dr. Zhang is a research scientist with 10 years of research experience in the animal science area and with support by fund of National Key Technology R&D Program of China (2008-2010), National Key Technology R&D Program of China (2011-2015), and Chinese Academy of Agricultural Sciences Foundation (2007-2013). He focuses on the research for reproduction, meat quality traits, and health in pigs.
![]() Corresponding author: Lixian Wang, Institute of Animal Science, Chinese Academy of Agricultural Sciences, Beijing 100193, China. Fax: +86-10-62818771. Email: iaswlxnet
Corresponding author: Lixian Wang, Institute of Animal Science, Chinese Academy of Agricultural Sciences, Beijing 100193, China. Fax: +86-10-62818771. Email: iaswlxnet