Impact Factor ISSN: 1449-2288

 Global reach, higher impact
Int J Biol Sci 2012; 8(4):580-595. doi:10.7150/ijbs.3614 This issue Cite
Research Paper
Genome-Wide Association Analysis of Meat Quality Traits in a Porcine Large White × Minzhu Intercross Population
Weizhen Luo1*, Duxue Cheng1*, Shaokang Chen2*, Ligang Wang1, Yong Li1, Xiaojun Ma1, Xin Song3, Xin Liu1, Wen Li1, Jing Liang1, Hua Yan1, Kebin Zhao1, Chuduan Wang2 ![]() , Lixian Wang1
, Lixian Wang1 ![]() , Longchao Zhang1
, Longchao Zhang1 ![]()
1. Key Laboratory of Farm Animal Genetic Resources and Germplasm Innovation of Ministry of Agriculture of China, Institute of Animal Science, Chinese Academy of Agricultural Sciences, 100193 Beijing, China.
2. College of Animal Science and Technology and State Key Laboratory of Agrobiotechnology, China Agricultural University, 100193 Beijing, China.
3. College of Veterinary Medicine, Sichuan Agricultural University, 625014 Ya'an, China.
* These authors contributed equally to this work.
Received 2011-10-9; Accepted 2012-3-19; Published 2012-4-18
Abstract
Pork quality is an economically important trait and one of the main selection criteria for breeding in the swine industry. In this genome-wide association study (GWAS), 455 pigs from a porcine Large White × Minzhu intercross population were genotyped using the Illumina PorcineSNP60K Beadchip, and phenotyped for intramuscular fat content (IMF), marbling, moisture, color L*, color a*, color b* and color score in the longissimus muscle (LM). Association tests between each trait and the SNPs were performed via the Genome Wide Rapid Association using the Mixed Model and Regression-Genomic Control (GRAMMAR-GC) approach. From the Ensembl porcine database, SNP annotation was implemented using Sus scrofa Build 9. A total of 45 SNPs showed significant association with one or multiple meat quality traits. Of the 45 SNPs, 36 were located on SSC12. These significantly associated SNPs aligned to or were in close approximation to previously reported quantitative trait loci (QTL) and some were located within introns of previously reported candidate genes. Two haplotype blocks ASGA0100525-ASGA0055225-ALGA0067099-MARC0004712-DIAS0000861, and ASGA0085522-H3GA0056170 were detected in the significant region. The first block contained the genes MYH1, MYH2 and MYH4. A SNP (ASGA0094812) within an intron of the USP43 gene was significantly associated with five meat quality traits. The present results effectively narrowed down the associated regions compared to previous QTL studies and revealed haplotypes and candidate genes on SSC12 for meat quality traits in pigs.
Keywords: F2 design, genome-wide association study, meat quality trait, pig, SNP.
Introduction
Consumer attitudes towards pork are often influenced by sensory attributes such as odor, flavor, tenderness and juiciness, in addition to physical and biochemical parameters such as pH, shear force, water holding capacity and intramuscular fat content [1]. Even though some parameters, such as fat distribution, can be predicted using computed tomography (CT) scanning, others such as moisture and meat color can only be measured after slaughtering the pigs. For breeding stock, some traits can only be predicted using related animal information. The detection of markers associated with these traits is necessary for marker-assisted selection (MAS) which could improve early selection and enormously decrease the cost of breeding for meat quality trait optimization. Since the initial report of quantitative trait loci (QTLs) for meat quality traits by Andersson-Eklund [2], approximately 4,434 off these QTLs were identified via genome scanning based on linkage analyses (http://www.animalgenome.org/cgi-bin/QTLdb/SS/index, Apr 20, 2011). As a result of the low density of currently detected microsatellite markers, QTLs are often mapped to a large interval of 20 centimorgans (cM) or more. Only a few quantitative trait nucleotides (QTN) have been identified on the basis of results for complex traits in domestic animals via QTL fine mapping analysis [3-6]. The current porcine 60K SNP panel provides more density than the available microsatellite markers and contributes to improved accuracy in finding the exact QTL locations.
Genome-wide panels of SNPs have been developed in many species. Genome-wide association studies (GWAS) that survey most of the genome using genetic variants [7] have been conducted and applied widely in the analysis of human diseases and complex traits. Furthermore, this approach has been applied to detect SNPs associated with many complex traits in livestock [8-13]. In the present study, a GWAS was performed using the PorcineSNP60 Genotyping BeadChip (Illumina, San Diego, CA, USA) to detect potential genetic variants associated with meat quality traits in a porcine Large White × Minzhu intercross population.
Materials and methods
Animals
Minzhu is a pig breed indigenous to northeast China. Average environmental temperatures of 4°C/year are experienced in this region and in response, the Minzhu breed has developed excellent characteristics of fat deposition, with 5.1 cm back fat thickness and 5% intramuscular fat content (IMF) in the longissimus muscle (LM) at 240 days of age [14].
In this study, a three-generation resource population was produced by intercrossing Large White boars and Minzhu sows during the period from 2007 to 2011. Four Large White boars were mated with 16 Minzhu sows. The resulting F1 generation, comprising nine sires and 46 dams were mated (avoiding full-sib mating) to produce 455 F2 animals (88 litters) in three parities. Most sows were mated to the same boar for all three parities to provide large, full-sib populations. The average number of offspring per sire was 51. Male pigs of the F2 generation were castrated. All F2 animals were reared on the same feeding conditions at the pig research station of the Institute of Animal Science at the Chinese Academy of Agricultural Sciences.
Phenotypic data
Phenotypic data of seven meat quality traits were recorded by trained personnel for all F2 individuals following the guidelines of the National Pork Producers Council (NPPC 1991) of the USA. All F2 animals were slaughtered at the age of 240 ± 7 d in 48 batches (slaughter groups). After slaughter, carcasses were divided into ham, back, belly and shoulder portions, which were defatted and fully dissected. Chilled meat quality traits were evaluated 24 h post-slaughter. These traits included the subjective quality traits (marbling and color score) and objective quality traits (intramuscular fat content, moisture, color L*, color a* and color b*) in the LM (located between the 6th rib and the last lumbar vertebra). Meat color was assessed subjectively in terms of color score (CS) according to the color standard (1 = pale; 6 = dark) provided by the NPPC [15] and evaluated objectively using a CM-2600d/2500d Minolta Chroma Meter, where color L* represented lightness, color a* represented redness and color b* represented yellowness on the cut surface of the LM. Percentage meat moisture content was determined by the routine oven-drying method. Intramuscular fat (IMF) content was analyzed by a subjective NPPC photographic reference standard (1-10, with 1 = devoid, 10 = overly abundant) to determine marbling scores of LM at 24 h post-mortem and objectively using an ether extraction method (Soxtec Avanti 2055 Manual Extraction Unit, Foss Tecator).
Genotyping and quality control
Whole blood was collected from 20 F0, 55 F1 and 455 F2 animals for DNA isolation. Genotyping was performed using the PorcineSNP60 Genotyping BeadChip technology (Illumina), which contained 62,163 SNPs across the whole genome. BEADSTUDIO software (Illumina) was used to call the genotypes for all samples. Before quality control, the maximum likelihood method was applied using the Cervus program [16] to check pedigree mismatching using SNP information. After parentage identification, quality control procedures were performed for the 455 F2 animals within the R statistical environment using the GenABEL package [17]. Data were quality controlled for sample call rate, SNP call rate, minor allele frequency (MAF) and deviations from Hardy-Weinberg Equilibrium (HWE). The quality control procedure could be split into two steps: Firstly, gender errors were identified and secondly the residual errors were removed iteratively. At the first step of the iterative procedure, SNPs were excluded according to the following criteria: (1) call rate <90%; (2) MAF <3%; and (3) significant divergence from HWE with P-values lower than 10-6. At the second step of the iterative procedure, individuals were excluded with call rates <90%. The recursive procedure was applied till no further markers and individuals were eliminated. Application of the quality control procedures resulted in the following exclusions: one individual with a call rate <90%; 112 X-linked SNPs that were likely to be autosomal (odds >1,000), 3,989 SNPs with call rates <90%, 11,252 SNPs with MAF <3% and 1,466 SNPs with extreme HWE values (P<10-6).
Distribution of SNPs after quality control and average distances on each chromosome.
| Chromosome | No. SNPs | Average distance (kb)a |
|---|---|---|
| 1 | 5155 | 57.33 |
| 2 | 2112 | 72.58 |
| 3 | 1659 | 88.11 |
| 4 | 2903 | 49.73 |
| 5 | 1776 | 58.27 |
| 6 | 1505 | 114.05 |
| 7 | 2838 | 46.96 |
| 8 | 1770 | 84.73 |
| 9 | 2080 | 74.2 |
| 10 | 1094 | 70.97 |
| 11 | 1478 | 56.95 |
| 12 | 893 | 76.41 |
| 13 | 2860 | 76.09 |
| 14 | 3150 | 47.18 |
| 15 | 2025 | 83.67 |
| 16 | 1264 | 69.04 |
| 17 | 1314 | 45.26 |
| 18 | 901 | 65.31 |
| X | 668 | 197.74 |
| Y | 1 | |
| 0b | 10792 | |
| Total | 48238 |
aDerived from Sus scrofa Build 9 (http://pre.ensembl.org/Sus_scrofa_map/Info/Index).
bThese SNPs are not assigned to any chromosomes in the Illumina data.
The final data set that passed the quality control procedures and was used in the analysis contained 48,238 SNPs and 454 F2 individuals. The distribution of SNPs after quality control and the average distance between adjacent SNPs on each chromosome are shown in Table 1.
Statistical analysis
Genome-wide association analysis was performed via Genome-wide Rapid Association using the Mixed Model and Regression-Genomic Control (GRAMMAR-GC) approach [17, 18]. The procedure involved three steps:
Step 1: Data were analyzed using the mixed model:
y= 1µ + Xb + pw + Tc + Zα + e
where y is the vector of phenotypes of 454 F2 individuals, b is the vector of fixed effects (consisting of the sex, parity and batch which contained the herd-year-season effect), w is the vector of body weights of the individuals (considered as a covariate), c is the vector of litter effect (considered as a random effect, c~N(0,σc2), a is the vector of random additive genetic effects with a~N(0,Aσα2) (where A is the relationship matrix calculated from the corrected pedigree and σα2 is the additive genetic variance), X, T and Z are incidence matrices relating records in y to fixed and random effects, p is the regression coefficient of body weight and e is the vector of residual errors with e~N(0,Iσe2),where I is the identity matrix and σe2 is the residual variance. The vector of residuals y* is estimated as
y* = y - (1μ^ + X b^ + p^w + Tc^ + Za^)
where b^, p^, c^ and a^ are estimates and predictors for b, p, c and a, respectively.
Step 2: The residuals are used as the dependent trait and the associations are tested using single locus regression analysis:
y* = 1µ + kg + e*
where g is the vector of genotypes, k is the regression coefficient and e* is the vector of random residuals.
Step 3: In the GC procedure, the unadjusted test statistic factor of the ith SNP Ti2 is calculated as:
Ti2 = k^i2/var(k^i)
where k^i and var(k^i) are the estimate and sample variance of k, respectively. The deflation factor λ is estimated as λ = median(T12, T22, …, Ti2), where 0.456 is the median of χ(1)2 [19]. Association of the ith SNP with the trait is examined by comparison of T12/λ^ with χ(1)2.
Step 1 was performed using DMU software [20] and the remainder of the analysis was performed within the R statistical environment using the GenABEL package [17]. The genome-wide significance threshold was determined by the Bonferroni method, in which the conventional P-value was divided by the number of tests performed [21]. A SNP was considered to have genome-wide significance at P<0.05/N, where N is the number of SNPs tested in the analyses. In this study, N was 48,238 and the significant threshold was 1.037e-6.
Phenotypic correlations among the traits were calculated to investigate whether they reflect the correlation among GWAS results. Pearson correlation among the meat quality traits and significance tests were performed within the R statistical environment.
Haplotype block detection was performed on the chromosomal region which contained all the SNPs that were significantly associated with meat quality traits. The genotypes of those significant SNPs loci for 454 F2 individuals and their parents (55 F1 individuals) were used to detect the haplotype blocks. The HAPLOVIEW V3.31 program [22] was used to detect and visualize the haplotype blocks in this work. The procedure was run with default parameters following the manual for HAPLOVIEW program [22].
Association analysis of detected haplotype blocks and meat quality traits of 454 F2 individuals were performed using the Haplo.Stats package [23] within the R statistical environment. A score for each haplotype (hap-score) was calculated and P-value was also calculated for the significance of each hap-score. A positive/negative score for a particular haplotype would have suggested that the haplotype was associated with increased/decreased risk of the trait. The index of global score statistic, which had an asymptotic distribution with degrees of freedom (df) and P-value, was calculated to test overall associations among haplotype blocks and traits.
Population stratification
Population stratification is recognized as a major threat to the validity of GWAS results [24]. In this study, the influence of population stratification was assessed in a quantile-quantile (Q-Q) plot by examining the distribution of test statistics generated from association tests and the deviation from the null hypothesis of no SNP association with the trait was assessed. Overall deviation above the diagonal identity line in the initial stage may suggest population stratification. GWAS results with and without performing the genomic control (GC) procedures were compared in the “Q-Q” plot to access the effect of the method for population stratification adjustment. The “Q-Q” plot was constructed within the R statistical environment.
Results
Phenotype description and correlation among the traits
Means, standard deviations, minimum and maximum values of the traits measured in the current experiment are presented in Table 2. Means for IMF, marbling, moisture, color L*, color a*, color b* and color score were 2.85%, 2.88, 73.31%, 50.2, 14.08, 7.76 and 3.31, respectively. Phenotypic correlation coefficients among IMF, marbling, moisture, color L*, color a*, color b* and color score are shown in Table 3. High correlation coefficients were identified between IMF and marbling (r = 0.60; P < 0.01), IMF and moisture (r = -0.72; P < 0.01) and color L* and color score (r = -0.60, P < 0.01). Moderate correlation coefficients were identified between moisture and marbling (r = -0.43; P < 0.01), color L* and color a* (r = -0.30; P < 0.01), color L* and color b* (r = 0.41; P < 0.01), color a* and color b* (r = -0.46; P < 0.01) and color score and color a* (r = 0.39; P < 0.01). Low phenotypic correlation coefficients were identified between all other traits.
Descriptive statistics of meat quality traits for 455 individuals.
| Traits | Mean | Standard deviation | Minimum | Maximum |
|---|---|---|---|---|
| IMF | 2.85 | 1.79 | 0.73 | 12.70 |
| Marbling | 2.88 | 1.01 | 1.00 | 8.00 |
| Moisture | 73.31 | 1.91 | 61.28 | 85.36 |
| Color L* | 50.20 | 3.97 | 27.49 | 62.56 |
| Color a* | 14.08 | 1.77 | 9.62 | 19.64 |
| Color b* | 7.76 | 1.71 | 2.38 | 14.53 |
| Color score | 3.31 | 0.64 | 1.50 | 5.00 |
IMF, intramuscular fat content.
Correlation coefficients of phenotypes for meat quality traits.
| Traits | Marbling | Moisture | Color L* | Color a* | Color b* | Color Score |
|---|---|---|---|---|---|---|
| IMF | 0.60** | -0.72** | 0.04 | 0.14** | 0.20** | 0.23** |
| Marbling | -0.43** | 0.03 | -0.0017 | 0.17** | 0.29** | |
| Moisture | 0.01 | -0.18** | -0.03 | -0.16** | ||
| Color L* | -0.30** | 0.41** | -0.60** | |||
| Color a* | -0.46** | 0.39** | ||||
| Color b* | -0.19** |
* **P < 0.01
IMF, intramuscular fat content
Color L*, color a* and color b* represented three meat color traits lightness, redness and yellowness on the cut surface of the LM, respectively.
IMF
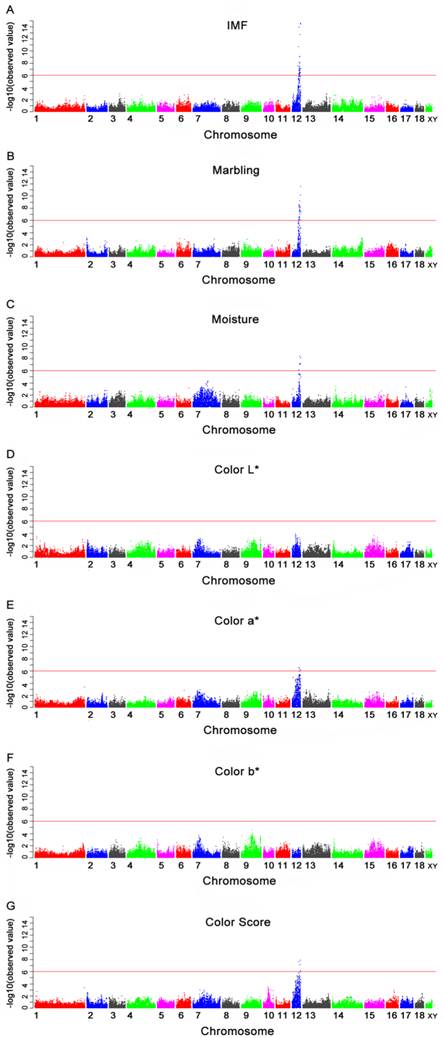
Of the 40 genome-wide significant SNPs for IMF, 35 were located within an 11.97 Mb segment (between 43.25 and 55.22 Mb) on SSC12 in Sus scrofa Build 9 (Table 4). Nine of these (M1GA0016908, ASGA0102838, ALGA0066986, ASGA0055169, M1GA0017055, ASGA0094812, CASI0008458, ALGA0067099 and DIAS0000861) were located in the introns of nine annotated genes: solute carrier family 13, member 5 (SLC13A5), dynein, axonemal, heavy chain 2 (DNAH2), nudE nuclear distribution gene E homolog-like 1 (NDEL1), phosphoinositide-3-kinase, regulatory subunit 5 (PIK3R5), netrin 1 (NTN1), ubiquitin specific peptidase 43 (USP43), glucagon-like peptide 2 receptor (GLP2R), myosin, heavy chain 4 (MYH4) and myosin, heavy chain 3 (MYH3), respectively. The remainder were located 5.6 Kb to 110.4 Kb from the nearest identified genes (Table 4 and Fig. 1A). The most significant SNP (MARC0017000) was located 28.6 Kb from the PIRT gene on SSC12.
Manhattan plots of genome-wide association study with seven meat quality traits. Chromosomes 1-18, X and Y are shown separated by color. A, B, C, D, E, F and G refer to plots for IMF, marbling, moisture, color L*, color a*, color b* and color score, respectively. Values above -log10(observed value) >5.98 (red horizontal) are genome-wide significant.
Genome-wide significant SNPs associated with IMF.
| SNP | Chr.1 | Adjust Chr.2 | Position3 | Nearest gene4 | Distance (bp)5 | GWAS P-value |
|---|---|---|---|---|---|---|
| ASGA0054854 | 12 | 12 | 43252014 | ENSSSCG00000017784 | 28775 | 2.73E-08 |
| M1GA0016908 | 12 | 12 | 47940166 | SLC13A5 | intron | 1.99E-11 |
| ALGA0117904 | 0 | 12 | 48302347 | WSCD1 | 125682 | 8.67E-07 |
| ALGA0066945 | 12 | 12 | 49784913 | EIF5A | 5646 | 1.27E-14 |
| ASGA0102838 | 0 | 12 | 50233550 | DNAH2 | intron | 1.92E-13 |
| ALGA0066986 | 12 | 12 | 50677511 | NDEL1 | intron | 1.80E-07 |
| ALGA0067016 | 12 | 12 | 50961587 | ENSSSCG00000017990 | intron | 7.31E-07 |
| ASGA0055169 | 12 | 12 | 51146021 | PIK3R5 | intron | 5.31E-07 |
| M1GA0017055 | 12 | 12 | 51354730 | NTN1 | intron | 4.38E-07 |
| ASGA0094812 | 12 | 12 | 51682689 | USP43 | intron | 3.69E-15 |
| CASI0008458 | 12 | 12 | 51754735 | GLP2R | intron | 9.09E-07 |
| ALGA0067072 | 12 | 12 | 51869438 | ENSSSCG00000018002 | 10583 | 5.72E-07 |
| ASGA0100525 | 12 | 12 | 51936026 | ENSSSCG00000018002 | 77171 | 1.03E-06 |
| ASGA0055225 | 12 | 12 | 52168096 | MYH4 | 6253 | 6.84E-07 |
| ALGA0067099 | 12 | 12 | 52194871 | MYH4 | intron | 4.00E-07 |
| MARC0004712 | 12 | 12 | 52254677 | ENSSSCG00000018004 | 23808 | 1.87E-07 |
| DIAS0000861 | 12 | 12 | 52424001 | MYH3 | intron | 1.21E-07 |
| ASGA0055256 | 12 | 12 | 52542002 | TMEM220 | 20236 | 7.91E-09 |
| ALGA0107518 | 12 | 12 | 52555184 | TMEM220 | 33418 | 7.62E-08 |
| MARC0017000 | 12 | 12 | 52643400 | PIRT | 28620 | 2.82E-15 |
| ASGA0085522 | 12 | 12 | 52693097 | PIRT | 78316 | 4.63E-08 |
| H3GA0056170 | 12 | 12 | 52694087 | PIRT | 79306 | 7.62E-08 |
| ASGA0096690 | 12 | 12 | 52921855 | SHISA6 | 110471 | 1.48E-07 |
| MARC0030345 | 12 | 12 | 53079696 | ENSSSCG00000018013 | intron | 5.02E-07 |
| MARC0009546 | 12 | 12 | 53088251 | ENSSSCG00000018013 | intron | 4.27E-07 |
| H3GA0022758 | 12 | 12 | 53577424 | ENSSSCG00000018016 | 42532 | 3.19E-07 |
| ALGA0119023 | 12 | 12 | 53581965 | ENSSSCG00000018016 | 47073 | 2.11E-07 |
| ALGA0067173 | 12 | 12 | 54700447 | ENSSSCG00000018022 | 39023 | 2.99E-08 |
| M1GA0017151 | 12 | 12 | 54761424 | ENSSSCG00000018022 | intron | 3.34E-07 |
| ALGA0067189 | 12 | 12 | 54794612 | ENSSSCG00000018022 | intron | 7.90E-10 |
| ALGA0067220 | 12 | 12 | 54915217 | ENSSSCG00000018022 | 77270 | 1.09E-08 |
| ASGA0099873 | 12 | 12 | 55014273 | ENSSSCG00000018023 | intron | 9.53E-08 |
| ALGA0109745 | 12 | 12 | 55167626 | ENSSSCG00000018025 | intron | 8.54E-10 |
| ASGA0084548 | 0 | 0 | 8.17E-08 | |||
| ASGA0089507 | 0 | 0 | 1.24E-08 | |||
| ASGA0093543 | 0 | 0 | 8.63E-08 | |||
| M1GA0026329 | 0 | 0 | 8.63E-08 | |||
| M1GA0026465 | 0 | 0 | 8.63E-08 | |||
| ALGA0107077 | 0 | 0 | 4.76E-09 | |||
| ALGA0108818 | 0 | 0 | 4.11E-08 |
1SNP location on chromosome in the PorcineSNP60 array.
2SNP location adjusted on chromosomes in the Sus scrofa Build 9 assembly.
3SNP position derived from the Sus scrofa Build 9 assembly.
4Gene location on the Sus scrofa Build 9 assembly; gene names start with ENSSSCG as in Ensembl while the other gene symbols are as in GenBank.
5SNP designated as in a gene intron or distance from a gene coding region in the Sus scrofa Build 9 assembly.
Marbling
Of the 37 SNPs associated with marbling, 32 were located within an 8.32 Mb segment (between 46.90 Mb and 55.22 Mb) on SSC12, while the remainders were not mapped to a chromosome in the Sus scrofa Build 9 (Table 5 and Fig. 1B). The segment significantly associated with marbling was almost consistent to that for IMF, with the exception of the segment of 43.25 Mb to 46.90 Mb. The most significant SNP was also MARC0017000. The subsequent two significant SNPs, ASGA0094812 and ALGA0066945, were located within an intron of USP43 gene and 5.6 Kb from the EIF5A gene, respectively.
Genome-wide significant SNPs associated with marbling.
| SNP | Chr.1 | Adjust Chr.2 | Position3 | Nearest gene4 | Distance bp5 | GWAS P-value |
|---|---|---|---|---|---|---|
| ASGA0054989 | 12 | 12 | 46896795 | ENSSSCG00000017860 | 834 | 3.04E-07 |
| MARC0051399 | 0 | 12 | 47553159 | UBE2G1 | intron | 9.94E-07 |
| ALGA0066905 | 12 | 12 | 48052636 | KIAA0753 | 13564 | 8.70E-07 |
| ALGA0066945 | 12 | 12 | 49784913 | EIF5A | 5646 | 2.72E-09 |
| ASGA0102838 | 0 | 12 | 50233550 | DNAH2 | intron | 7.00E-09 |
| ALGA0066986 | 12 | 12 | 50677511 | NDEL1 | intron | 7.54E-07 |
| ASGA0094812 | 12 | 12 | 51682689 | USP43 | intron | 2.70E-12 |
| ALGA0067072 | 12 | 12 | 51869438 | ENSSSCG00000018002 | 10583 | 3.84E-09 |
| MARC0027759 | 12 | 12 | 51932407 | ENSSSCG00000018002 | 73551 | 3.13E-07 |
| ASGA0100525 | 12 | 12 | 51936026 | ENSSSCG00000018002 | 77171 | 6.45E-09 |
| ASGA0055225 | 12 | 12 | 52168096 | MYH4 | 6253 | 4.49E-08 |
| ALGA0067099 | 12 | 12 | 52194871 | MYH4 | intron | 5.91E-09 |
| MARC0004712 | 12 | 12 | 52254677 | ENSSSCG00000018004 | 23808 | 4.97E-09 |
| DIAS0000861 | 12 | 12 | 52424001 | MYH3 | intron | 5.09E-09 |
| ASGA0055256 | 12 | 12 | 52542002 | TMEM220 | 20236 | 4.41E-08 |
| ALGA0107518 | 12 | 12 | 52555184 | TMEM220 | 33418 | 7.37E-09 |
| MARC0017000 | 12 | 12 | 52643400 | PIRT | 28620 | 7.00E-11 |
| ASGA0085522 | 12 | 12 | 52693097 | PIRT | 78316 | 2.49E-08 |
| H3GA0056170 | 12 | 12 | 52694087 | PIRT | 79306 | 7.37E-09 |
| MARC0030345 | 12 | 12 | 53079696 | ENSSSCG00000018013 | intron | 1.45E-08 |
| MARC0009817 | 0 | 12 | 53082355 | ENSSSCG00000018013 | intron | 2.60E-08 |
| MARC0009546 | 12 | 12 | 53088251 | ENSSSCG00000018013 | intron | 6.82E-09 |
| ASGA0035681 | 7 | 12 | 53515215 | ENSSSCG00000018016 | intron | 2.74E-08 |
| H3GA0022758 | 12 | 12 | 53577424 | ENSSSCG00000018016 | 42532 | 1.99E-08 |
| ALGA0119023 | 12 | 12 | 53581965 | ENSSSCG00000018016 | 47073 | 8.40E-07 |
| MARC0048623 | 0 | 12 | 53815574 | ENSSSCG00000018016 | 280682 | 4.26E-07 |
| M1GA0017151 | 12 | 12 | 54761424 | ENSSSCG00000018022 | intron | 2.79E-08 |
| ALGA0067189 | 12 | 12 | 54794612 | ENSSSCG00000018022 | intron | 1.05E-07 |
| ALGA0067220 | 12 | 12 | 54915217 | ENSSSCG00000018022 | 77270 | 5.03E-07 |
| ASGA0099873 | 12 | 12 | 55014273 | ENSSSCG00000018023 | intron | 5.53E-10 |
| ALGA0109745 | 12 | 12 | 55167626 | ENSSSCG00000018025 | intron | 5.54E-10 |
| ASGA0100497 | 12 | 12 | 55223789 | ENSSSCG00000018025 | intron | 2.67E-07 |
| ASGA0084548 | 0 | 0 | 6.99E-10 | |||
| ASGA0093543 | 0 | 0 | 3.96E-08 | |||
| M1GA0026329 | 0 | 0 | 3.96E-08 | |||
| M1GA0026465 | 0 | 0 | 3.96E-08 | |||
| MARC0093869 | 0 | 0 | 9.42E-07 |
1SNP location on chromosome in the PorcineSNP60 array.
2SNP location adjusted on chromosomes in the Sus scrofa Build 9 assembly.
3SNP position derived from the Sus scrofa Build 9 assembly.
4Gene location on the Sus scrofa Build 9 assembly; gene names start with ENSSSCG as in Ensembl while the other gene symbols are as in GenBank.
5SNP designated as in a gene intron or distance from a gene coding region in the Sus scrofa Build 9 assembly.
Moisture
Six SNPs were significantly associated with moisture and these SNPs were located from 49.78 Mb to 54.91 Mb on SSC12 (Table 6). The Manhattan plot is shown in Fig.1C. Only one SNP (ASGA0094812) was located in the USP43 gene (Table 6). The most significant SNP (ALGA0067173) was located in an uncharacterized gene ENSSSCG00000018022 (Ensembl).
Genome-wide significant SNPs associated with moisture.
| SNP | Chr.1 | Adjust Chr.2 | Position3 | Nearest gene4 | Distance bp5 | GWAS P-value |
|---|---|---|---|---|---|---|
| ALGA0066945 | 12 | 12 | 49784913 | EIF5A | 5646 | 7.41E-07 |
| ASGA0094812 | 12 | 12 | 51682689 | USP43 | Intron | 8.02E-09 |
| MARC0017000 | 12 | 12 | 52643400 | PIRT | 28620 | 6.76E-08 |
| ALGA0067173 | 12 | 12 | 5470044 | ENSSSCG00000018022 | 39023 | 4.37E-09 |
| ALGA0067189 | 12 | 12 | 54794612 | ENSSSCG00000018022 | Intron | 7.69E-08 |
| ALGA0067220 | 12 | 12 | 54915217 | ENSSSCG00000018022 | 77270 | 1.00E-07 |
1SNP location on chromosome in the PorcineSNP60 array.
2SNP location adjusted on chromosomes in the Sus scrofa Build 9 assembly.
3SNP position derived from the Sus scrofa Build 9 assembly.
4Gene location on the Sus scrofa Build 9 assembly; gene names start with ENSSSCG as in Ensembl while the other gene symbols are as in GenBank.
5SNP designated as in a gene intron or distance from a gene coding region in the Sus scrofa Build 9 assembly.
Meat color
The GWAS was conducted for four meat color traits (color L*, color a*, color b* and color score). No SNP was significantly associated with color L* and color b*. The SNPs significantly associated with color a* and color score are displayed in Tables 7 and 8. The Manhattan plots of the four traits are shown in Fig. 1D-1G. For color a*, four out of six genome-wide significant SNPs were located within a 1.38 Mb segment (between 50.56 Mb and 51.94 Mb) on SSC12. The most significant SNP (ASGA0100525) was located 77.2 Kb from the uncharacterized gene ENSSSCG00000018002 (Ensembl) on SSC12. For color score, four significant SNPs were identified in the segment between 49.78 Mb and 52.64 Mb on SSC12. The most significant SNP (ASGA0094812) was located in the USP43 gene on SSC12. Another SNP (ASGA0102838) located in the intron of DNAH2 gene showed a significant association with both color a* and color score.
Genome-wide significant SNPs associated with color a*.
| SNP | Chr.1 | Adjust Chr.2 | Position3 | Nearest gene4 | Distance bp5 | GWAS P-value |
|---|---|---|---|---|---|---|
| MARC0093869 | 0 | 12 | 50558797 | ALOXE3 | 772 | 1.03E-06 |
| ASGA0094812 | 12 | 12 | 51682689 | USP43 | intron | 5.94E-07 |
| ALGA0067072 | 12 | 12 | 51869438 | ENSSSCG00000018002 | 10583 | 4.34E-07 |
| ASGA0100525 | 0 | 12 | 51936026 | ENSSSCG00000018002 | 77171 | 4.08E-07 |
| ASGA0089507 | 0 | 0 | 1.68E-07 | |||
| M1GA0016964 | 0 | 0 | 2.83E-07 |
1SNP location on chromosome in the PorcineSNP60 array.
2SNP location adjusted on chromosomes in the Sus scrofa Build 9 assembly.
3SNP position derived from the Sus scrofa Build 9 assembly.
4Gene location on the Sus scrofa Build 9 assembly; gene names start with ENSSSCG as in Ensembl while the other gene symbols are as in GenBank.
5SNP designated as in a gene intron or distance from a gene coding region in the Sus scrofa Build 9 assembly.
Genome-wide significant SNPs associated with color score.
| SNP | Chr.1 | Adjust Chr.2 | Position3 | Nearest gene4 | Distance bp5 | GWAS P-value |
|---|---|---|---|---|---|---|
| ALGA0066945 | 12 | 12 | 49784913 | EIF5A | 5646 | 2.25E-08 |
| ASGA0102838 | 0 | 12 | 50233550 | DNAH2 | Intron | 6.99E-08 |
| ASGA0094812 | 12 | 12 | 51682689 | USP43 | Intron | 1.33E-08 |
| MARC0017000 | 12 | 12 | 52643400 | PIRT | 28620 | 7.32E-07 |
1SNP location on chromosome in the PorcineSNP60 array.
2SNP location adjusted on chromosomes in the Sus scrofa Build 9 assembly.
3SNP position derived from the Sus scrofa Build 9 assembly.
4Gene location on the Sus scrofa Build 9 assembly; gene names start with ENSSSCG as in Ensembl while the other gene symbols are as in GenBank.
5SNP designated as in a gene intron or distance from a gene coding region in the Sus scrofa Build 9 assembly.
Haplotype block
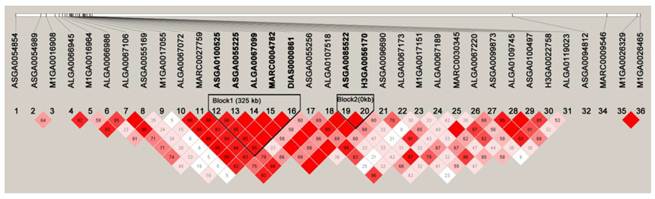
Within the 8.3 Mb region containing all the significant SNPs associated with the five meat quality traits, two haplotype blocks were identified (Fig. 3). Block1 was ASGA0100525-ASGA0055225-ALGA0067099-MARC0004712-DIAS0000861 for 325 Kb and block2 was ASGA0085522-H3GA0056170 for 0.99 Kb.
Haplotype frequencies were calculated and association analysis was performed for the two haplotype blocks. For block1, the AGAAG (47.7% and positive effect) and CAGGA (37.0% and negative effect) haplotypes were significantly associated (P < 0.001) with IMF, marbling, color a* and color score (Table 9). Although there were significant associations of AGAAG and CAGGA haplotypes (P < 0.01), opposite trend of effect was found in moisture comparing to the above four traits. Only the haplotype AGAAG (negative effect) was associated with color L* (P = 0.02636). The haplotypes of CGGGA (6.4%), CGAAG (6.1%), CGAAA (1.8%) and AAGGA (0.9%) showed no significant association with any trait. The global score P-values for IMF, marbling, moisture, color L*, color a*, color b* and color score were <1e-5, <1e-5, 0.01601, 0.07871, 0.00012, 0.86210 and <1e-5, respectively.
Results of haplotype association analysis of block1.1
| Trait | Haplotype | Hap-Freq2 | Hap-score3 | Haplotype-Specific score P-value4 | Global Score Statistic5 | |
|---|---|---|---|---|---|---|
| IMF | CAGGA | 0.37022 | -5.18999 | <1e-5 | χ2=34.79913 | |
| AAGGA | 0.00941 | -1.46451 | 0.14305 | df=5 | ||
| CGGGA | 0.06420 | -0.70883 | 0.47843 | P-value<1e-5 | ||
| CGAAA | 0.01788 | -0.22010 | 0.82579 | |||
| CGAAG | 0.06092 | 0.24839 | 0.80383 | |||
| AGAAG | 0.47737 | 5.50622 | <1e-5 | |||
| Marbling | CAGGA | 0.37022 | -5.61951 | <1e-5 | χ2=39.70068 | |
| CGGGA | 0.06420 | -0.99881 | 0.31789 | df=5 | ||
| AAGGA | 0.00941 | -0.66130 | 0.50842 | P-value<1e-5 | ||
| CGAAG | 0.06092 | -0.28076 | 0.77889 | |||
| CGAAA | 0.01788 | 0.16462 | 0.86925 | |||
| AGAAG | 0.47737 | 6.03922 | <1e-5 | |||
| Moisture | AGAAG | 0.47737 | -3.50341 | 0.00046 | χ2=13.93724 | |
| CGAAA | 0.01788 | -0.18704 | 0.85163 | df=5 | ||
| CGAAG | 0.06092 | -0.03311 | 0.97358 | P-value=0.01601 | ||
| AAGGA | 0.00941 | 0.66883 | 0.50360 | |||
| CGGGA | 0.06420 | 1.54321 | 0.12278 | |||
| CAGGA | 0.37022 | 2.83508 | 0.00458 | |||
| Color L* | AGAAG | 0.47737 | -2.22089 | 0.02636 | χ2=9.87991 | |
| AAGGA | 0.00941 | -1.48342 | 0.13796 | df=5 | ||
| CGGGA | 0.06420 | -0.20138 | 0.84041 | P-value=0.07871 | ||
| CGAAA | 0.01788 | -0.11724 | 0.90667 | |||
| CGAAG | 0.06092 | 1.72188 | 0.08509 | |||
| CAGGA | 0.37022 | 1.91811 | 0.05510 | |||
| Color a* | CAGGA | 0.37022 | -3.36812 | 0.00076 | χ2=25.29306 | |
| CGGGA | 0.06420 | -1.75901 | 0.07858 | df=5 | ||
| AAGGA | 0.00941 | -1.47089 | 0.14132 | P-value=0.00012 | ||
| CGAAG | 0.06092 | -1.22661 | 0.21997 | |||
| CGAAA | 0.01788 | -0.00380 | 0.99697 | |||
| AGAAG | 0.47737 | 4.90989 | <1e-5 | |||
| Color b* | CAGGA | 0.37022 | -0.71172 | 0.47664 | χ2=1.90519 | |
| AAGGA | 0.00941 | -0.60538 | 0.54492 | df=5 | ||
| CGGGA | 0.06420 | -0.39088 | 0.69589 | P-value=0.86210 | ||
| CGAAA | 0.01788 | -0.21136 | 0.83261 | |||
| AGAAG | 0.47737 | 0.59505 | 0.55181 | |||
| CGAAG | 0.06092 | 0.94374 | 0.34530 | |||
| Color score | CAGGA | 0.37022 | -4.88339 | <1e-5 | χ2=35.55778 | |
| CGAAG | 0.06092 | -1.53435 | 0.12494 | df=5 | ||
| CGGGA | 0.06420 | -1.28754 | 0.19791 | P-value<1e-5 | ||
| AAGGA | 0.00941 | -0.11132 | 0.91136 | |||
| CGAAA | 0.01788 | 0.65579 | 0.51196 | |||
| AGAAG | 0.47737 | 5.81331 | <1e-5 |
1Block1: ASGA0100525-ASGA0055225-ALGA0067099-MARC0004712-DIAS0000861
2Estimated frequency of each haplotype in the population.
3The score for the haplotype, which is the statistical measurement of association of each specific haplotype with the trait. The results are sorted by this value.
4The asymptotic chi-square (1 df) P-value, calculated from the square of the score statistic.
5The overall association between haplotypes and the response.
Results of haplotype association analysis of block2.1
| Trait | Haplotype | Hap-Freq2 | Hap-score3 | Haplotype-Specific score P-value4 | Global Score Statistic5 | |
|---|---|---|---|---|---|---|
| IMF | GG | 0.32819 | -5.79716 | <1e-5 | χ2=37.12951 | |
| GA | 0.08258 | -0.30975 | 0.75675 | df=2 | ||
| AA | 0.58923 | 5.90899 | <1e-5 | P-value<1e-5 | ||
| Marbling | GG | 0.32819 | -5.93800 | <1e-5 | χ2=37.96553 | |
| GA | 0.08258 | -0.02525 | 0.97985 | df=2 | ||
| AA | 0.58923 | 5.91486 | <1e-5 | P-value<1e-5 | ||
| Moisture | AA | 0.58923 | -4.23732 | 0.00002 | χ2=18.83514 | |
| GA | 0.08258 | 0.29517 | 0.76786 | df=2 | ||
| GG | 0.32819 | 4.09874 | 0.00004 | P-value=0.00008 | ||
| Color L* | AA | 0.58923 | -2.49408 | 0.01263 | χ2=6.32093 | |
| GA | 0.08258 | 1.02990 | 0.30306 | df=2 | ||
| GG | 0.32819 | 1.94625 | 0.05162 | P-value=0.04241 | ||
| Color a* | GG | 0.32819 | -4.41599 | 0.00001 | χ2=22.87828 | |
| GA | 0.08258 | -0.61689 | 0.53731 | df=2 | ||
| AA | 0.58923 | 4.72064 | <1e-5 | P-value=0.00001 | ||
| Color b* | GG | 0.32819 | -0.81572 | 0.41466 | χ2=0.70534 | |
| GA | 0.08258 | 0.40514 | 0.68538 | df=2 | ||
| AA | 0.58923 | 0.58519 | 0.55842 | P-value=0.70281 | ||
| Color score | GG | 0.32819 | -4.70167 | <1e-5 | χ2=27.44276 | |
| GA | 0.08258 | -1.02013 | 0.30766 | df=2 | ||
| AA | 0.58923 | 5.20804 | <1e-5 | P-value<1e-5 |
1Block2: ASGA0085522-H3GA0056170
2Estimated frequency of each haplotype in the population
3The score for the haplotype, which is the statistical measurement of association of each specific haplotype with the trait. The results are sorted by this value.
4The asymptotic chi-square (1 df) P-value, calculated from the square of the score statistic.
5The overall association between haplotypes and the response.
For block2, the haplotype AA (58.92%) was associated with IMF (P < 1e-5), marbling (P < 1e-5), color a* (P = 0.00001) and color score (P < 1e-5) for positive hap-score, while associated with moisture (P = 0.00002) and color L* (P = 0.01263) for negative hap-score. The haplotype GG (32.82%, negative effect) showed significant association with those above traits except for color L* (P = 0.05162). The global score P-values for IMF, marbling, moisture, color L*, color a*, color b* and color score were <1e-5, <1e-5, 0.00008, 0.04241, 0.00001, 0.70281 and <1e-5, respectively.
Population stratification assessment
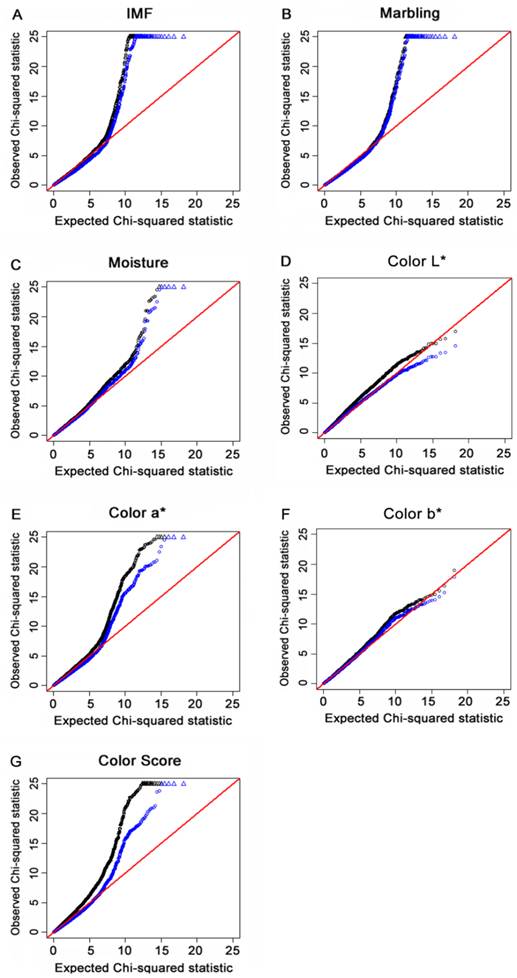
The “Q-Q” plots of the ranked Chi-square statistic values of the association tests versus expected values sampled from a Chi-square distribution for all of the 48,238 SNPs obtained from 454 F2 offspring for IMF, marbling, moisture content, color L*, color a*, color b* and color score are shown in Fig. 2A to 2G. The deflation factors for IMF, marbling, moisture, color L*, color a*, color b* and color score were 1.16, 1.05, 1.08, 1.17, 1.18, 1.07 and 1.33, respectively. The deviation of color score was reduced via GC procedure applied (black line). The deflation factors for other traits were closed to 1 and the lines of the two methods overlapped to a certain extent. These results indicated that by using the GRAMMAR-GC method, the potential population stratification could be reduced to a certain degree.
For each of the seven meat quality traits, a quantile-quantile (Q-Q) plot of the results derived without adjustment for the inflation factor (λ) are shown in black. Results derived using the genomic control (GC) procedure are shown in blue. SNPs for which the test statistic exceeds 25 are represented by triangles. A, B, C, D, E, F and G refer to Q-Q plots for IMF, marbling, moisture, color L*, color a*, color b* and color score, respectively. Results indicated that population stratification was reduced to a certain degree by using the GC method.
Haplotypes on an 8.3-Mb region on SSC12 containing all the significant SNPs associated with the five meat quality traits obtained with the HAPLOVIEW 3.31 program. Solid lines mark the two blocks identified.
Discussion
Some disease risk genes have been identified using genome-wide association studies (GWAS) in humans [25]. Unlike unrelated populations or small families employed in human studies, a large number of half-sibs and full-sibs can be obtained in livestock. In the current work, GWAS for meat quality traits was performed in a porcine Large White × Minzhu intercross population. As a result of the large number of half and full sibs present in the studied population, the ignorance of pedigree information could lead to an increased false discovery rate [26]. Using the GRAMMAR-GC method in this work, intra- and inter-family variations were considered. Furthermore, phenotypes were adjusted using fixed and random effects, and the population stratification was adjusted. These results indicated that the GRAMMAR-GC method was robust for population stratification and the F2 intercross population was suitable for GWAS in the present experiment.
In this study, most significant SNPs for IMF, marbling, meat color and moisture were located on SSC12 in proximal regions. A QTL for color score has previously been mapped to the region between SWC62 (37.9Mb) and S0106 (43.7Mb) on SSC12 [27]. QTLs for IMF, marbling and moisture have been reported within SSC12 at 95 cM (42-43 Mb), 18.2-93.9 cM (35.4-51.1 Mb), and 64.7-80.2 cM (21.3-35.4 Mb), respectively [28, 29]. The QTLs for color a* have been reported to be on SSC 1, 4, 6, 7, 8, 13, 14, 15, 16 and 17 [28, 30-38]. However, this GWAS revealed novel loci for color a* on SSC12.
In the current study, a haplotype block, ASGA0100525-ASGA0055225-ALGA0067099-MARC0004712-DIAS0000861, was identified within a 325 Kb fragment on SSC12. This region encompasses five annotated genes (GAS7, MYH1, MYH2, MYH3 and MYH4) in the pig genome region. The MYH1, MYH2, MYH3 (predicted gene in GenBank) and MYH4 genes belong to the myosin heavy chain gene family (MYH), which are located on chromosomes 7 and 12 [39-41]. These different isoforms may partially reflect skeletal muscle fiber type diversity. Four adult MYH isoforms are expressed in the skeletal muscle of pigs: types I, IIa, IIx and IIb, which are encoded by the MYH7, MYH2, MYH1 and MYH4 genes, respectively [42]. With the exception of MYH7 on SSC7, the MYH1, MYH2 and MYH4 genes were all identified on the region of haplotype block1 on SSC12 in this study. Davoli et al. [43] found that a SNP in 3'-UTR of MYH4 gene was potentially associated with expected breeding value (EBV) for visible intermuscular fat (VIF) in one group of Duroc pigs (P = 0.059). The Glu706Lys mutation in the MYH2 gene has been reported to be associated with a familial congenital myopathy in humans [44]. The MYH1, MYH2 and MYH4 are related to muscle development [45]. Fat type (indigenous Chinese pig breeds) and meat type (western commercial pig breeds) pig breeds show obvious differences in muscle development [46]. Furthermore, the fat type pig breeds, such as Meishan and Laiwu pigs, are known to have superior IMF and marbling compared to meat type pig breeds, including Large White and Duroc. Comparing the expression of genes in the two type pigs, MYH4 was decreased (P < 0.05), while MYH1 (P < 0.05) and MYH2 (P < 0.05) were increased in LM of fat type pigs [47, 48]. According to both the expressions and SNPs showing significant association with meat quality traits, they could be used as potentially strong candidate genes.
Besides the genes in this haplotype block, there were eight significant SNPs located within introns of eight annotated genes, UBE2G1, SLC13A5, DNAH2, NDEL1, PIK3R5, NTN1, USP43 and GLP2R. A significant SNP (ASGA0094812) within the USP43 gene was detected for five meat quality traits. The SNP MARC0051399 was located in the UBE2G1 gene, which is expressed in skeletal muscle [49], and showed a significant association with marbling. The associations of SNPs in USP43 and UBE2G1 genes with meat quality traits were not reported in previous studies. For the remaining genes, neither expression in skeletal muscle nor SNPs within genes association with muscle development traits were reported previously.
IMF in pork is considered as a key factor that influences meat quality and associates with marbling, juiciness, tenderness and flavor [50]. Reduction of IMF in pork leads to increased water content. Similar to previous reports [51, 52], a strong negative phenotypic correlation was identified between IMF and moisture. Furthermore, the results from this GWAS revealed the opposite effect of significant SNPs associated with these two traits (data not shown). The strongest correlation coefficient among the measured traits was observed between IMF and marbling. The present GWAS results that 28 SNPs were significantly associated with both traits could support this strong correlation.
In summary, this GWAS demonstrated that 36 of the 45 SNPs that were significantly associated with meat quality traits were located in a region that is approximately 12 Mb in length (43 to 55 Mb) on SSC12. These SNPs were located within previously reported QTLs. These results narrow down the previously detected QTL intervals. Furthermore, the haplotype block containing four MYH gene family members that were significantly associated with meat quality traits proved these QTL effects.
Acknowledgements
The authors thank Dr. Ming-xing Chu (Institute of Animal Science, Chinese Academy of Agricultural Sciences, China), Dr. Qin Zhang and Dr. Dong-xiao Sun (College of Animal Science and Technology, China Agricultural University, China) for the read-through of the manuscript. This research was supported by the National Key Technology R&D Program of China (No.2011BAD28B01), earmarked fund for Modern Agro-industry Technology Research System, National Technology Program of China (No.2011ZX08006-003) and Chinese Academy of Agricultural Sciences Foundation (No.2011cj-5 and No.2012ZL069).
Competing Interests
The authors have declared that no competing interest exists.
References
1. Bonneau M, Lebret B. Production systems and influence on eating quality of pork. Meat Sci. 2010;84:293-300
2. Andersson-Eklund L, Marklund L, Lundström K. et al. Mapping quantitative trait loci for carcass and meat quality traits in a wild boar x Large White intercross. J Anim Sci. 1998;76:694-700
3. Van Laere A, Nguyen M, Braunschweig M. et al. A regulatory mutation in IGF2 causes a major QTL effect on muscle growth in the pig. Nature. 2003;425:832-6
4. Ren J, Duan Y, Qiao R. et al. A Missense Mutation in PPARD Causes a Major QTL Effect on Ear Size in Pigs. PLoS Genet. 2011;7:e1002043
5. Grisart B, Farnir F, Karim L. et al. Genetic and functional confirmation of the causality of the DGAT1 K232A quantitative trait nucleotide in affecting milk yield and composition. Proc Natl Acad Sci USA. 2004;101:2398-403
6. Blott S, Kim JJ, Moisio S. et al. Molecular dissection of a quantitative trait locus: a phenylalanine-to-tyrosine substitution in the transmembrane domain of the bovine growth hormone receptor is associated with a major effect on milk yield and composition. Genetics. 2003;163:253-66
7. Hirschhorn JN, Daly MJ. Genome-wide association studies for common diseases and complex traits. Nat Rev Genet. 2005;6:95-108
8. Fan B, Onteru SK, Du ZQ. et al. Genome-wide association study identifies loci for body composition and structural soundness traits in pigs. PLoS ONE. 2011;6:e14726
9. Gu X, Feng C, Ma L. et al. Genome-wide association study of body weight in chicken F2 resource population. PLoS ONE. 2011;6:e21872
10. Matukumalli LK, Lawley CT, Schnabel RD. et al. Development and characterization of a high density SNP genotyping assay for cattle. PLoS One. 2009;4:e5350
11. Jiang L, Liu J, Sun D. et al. Genome wide association studies for milk production traits in Chinese Holstein population. PLoS ONE. 2010;5:e13661
12. Bouwman AC, Bovenhuis H, Visker MH. et al. Genome-wide association of milk fatty acids in Dutch dairy cattle. BMC Genet. 2011;12:43
13. Bolormaa S, Neto LRP, Zhang YD. et al. A genome-wide association study of meat and carcass traits in Australian cattle. J Anim Sci. 2011;89:2297-309
14. Cheng PL. Pig Breeds in China. Shanghai, China: Shanghai Scientific and Technical Publishers. 1986
15. Berg EP. Pork Composition and quality assessment procedures, 1st edn. National Pork Producer Council (NPPC), Des Moines, USA: IA. 2000
16. Marshall TC, Slate J, Kruuk LE. et al. Statistical confidence for likelihood-based paternity inference in natural populations. Mol Ecol. 1998;7:639-655
17. Aulchenko YS, de Koning DJ, Haley C. Genomewide rapid association using mixed model and regression: a fast and simple method for genomewide pedigree-based quantitative trait loci association analysis. Genetics. 2007;177:577-585
18. Amin N, van Duijn CM, Aulchenko YS. A genomic background based method for association analysis in related individuals. PLoS One. 2007;2:e1274
19. Hao K, Li C, Rosenow C. et al. Detect and adjust for population stratification in population-based association study using genomic control markers: an application of Affymetrix Genechip Human Mapping 10k array. Eur J Hum Genet. 2004;12:1001-1006
20. Madsen P, Sørensen P, Su G. et al. DMU- a package for analyzing multivariate mixed models. Brasil: Proceedings of 8th World Congress on Genetics Applied to Livestock Production. 2006
21. Yang Q, Cui J, Chazaro I. et al. Power and type I error rate of false discovery rate approaches in genome-wide association studies. BMC Genet. 2005;6(suppl 1):S134
22. Barrett JC, Fry B, Maller J. et al. HAPLOVIEW: analysis and visualization of LD and haplotype maps. Bioinformatics. 2005;21:263-265
23. Schaid DJ, Rowland CM, Tines DE. et al. Score Tests for Association between Traits and Haplotypes when Linkage Phase Is Ambiguous. AM J Hum Genet. 2002;70(2):425-434
24. Pearson TA, Manolio TA. How to interpret a genome-wide association study. JAMA. 2008;299:1335-1344
25. The Wellcome Trust Case Control Consortium. Genome-wide association study of 14000 cases of seven common diseases and 3000 shared controls. Nature. 2007;447(7145):661-678
26. Minozzi G, Buggiotti L, Stella A. et al. Genetic loci involved in antibody response to Mycobacterium avium ssp. paratuberculosis in cattle. PLoS ONE. 2010;5:e11117
27. Malek M, Dekkers JC, Lee HK. et al. A molecular genome scan analysis to identify chromosomal regions influencing economic traits in the pig. II. Meat and muscle composition. Mamm Genome. 2001;12:637-645
28. Edwards DB, Ernst CW, Raney NE. et al. Quantitative trait locus mapping in an F2 Duroc × Pietrain resource population: II. Carcass and meat quality traits. J Anim Sci. 2008;86:254-266
29. Ma J, Ren J, Guo Y. et al. Genome-wide identification of quantitative trait loci for carcass composition and meat quality in a large-scale White Duroc × Chinese Erhualian resource population. Anim Genet. 2009;40:637-647
30. Vidal O, Varona L, Oliver MA. et al. Malic enzyme 1 genotype is associated with backfat thickness and meat quality traits in pigs. Anim Genet. 2006;37:28-32
31. Ovilo C, Clop A, Noguera JL. et al. Quantitative trait locus mapping for meat quality traits in an Iberian xLandrace F2 pig population. J Anim Sci. 2002;80:2801-2808
32. Yue G, Stratil A, Kopecny M. et al. Linkage and QTL mapping for Sus scrofa chromosome 6. J Anim Breed Genet. 2003;120:45-55
33. Geldermann H, Muller E, Moser G. et al. Genome-wide linkage and QTL mapping in porcine F2 families. J Anim Breed Genet. 2003;120:363-393
34. Beeckmann P, Moser G, Bartenschlager H. et al. Linkage and QTL mapping for Sus scrofa chromosome 8. J Anim Breed Genet. 2003;120:66-73
35. de Koning DJ, Harlizius B, Rattink AP. et al. Detection and characterization of quantitative trait loci for meat qualitytraits in pigs. J Anim Sci. 2001;79:2812-2819
36. Bertram HC, Petersen JS, Andersen HJ. Relationship between RN- genotype and drip loss in meat from Dansh pigs. Meat Sci. 2000;56:49-55
37. Paixao DM, Silva Filho MI, Pereira MS. et al. Quantitative trait loci for carcass, internal organ and meat quality traits on porcine chromosomes 16, 17 and 18. Genet Mol Biol. 2008;31:898-901
38. Wimmers K, Murani E, Te Pas MF. et al. Associations of functional candidate genes derived from gene-expression profiles of prenatal porcine muscle tissue with meat quality and muscle deposition. Anim Genet. 2007;38:474-484
39. Davoli R, Fontanesi L, Zambonelli PZ. et al. Isolation of porcine expressed sequence tags for the construction of a first genomic transcript map of the skeletal muscle in pig. Anim Genet. 2002;33:3-18
40. Shrager JB, Desjardins PR, Burkman JM. et al. Human skeletal myosin heavy chain genes are tightly linked in the order embryonic-IIa-IId/x-IIb-perinatal-extraocular. J Muscle Res Cell Motil. 2000;21:345-355
41. Weiss AD, McDonough B, Wertman L. et al. Organization of human and mouse skeletal myosin heavy chain gene clusters is highly conserved. Proc Natl Acad Sci USA. 1999;96:2958-2963
42. Lefaucheur L, Milan D, Ecolan P. et al. Myosin heavy chain composition of different skeletal muscles in Large White and Meishan pigs. J Anim Sci. 2004;82:1931-1941
43. Davoli R, Fontanesi L, Cagnazzo M. et al. Identification of SNPs, mapping and analysis of allele frequencies in two candidate genes for meat production traits: the porcine myosin heavy chain 2B (MYH4) and the skeletal muscle myosin regulatory light chain 2 (HUMMLC2B). Anim Genet. 2003;34:221-225
44. Oldfors A, Tajsharghi H, Darin N. et al. Myopathies associated with myosin heavy chain mutations. Acta Myol. 2004;23:90-96
45. Fan B, Onteru SK, Du ZQ. et al. Genome-Wide Association Study Identifies Loci for Body Composition and Structural Soundness Traits in Pigs. PLoS ONE. 2011;6:e14726
46. Tang Z, Li Y, Wan P. et al. LongSAGE analysis of skeletal muscle at three prenatal stages in Tongcheng and Landrace pigs. Genome Biol. 2007;8:R115
47. Xu YJ, Jin ML, Wang LJ. et al. Differential proteome analysis of porcine skeletal muscles between Meishan and Large White. J Anim Sci. 2009;87:2519-2527
48. Hu HM, Wang JY, Zhu RS. et al. Effect of myosin heavy chain composition of muscles on meat quality in Laiwu pigs and Duroc. Sci China Ser C-Life Sci. 2008;51:127-132
49. Watanabe TK, Kawai A, Fujiwara T. et al. Molecular cloning of UBE2G, encoding a human skeletal muscle-specific ubiquitin-conjugating enzyme homologous to UBC7 of C. elegans. Cytogenet Cell Genet. 1996;74:146-148
50. Cameron ND. Genetic and phenotypic parameters for carcass traits, meat and eating quality traits in pigs. Livest Product Sci. 1990;26:119-135
51. Gao SZ, Zhao SM. Physiology, affecting factors and strategies for control of pig meat intramuscular fat. Recent Pat Food Nutr Agric. 2009;1:59-74
52. Gjerlaug-Enger E, Aass L, Ødegård J. et al. Genetic parameters of meat quality traits in two pig breeds measured by rapid methods. Animal. 2010;4:1832-1843
Author biography
Dr Longchao Zhang is one of the members of Pig Science Group, Institute of Animal Science, Chinese Academy of Agricultural Sciences. Dr Zhang is a research scientist with 10 years of research experience in the animal science area and with support by fund of National Key Technology R&D Program of China (2008-2010), National Key Technology R&D Program of China (2011-2015), and Chinese Academy of Agricultural Sciences Foundation (2007-2013). He focuses on the research for reproduction, meat quality traits, and health in pig.
Dr Lixian Wang heads the Pig Science Group, which focuses on pig breeding and the molecular mechanisms of porcine meat quality, reproduction, health, and production. The group is housed in Institute of Animal Science, Chinese Academy of Agricultural Sciences. Dr Wang is a famous research scientist in China and with support by fund of National Key Technology R&D Program of China (2006-2008, 2008-2010, 2011-2015), National High-Tech Research and Development Program (2008-2010), earmarked fund for Modern Agro-industry Technology Research System.
Dr Chuduan Wang is currently a professor in Animal Genetics and Breeding at China Agricultural University, his research interests are swine genetics and breeding, especially genetics effection on pork quality improvement and disease resistance, and pig production and management.
Dr Weizhen Luo is a research scientist with 7 years of research experience in animal genetics and breeding. Dr Luo has a special interest in simulation study of breeding schemes for farm animals, microarray data analysis and bioinformatics. Currently she focuses on the data analysis of genome-wide association study of the resource population.
Mr Duxue Cheng is a Ph.D candidate and has been engaged in pig genetics and breeding research for 9 years, and focus on the genetic and molecular mechanism in pig performance. Recently he focuses on the work in porcine meat quality traits.
Mr Shaokang Chen is a Ph.D candidate and has been engaged in pig genetics and breeding research, and has especially accumulated a wealth of experience in the study that elucidates the genetic and molecular mechanism in pig performance. Recently he focuses on the research in swine health breeding and Immunogenetics.
![]() Corresponding author: Chuduan Wang, College of Animal Science and Technology, China Agricultural University, Beijing 100193, China. E-mail: wangchuduancom. Lixian Wang, Institute of Animal Science, Chinese Academy of Agricultural Sciences, Beijing 100193, China. Fax: +86-10-62818771. E-mail: iaswlxnet. Longchao Zhang, Institute of Animal Science, Chinese Academy of Agricultural Sciences, Beijing 100193, China. Fax: +86-10-62818771. E-mail: lczhangnet.cn.
Corresponding author: Chuduan Wang, College of Animal Science and Technology, China Agricultural University, Beijing 100193, China. E-mail: wangchuduancom. Lixian Wang, Institute of Animal Science, Chinese Academy of Agricultural Sciences, Beijing 100193, China. Fax: +86-10-62818771. E-mail: iaswlxnet. Longchao Zhang, Institute of Animal Science, Chinese Academy of Agricultural Sciences, Beijing 100193, China. Fax: +86-10-62818771. E-mail: lczhangnet.cn.