Impact Factor ISSN: 1449-2288

 Global reach, higher impact
Int J Biol Sci 2012; 8(5):697-706. doi:10.7150/ijbs.4108 This issue Cite
Research Paper
Difference in Feeding Behaviors of Two Invasive Whiteflies on Host Plants with Different Suitability: Implication for Competitive Displacement
Baiming Liu1,2, Fengming Yan3, Dong Chu4, Huipeng Pan1, Xiaoguo Jiao1, Wen Xie1, Qingjun Wu1, Shaoli Wang1, Baoyun Xu1, Xuguo Zhou5 ![]() , Youjun Zhang1
, Youjun Zhang1 ![]()
1. Department of Plant Protection, Institute of Vegetables and Flowers, Chinese Academy of Agricultural Sciences, Beijing 100081, China
2. Institute of Plant Protection, Tianjin Academy of Agricultural Sciences, Tianjin 300112, China
3. College of Plant Protection, Henan Agricultural University, Zhengzhou, Henan 450002, China
4. College of Agronomy and Plant Protection, Qingdao Agricultural University, Qingdao, 266109, China
5. Department of Entomology, University of Kentucky, Lexington, KY 40546, USA
Received 2012-1-17; Accepted 2012-3-14; Published 2012-5-14
Abstract
In China, Bemisia tabaci Q (commonly known as biotype Q) has rapidly displaced B (commonly known as biotype B) in the past 6 years. The mechanisms underlying such phenomenon have been studied extensively in recent years; however, we have not come to a definitive conclusion yet. In the present study, the differences in host suitability between B and Q whitefly adults to five host plants (cabbage, cotton, cucumber, poinsettia, and tomato) were evaluated based on their respective feeding behaviors using a direct-current electrical penetration graph (DC-EPG) system. Pair-wise comparisons of B. tabaci B and Q feeding on each of the five host plants clearly indicate that Q feeds better than B on tomato, cotton and poinsettia, while B feeds better than Q on cabbage and cucumber. The EPG parameters related to both phloem and non-phloem phases confirm that cabbage and cucumber are best suited to B, while tomato, cotton, and poinsettia are best suited to Q. Our present results support the contention that host suitability and adult feeding behavior contribute to the competitive displacement of biotype B by biotype Q. The discrepancy between field (previous studies) and laboratory results (this study), however, suggests that 1) whitefly displacement is apparently contributed by multiple factors; and 2) factor(s) other than the host plant suitability may play a vital role in dictating the whitefly biotypes in the field.
Keywords: Bemisia tabaci, host suitability, feeding behavior, DC-EPG, competitive displacement
INTRODUCTION
The sweet potato whitefly, Bemisia tabaci (Gennadius) (Hemiptera: Aleyrodidae), is one of the most destructive phloem-feeding insect pests worldwide, causing severe damage to more than 600 plant species directly by feeding and/or indirectly by transmitting plant viruses [1, 2]. Bemisia tabaci is the general term for a species complex covering at least 24 morphologically indistinguishable but genetically distinct cryptic species [3, 4]. Among them, Middle East-Minor Asia 1 genetic group (commonly known as biotype B, hereafter referred to as B) and Mediterranean genetic group (commonly known as biotype Q, hereafter referred to as Q) are the two most invasive and widely distributed whiteflies around the world. During the past two decades, B. tabaci B and Q have spread from their native ranges to as many as 60 countries and resulted in serious economic losses to agricultural production worldwide [4, 5].
In China, B. tabaci was first recorded in the late 1940s [6]. However, it did not cause significant crop damage until the introduction of B in the mid-1990s [7]. Since then, B has gradually replaced the indigenous species, and has been the major whitefly pest in both protected and open fields till 2007 [8-12]. The situation started to change in 2003 when Q arrived in Yunnan Province, China [9]. In the following years, B. tabaci Q has rapidly displaced B in most part of China and has become the most dominant whitefly [10-15]. The mechanism(s) underlying the competitive displacement of B. tabaci B by Q have been a point of discussion for many years. Previous studies suggest that the differences in life-history traits, mating behavior, and insecticide resistance play important roles in the competitive displacement between whiteflies [16, 17]. Our prior results indicate that choice of host plant also contributes to the competition between whitefly biotypes, [10, 11] and this study is the continuation of these previous efforts.
The electrical penetration graph (EPG), first developed by McLean and Kinsey [18] using an AC circuit (AC-EPG) and later modified by Tjallingii [19, 20] using a DC circuit (DC-EPG), is a reliable tool to measure the feeding behavior of sap-sucking insects. EPG has been used extensively in whitefly research [21-35], and EPG parameters including frequency, duration, and waveform sequence provide good indicators of host plant suitability [36]. In this study, we used the EPG toolkit to look at elements from both the insect (feeding behavior) and plant (host suitability) perspective to better understand the factors involved in the competitive displacement of B. tabaci B by Q. Specially, we used DC-EPG to compare the feeding behaviors of B. tabaci B and Q adults on five host plants.
MATERIALS AND METHODS
Whitefly colony
Bemisia tabaci B and Q colonies were collected on cabbage, Brassica oleracea var. Jingfeng1, and poinsettia, Euphorbia pulcherrima Wild. (ex Klotz.) in Beijing, China in 2004 and 2009, respectively. To standardize their host plants, approximately 300 B. tabaci B and Q whiteflies, respectively, were transferred to tomato plants. After 6 generations, the newly-emerged female whiteflies (2-5 d) collected randomly from tomato plants were used in the EPG experiments. All the whitefly B and Q colonies were maintained on tomatoes in separate screen cages, under natural lighting and ambient temperature (26±2°C) in a temperature-controlled glasshouse. The purity of each colony was monitored by sampling 15 adults every generation using a molecular marker, mtCOI (mitochondrial cytochrome oxidase I) [37].
Host plant
Tomato (Lycopersicon esculentum Mill., cv Zhongza 9), cabbage (B. oleracea L., cv Jingfeng 1), cucumber (Cucumis sativus L., cv Zhongnong 12), cotton (Gossypium herbaceum L., cv DP99B), and poinsettia (E. pulcherrima Wild., ex Klotz.) were the host plants tested in this study. The seedlings were cultivated in pots (1.5L, 1 plant/pot) and enclosed in separate whitefly-proof screen cages under natural lighting and ambient temperature in the temperature-controlled glasshouses (26±2°C). The host plants tomato, cabbage, cucumber, and cotton were used when they reached the stage of 2-3 true leaves, and poinsettia was used at the stage of 4-5 true leaves.
EPG recording
Whitefly EPGs were recorded using a Giga-8 DC-EPG system (Wageningen University, the Netherlands) with 109 Ohm input resistance. Host plants, insects, and EPG probes were placed into electrically grounded Faraday cages to shield the setup from external electrical noise. Prior to recording, newly-emerged females (2-5 d) were immobilized on an ice-chilled glass dish (4cm diameter). Immediately after immobilization, a gold wire, 1.5 cm long and 12.5 μm in diameter, was rapidly attached to the whitefly's dorsum using a droplet of water-based silver glue. The wired whiteflies were connected to the input of the Giga-8 probe and gently placed on the lower surface of the bottom leaf, which was fixed on a stick vertically inserted into the pot. The EPG signals were digitized with a DI710-UL analogue-to-digital converter (DATAQ Instruments, Akron, USA). Digitized output was acquired with PROBE3.4 software (Wageningen Agricultural University, The Netherlands). For each experiment, EPGs were continuously recorded for 6h with a fresh insect and a new host plant for each replicate. In total, 17-27 replicates were carried out per host plant for each whitefly species. All experiments were performed under the condition of 26±1°C, 70% RH.
Statistical analysis
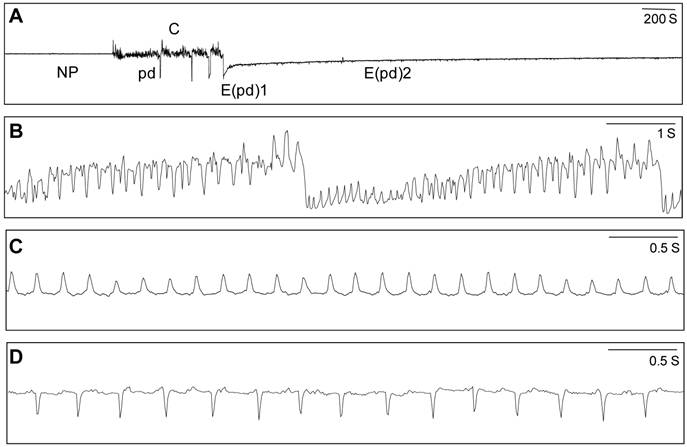
EPG waveforms were documented and categorized according to Jiang et al. [30, 31]. Four waveforms (Fig. 1) were identified including NP (non-probing period), C (stylet pathway phase), E(pd)1 (salivation into phloem), and E(pd)2 (ingestion of sieve element sap). Waveform pd (potential drop), F (presumed penetration difficulties) and G (ingestion of xylem sap) were rare and grouped into waveform C. The time from start to finish of each waveform was recorded by PROBE3.4. Twenty parameters were calculated according to van Helden & Tjallingii [38]. A total of 242 successful recordings were obtained from tomato (B=17 replicates and Q=25 replicates), cabbage (B=26 and Q=27), cucumber (B=22 and Q=26), cotton (B=26 and Q=26), and poinsettia (B=25 and Q=22). For the analysis of feeding behavior, data were first checked for normality and homogeneity of variance, then log transformed to improve the model fit. Two-way ANOVA was used to analyze the effects of insect, host plant, and their interaction on EPG parameters 1-19 (Table 1 and 2), and a chi-square test was used to compare the percentage of whitefly reaching the phloem phase (parameter 20) (Table 2). When the ANOVA indicated significant effects at P < 0.05, comparisons of different host plants within the same whitefly species were carried out with Tukey tests, and means of B and Q on each of the host plants were compared using an Independent-Samples t-test. The significance level was set at P < 0.05. All statistical analyses were done using the software SPSS11.5.
Representative EPG waveform patterns generated when B. tabaci feeds on host plants. A total of 4 B. tabaci waveforms (A) were identified in this study including NP (non-probing period, A), C (stylet pathway phase, B), E(pd)1 (salivation into phloem, C), and E(pd)2 (ingestion of sieve element sap, D).
Summary of EPG parameters associated with non-phloem feeding in B. tabaci during the 6h recording.
| Parameter1 | Probability2 | Biotype | Host Plant (Mean ± SE) | |||||||
|---|---|---|---|---|---|---|---|---|---|---|
| Biotype | Host | Biotype*Host | Tomato | Cabbage | Cucumber | Cotton | Poinsettia | |||
| 1 | Recording that begin with probe | 0.234 | <0.001 | 0.17 | B | 20.0±10.2c3 | 19.7±9.9c*4 | 69.8±20.3b | 35.6±10.6bc | 157.3±18.5a* |
| Q | 13.4±5.2bc | 6.9±2.0c | 33.9±10.1ab | 36.4±8.5ab | 83.1±16.7a | |||||
| 2 | Total number of probes | 0.079 | <0.001 | 0.004 | B | 173.2±31.0a* | 114.2±13.9a* | 43.2±11.7b | 90.8±13.3a* | 25.1±4.7b |
| Q | 81.2±10.8ab | 79.2±8.1a | 49.5±8.2c | 45.7±7.3bc | 33.6±5.7c | |||||
| 3 | Total duration of probes | 0.001 | <0.001 | 0.612 | B | 154.9±17.3a | 202.7±15.8a | 82.7±14.9b | 73.9±8.6b | 63.7±12.8b |
| Q | 183.8±12.4a | 213.6±14.4a | 97.1±14.4b | 113.5±9.5b* | 110.5±15.3b* | |||||
| 4 | Mean probe duration | <0.001 | 0.003 | 0.005 | B | 1.4±0.3bc | 2.3±0.3ab | 3.4±0.8 ab | 1.2±0.2c | 5.7±2.4a |
| Q | 3.6±0.6ab* | 3.7±0.6ab | 2.6±0.4b | 4.0±0.7ab* | 6.9±2.6a | |||||
| 5 | Total duration of C | 0.001 | <0.001 | 0.372 | B | 117.1±14.1a | 108.7±9.4a | 48.3±9.9bc | 53.6±6.7b | 34.1±6.5c |
| Q | 114.6±9.5a | 125.1±11.0a | 70.6±10.9b* | 83.8±8.0ab* | 64.7±12.7b | |||||
| 6 | Total duration of NP | 0.001 | <0.001 | 0.612 | B | 205.1±17.3b | 157.3±15.8b | 277.3±14.9a | 286.1±8.6a* | 296.3±12.8a* |
| Q | 176.2±12.4b | 146.4±14.4b | 262.9±14.4a | 246.5±9.5a | 249.5±15.3a | |||||
| 7 | Time from 1st probe to 1st E(pd) | 0.583 | <0.001 | 0.217 | B | 115.8±24.2ab | 34.5±8.4c | 205.4±27.6a | 155.8±24.3a | 71.1±16.4bc |
| Q | 133.4±23.0ab | 79.5±18.9ab | 181.2±25.5a | 117.4±24.8ab | 76.7±18.7b | |||||
| 8 | Number of probes before 1st E(pd) | 0.086 | <0.001 | 0.246 | B | 64.4±15.9a | 19.9±4.4bc | 31.3±9.5ab | 37.5±8.1ab* | 9.4±3.6c |
| Q | 36.6±9.8a | 24.9±6.7a | 24.1±6.8a | 19.5±6.3a | 15.4±5.1a | |||||
| 9 | Time to the 1st E(pd) within probe | 0.087 | 0.02 | 0.335 | B | 3.6±1.4a | 1.2±0.5a | 3.2±1.0a | 2.7±1.1a | 2.6±0.9a |
| Q | 5.7±1.4a | 2.6±1.5b | 23.8±22.1ab | 6.3±2.8ab | 5.4±2.3ab | |||||
| 10 | Duration of NP after 1st E(pd) | 0.002 | <0.001 | 0.843 | B | 3.7±2.5a | 3.4±1.4a | 6.0±2.3a | 7.8±2.6a | 17.7±6.9a |
| Q | 2.8±0.6b | 8.1±4.0b* | 7.9±3.3ab | 8.1±2.3ab | 21.0±9.1a | |||||
1 For parameters associated with time including “durations” and “time to an event”, all units are minutes.
The parameters 1-10 were calculated for each insect and then averaged over all insects.
Recording that begin with probe = the time when 1st probe begins = non-probing duration from begin of the recording to the 1st probe
Total number = number of occurrences of a specific waveform
Total duration = total time in a waveform (summed over all waveform occurrences)
Mean duration = average waveform duration (total time divided by number of occurrences)
Time to the 1st E(pd) within probe = time from beginning of a probe to the 1st E(pd) within that probe
2 Probabilities were calculated from a general linear model (Two-Way ANOVA) for a 2 x 5 factorial design (parameters 1-10). Significant
differences are highlighted in red (P ≤ 0.05).
3 Letters immediately after the mean values were derived from the comparisons of different host plants within the same whitefly species.
Means followed by the same letters do not differ significantly (Tukey test, P ≤ 0.05).
4 Comparison of feeding behaviors of B. tabaci B and Q adults on each of the five host plants. Significant differences are marked
with an asterisk (Independent-Samples T test, P ≤ 0.05)
Summary of EPG parameters associated with phloem feeding in B. tabaci during the 6h recording.
| Parameter1 | Probability2 | Biotype | Host Plant (Mean ± SE) | ||||||||
|---|---|---|---|---|---|---|---|---|---|---|---|
| Biotype | Host | Biotype*Host | Tomato | Cabbage | Cucumber | Cotton | Poinsettia | ||||
| 11 | Total duration of E(pd)1 | 0.892 | <0.001 | 0.048 | B | 0.6±0.2bc3 | 3.0±0.4a | 0.1±0.0c | 0.7±0.2b | 0.4±0.1bc | |
| Q | 1.1±0.3b | 2.3±0.5a | 0.2±0.1c*4 | 0.8±0.2bc | 0.4±0.1bc | ||||||
| 12 | Number of E(pd)1 | 0.375 | <0.001 | 0.178 | B | 4.3±1.0b | 16.7±2.2a* | 1.2±0.4c | 5.1±1.6b | 3.9±0.9b | |
| Q | 4.2±0.7b | 9.9±1.4a | 2.0±0.6c* | 4.2±1.0bc | 3.5±0.7bc | ||||||
| 13 | Mean duration of E(pd)1 | <0.001 | <0.001 | 0.157 | B | 0.1±0.0b | 0.2±0.0a | 0.1±0.0b | 0.1±0.0ab | 0.1±0.0ab | |
| Q | 0.2±0.0a* | 0.3±0.0a | 0.1±0.0b* | 0.2±0.0ab* | 0.1±0.0b | ||||||
| 14 | Total duration of E(pd)2 | 0.077 | <0.001 | 0.258 | B | 39.4±9.1ab | 90.8±9.8a | 34.3±9.5b | 19.4±5.8b | 28.5±7.7b | |
| Q | 67.4±10.2ab | 82.9±11.7a | 26.2±6.5c | 28.4±5.0bc | 45.1±7.0ab* | ||||||
| 15 | Number of E(pd)2 | 0.413 | <0.001 | 0.174 | B | 4.3±1.0b | 16.7±2.2a* | 1.2±0.4c | 5.0±1.6b | 3.9±0.9b | |
| Q | 4.2±0.7b | 9.9±1.4a | 2.1±0.6c | 4.2±1.0bc | 3.5±0.7bc | ||||||
| 16 | Mean duration of E(pd)2 | 0.001 | <0.001 | 0.007 | B | 13.0±3.4b | 7.8±1.6b | 39.7±7.7a* | 9.1±4.9b | 10.2±2.6b | |
| Q | 22.4±4.3a* | 10.6±2.0a | 16.8±2.8a | 11.1±2.2a* | 21.2±4.7a* | ||||||
| 17 | Potential E(pd)2 index | 0.633 | <0.001 | 0.006 | B | 0.2±0.1ab | 0.3±0.0a | 0.3±0.1ab* | 0.1±0.0b | 0.2±0.0ab | |
| Q | 0.3±0.0a | 0.3±0.0a | 0.1±0.0b | 0.1±0.0b | 0.3±0.1a | ||||||
| 18 | Total duration of E(pd) | 0.062 | <0.001 | 0.263 | B | 37.7±8.9ab | 93.8±9.9a | 34.4±9.5b | 20.1±5.9b | 28.9±7.7b | |
| Q | 68.5±10.3ab | 85.2±11.8a | 26.5±6.5c | 29.2±5.1bc | 45.4±7.0ab* | ||||||
| 19 | Mean duration of E(pd) | 0.005 | <0.001 | 0.007 | B | 13.1±3.4b | 8.0±1.6b | 39.8±7.7a | 9.2±4.9b | 10.3±2.6b | |
| Q | 22.6±4.3a* | 10.9±2.0a | 17.1±2.8a | 11.3±2.2a* | 21.3±4.7a* | ||||||
| 205 | Percentage of whitefly reaching phloem phase | - | - | - | B | 94.1a | 100a | 50b | 84.6ab | 88a | |
| Q | 92.0a | 100a | 57.7b | 76.9ab | 95.4a | ||||||
1 For parameters associated with time including 'durations' and 'time to an event', all units are minutes.
The parameters 11-19 were calculated for each insect and then averaged over all insects. Parameter 20 was calculated for all insects
of each treatment.
Total number = number of occurrences of a specific waveform
Total duration = total time in a waveform (summed over all waveform occurrences)
Mean duration = average waveform duration (total time divided by number of occurrences)
Potential E(pd)2 index = (total time in E(pd)2)/(Total recording time minus time to first E(pd)) (van Helden et al. 2000)
Percentage of whitefly reaching phloem phase = whitefly which reaching phloem phrase/all whiteflies tested in the treatment
2 Probabilities calculated from general linear model (Two-Way ANOVA) for a 2 x 5 factorial design (parameters 11-19).
Significant differences are highlighted in red (P ≤ 0.05).
3 Letters immediately after the mean values were derived from the comparisons of different host plants within the same whitefly species.
Means followed by the same letters do not differ significantly (Tukey test, P ≤ 0.05).
4 Comparison of feeding behaviors of B. tabaci B and Q adults on each of the five host plants. Significant differences are marked
with an asterisk (Independent-Samples T test, P ≤ 0.05)
5 Parameter 20 was analyzed with a Chi-square test
Whiteflies that did not go into the phloem phase within the recording period were included in the analysis and assigned pertinent parameters as follows: total number of phloem phases (E(pd), E(pd)1, E(pd)2) =0; total duration of phloem phases (E(pd), E(pd)1, E(pd)2) =0; time from 1st probe to 1st E(pd) equals the total recording time minus the time of 1st probe. For other parameters including time to the 1st E(pd) within probe, duration of 1st NP after 1st E(pd), and mean duration of phloem phases (E(pd), E(pd)1, E(pd)2), even if whiteflies did not reach the phloem within the 6 h recording period, they may reach the phloem layer later. Consequently, we selected to statistically exclude these whiteflies from the data set (Table 1 and 2).
RESULTS
Host suitability toward B. tabaci B and Q
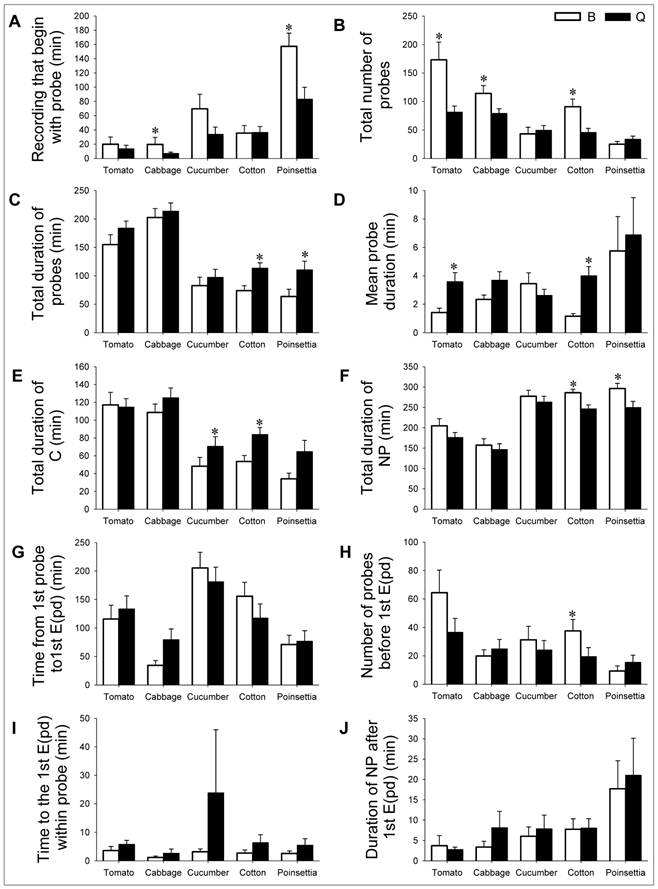
Host plant acceptance for B. tabaci B: In the non-phloem phase, B attempted the most probes, and made the longest pathway, and the most probes before the 1st phloem phase on tomato (Table 1, parameter 2, 5 and 8; Fig. 2B, E, and H). B had the longest non-probing duration before 1st probe, mean probe duration, and total duration of non-probing on poinsettia (Table 1, parameter 1, 4, and 6; Fig. 2A, D, and F). The total duration of probes and the time from 1st probe to 1st phloem phase were longest on cabbage and cucumber, respectively (Table 1, parameters 3 and 7; Fig. 2C and G). While B had the lowest total number of probes, total duration of probes, pathway phase, and the lowest number of probes before the 1st phloem phase on poinsettia (Table 1, parameters 2, 3, 5, and 8; Fig. 2B, C, E, and H), B also had the shortest non-probing duration before 1st probe, total duration of non-probing, and time from 1st probe to phloem phase on cabbage (Table 1, parameters 1, 6, and 7; Fig. 2A, F, and G). In addition, the mean probe duration was lowest on cotton. (Table 1, parameter 4; Fig. 2D).
EPG parameters associated with non-phloem feeding. To study the host suitability, feeding behavior of B. tabaci B and Q on each of the five host plants was documented by these EPG parameters. Values are means ± SE. Bars with asterisk indicate a statistically significant difference between the two whiteflies on each host (Independent Samples t-test, P < 0.05).
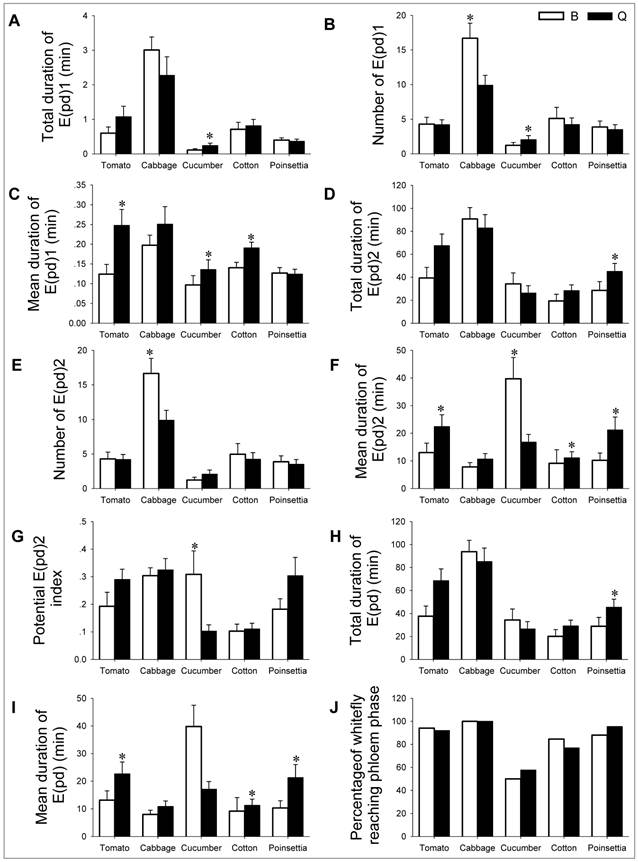
In the phloem phase, parameters associated with salivation including the total duration of E(pd)1, number of E(pd)1, and mean duration of E(pd)1 were highest on cabbage, followed by cotton, tomato, poinsettia, and lowest on cucumber (Table 2, parameters 11-13; Fig. 3A-C). B also had the highest total ingestion on cabbage (Table 2, parameters 14 and 15; Fig. 3D and E), although the mean ingestion duration on cucumber was the longest (Table 2, parameter 16; Fig. 3F). The ingestion parameters were similar on other hosts (Table 2, parameters 14, 15, 16, and 17; Fig. 3D-G). Consequently, the total duration of phloem phase was highest on cabbage (Table 2, parameter 18; Fig. 3H), and the mean duration of phloem phase was longest on cucumber (Table 2, parameter 19; Fig. 3I).
EPG parameters associated with phloem feeding. To study the host suitability, feeding behavior of B. tabaci B and Q on each of the five host plants was documented by these EPG parameters. Values are means ± SE. Bars with asterisk indicate a statistically significant difference between the two whiteflies on each host (independent Samples t-test, P < 0.05).
Host plant acceptance for B. tabaci Q: In the non-phloem phase, Q attempted the most probes and had the longest duration of probes and pathway phase on cabbage (Table 1, parameter 2, 3, and 5; Fig. 2B, C, and E). Q also had the longest non-probing duration before 1st probe, mean probe duration and duration of non-probing after 1st phloem phase on poinsettia (Table 1, parameter 1, 4, and 10; Fig. 2A, D, and J). The total duration of non-probing and the time from 1st probe to 1st phloem phase were longest on cucumber (Table 1, parameters 6 and 7; Fig. 2F and G). While Q had least probes, shortest pathway phase and the duration from 1st probes to 1st phloem phase on poinsettia (Table 1, parameters 2, 5, and 7; Fig. 2B, E, and G). Q also had the shortest non-probing duration before 1st probe, total duration of non-probing and time to the 1st phloem phase in a successful probe on cabbage (Table 1, parameters 1, 6 and 9; Fig. 2A, F, and I). The total and mean probe duration were both lowest on cucumber (Table 1, parameters 3 and 4; Fig. 2C and D), and the duration of non-probing after 1st phloem was shortest on tomato (Table 1, parameter 10; Fig. 2J).
In the phloem phase, parameters associated with salivation including the total duration of E(pd)1, number of E(pd)1, and mean duration of E(pd)1) were highest on cabbage, followed by tomato, cotton, poinsettia, and lowest on cucumber (Table 2, parameters 11-13; Fig. 3A-C). Q also had the most total ingestion, ingestion times and potential ingestion index on cabbage (Table 2, parameters 14, 15 and 17; Fig. 3D, E, and G). Consequently, the total duration of phloem phase was highest on cabbage and lowest on cucumber (Table 2, parameter 18; Fig. 3H). The mean duration of phloem phase, however, was longest on tomato (Table 2, parameter 19; Fig. 3I). In addition, the percentage of B. tabaci B and Q reached phloem phase was lowest on cucumber (<60%), but similarly distributed among the other four host plants (77 -100%; Table 2, parameter 20; Fig. 3J).
Feeding behaviors of B. tabaci B and Q on different host plants Tomato: Two of the parameters not related to phloem phase differed significantly between B and Q. Q sustained significantly longer mean probe duration and attempted significantly fewer probes than B (Table 1, parameters 4 and 2; Fig. 2D and B). Parameters related to salivation in phloem phase and ingestion of phloem sap differed significantly between the two whiteflies (Table 2, parameters 13 and 16; Fig. 3C and F). Given the substantially greater phloem sap ingestion and phloem salivation in Q, it was not surprise that Q had significantly longer mean duration of E(pd)in phloem phase (ingestion + salivation) than B (Table 2, parameter 19; Fig. 3I).
Cabbage: Three parameters related to non-phloem phase differed significantly between B and Q. The duration of non-probing immediately after the 1st phloem probe for B was significantly shorter than Q (Table 1, parameter 10; Fig. 2G). B also had longer non-probing phase before 1st probe and attempted significantly more probes than Q (Table 1, parameters 1 and 2; Fig. 2A and B). In phloem phase, B had significantly higher salivation times and sap ingestion times than Q (Table 2, parameters 12 and 15; Fig. 3B and E).
Cucumber: One of the non-phloem parameters, total duration of pathway waveform, was higher in Q than in B (Table 1, parameter 5; Fig. 2E). Parameters related to phloem salivation were all significantly greater in Q than in B (Table 2, parameters 11, 12, and13; Fig. 3A, B, and C). However, two of the phloem ingestion parameters were significantly higher in B than in Q (Table 2, parameters 16 and 17; Fig. 3F and G).
Cotton: In non-phloem phase, 6 parameters were all differed significantly between B and Q. B attempted significantly more probes, had a longer duration of non-probing phase, and had more probes before 1st phloem phase than Q (Table 1, parameters 2, 6 and 8; Fig. 2B, F and H). However, Q sustained a significantly longer mean probe duration, total duration of probes, and total duration of pathway phase than B (Table 1, parameters 4, 3 and 5; Fig. 2D, C and E). In phloem phase, the mean duration of salivation and mean duration of sap ingestion were longer in Q than in B (Table 2, parameters 13 and 16; Fig. 3C and F). Consequently, Q sustained significant longer mean duration of phloem phase (ingestion + salivation) than B (Table 2, parameter 19; Fig. 3I).
Poinsettia: Three parameters related to non-phloem phase differed significantly between B and Q. B sustained significantly longer non-probing duration and non-probing duration before 1st probe than Q (Table 1, parameters 6 and 1; Fig. 2F and A). However, Q made significantly longer total duration of probes than B (Table 1, parameter 3; Fig. 2C). In the phloem phase, Q ingested significantly more phloem sap than B (Table 2, parameters 16 and 14; Fig. 3F and D). Consequently, Q had significantly longer phloem phase than B (Table 2, parameters 18 and 19; Fig. 3H and I).
DISCUSSION
Difference in host suitability toward B. tabaci B and Q
Insect selection of host plants during initial stage of feeding is often determined by factors that can be detected by insect antennae and mouthparts such as glandular trichomes and the thickness of the epidermal cuticle and/or wax [39]. Data from both non-phloem and phloem phases show that the suitability of five host plants to B and Q shares a similar pattern, suggesting that the B and Q respond similarly to factors on the plant surface or in the plant tissue. Specifically, based on the probing parameter (parameter 1), the order of host plant suitability from highest to lowest was cabbage ≥ tomato ≥ cotton = cucumber ≥ poinsettia for Q, and cabbage = tomato ≥ cotton = cucumber > poinsettia for B. Similarly, the plant acceptance order for B. tabaci according to the ingestion parameter (parameter 18) was cabbage ≥ tomato ≥ poinsettia ≥ cotton ≥ cucumber for Q, and cabbage ≥ tomato ≥ poinsettia = cucumber = cotton for B. However, the suitability in non-phloem phase was not fully consistent with that in phloem phase. For example, poinsettia is the least suitable host for both whitefly species in non-phloem phase but was the intermediate host in phloem phase. The discrepancy might come from resistance factors in the sieve elements once the whitefly's stylet has traversed the cuticle, epidermis, mesophyll, and vascular tissue successively. Nevertheless, the combined EPG results from both non-phloem and phloem phases suggest that, in general, cabbage was the most suitable host plant for whiteflies, followed by tomato and poinsettia. Cotton and cucumber were the least suitable hosts.
Difference in feeding behavior between B. tabaci B and Q
Pair-wise comparisons of B. tabaci B and Q feeding on each of the five host plants indicates that Q feeds better on tomato, cotton, and poinsettia, while B thrives on cabbage and cucumber. This conclusion is clearly supported by the parameters related to phloem phase. On tomato and cotton plants, Q had a longer mean duration of salivation, ingestion and phloem phase (salivation + ingestion) than B. On poinsettia, Q spent significantly more time in sap ingestion and phloem phase during the full recording time than B. In contrast, B spent substantially more time than Q in salivation and ingestion on cabbage. B also had longer mean duration of sap ingestion and higher potential ingestion index than Q on cucumber, although it spent less time in salivation.
Similar to the phloem phase, the majority of the EPG parameters associated with the non-phloem phase were supportive of the conclusions from the phloem phase. On tomato, Q made fewer probes with a longer mean duration of probe than B. On cotton, Q also made less probes, probes before 1st phloem phase, and non-probing phase, longer total duration of probes and pathway phase than B. On poinsettia, Q fed earlier and had a longer probe duration and shorter non-probing duration than B. In contrast, B fed earlier and had a shorter non-probing duration after 1st phloem phase than Q on cabbage.
Role of host suitability in the competitive displacement
The amount of time insects spend in phloem phase is an important indicator of host suitability. Our current results from phloem phase suggest that tomato, cotton and poinsettia are more suited for Q, while cabbage and cucumber are more suited for B. This is consistent with a previous report in which B. tabaci Q from Spain spent longer phloem ingestion time on tomato than B[30]. On the other hand, non-phloem parameters are closely associated with factors on the plant surface including epidermis and mesophyll [35]. Whitefly stylets that pierce tissue layers between the epidermis and the phloem may encounter factors that affect their perception of the host plant's suitability [40, 23-25]. In this study, results derived from the non-phloem parameters were generally in concert with the phloem phase. Moreover, the statistical analyses of the entire EPG dataset showed that host plants had significant impacts on 19 parameters, whereas whitefly had substantial impacts on 8 (Table 1 and 2), indicating that host plants differ significantly in their suitability to insect pests. To our surprise, interactions between insect and host plant were not as strong as indicated previously [41], in which 6 parameters including 4 from the phloem phase and 2 from the non- phloem phase exhibited significant interactions.
The host plants selected in this study represent vegetables, flowers, and cash crops widely cultivated in greenhouses and open fields in China. Combined results from both insect and host plants suggest that host suitability and feeding behaviors displayed by adult whiteflies can affect their interaction and may contribute to the rapid competitive displacement observed in China over the past 6 years. It is worth noting, however, the bi-directional host suitability and adult feeding behaviors observed in the laboratory-confined study alone (this research) could not explain the directional displacement of B. tabaci B by Q in the field. [10-15] A plausible explanation for the discrepancy between field observations and laboratory results are i) whitefly competitive displacement is governed by multiple factors including both abiotic factors (e.g., temperature and humidity) and biotic factors (e.g., virus infection, natural enemies, and insecticide resistance); ii) host suitability and adult feeding behaviors is one of the contributing biotic factors, but apparently, iii) factor(s) other than the host plant suitability may play a major role in the observed competitive displacement of whitefly biotypes in the field. A parallel study looking into how insecticide resistance impact the competitiveness of whitefly biotypes is currently underway and we should have a better understanding of the competitive displacement in whiteflies upon the conclusion of this study.
Acknowledgements
Authors thank W.F. Tjallingii for his help in the DC-EPG and H.D. Yin & K. Xue for their assistances in data analyses. Special thanks go to John J. Obrycki (University of Kentucky) and anonymous reviewers for their comments and constructive criticisms. This work was funded by National Science Fund for Distinguished Young Scholars (31025020), Key Project of Chinese National Programs for Fundamental Research and Development (2009CB119200, 2009CB119004), National Natural Science Foundation of China (31171857), Outstanding Youth Science Foundation of Shandong Province (JQ200811), and Key Laboratory of Biology and Genetic Improvement of Horticultural Crops, Ministry of Agriculture, P. R. China.
COMPETING INTERESTS
The authors have declared that no competing interest exists.
References
1. Brown JK, Frohlich DR, Rosell RC. The sweetpotato or silverleaf whiteflies: biotypes of Bemisia tabaci or a species complex? Annu Rev Entomol. 1995;40:511-534
2. Perring TM. The Bemisia tabaci species complex. Crop Prot. 2001;20:725-737
3. Dinsdale A, Cook L, Riginos C. et al. Refined global analysis of Bemisia tabaci (Hemiptera: Sternorrhyncha: Aleyrodoidea: Aleyrodidae) mitochondrial cytochrome oxidase 1 to identify species level genetic boundaries. Ann Entomol Soc Am. 2010;103:196-208
4. De Barro PJ, Liu SS, Boykin LM. et al. Bemisia tabaci: a statement of species status. Annu Rev Entomol. 2011;56:1-19
5. Ahmed MZ, Ren SX, Mandour NS. et al. Phylogenetic analysis of Bemisia tabaci (Hemiptera: Aleyrodidae) populations from cotton plants in Pakistan, China, and Egypt. J Pest Sci. 2010;83:135-141
6. Zhou Y. The list of whiteflies in China. China Entomol. 1949;3:1-18
7. Luo C, Yao Y, Wang RJ. et al. The use of mitochondrial cytochrome oxidase I (mtCOI) gene sequences for the identification of biotype of Bemisia tabaci (Gennadius) in China. Acta Entomol Sin. 2002;45:759-763
8. Liu SS, De Barro PJ, Xu J. et al. Asymmetric Mating interactions drive widespread invasion and displacement in a whitefly. Science. 2007;318:1769-1772
9. Chu D, Zhang YJ, Brown JK. et al. The introduction of the exotic Q biotype of Bemisia tabaci (Gennadius) from the Mediterranean region into China on ornamental crops. Fla Entomol. 2006;89:168-174
10. Chu D, Wan FH, Zhang YJ. et al. Change in the biotype composition of Bemisia tabaci in Shandong Province of China from 2005 to 2008. Environ Entomol. 2010;39:1028-1036
11. Chu D, Zhang YJ, Wan FH. Cryptic invasion of the exotic Bemisia tabaci biotype Q occurred widespread in Shandong Province of China. Fla Entomol. 2010;93:203-207
12. Rao Q, Luo C, Zhang H. et al. Distribution and dynamics of Bemisia tabaci invasive biotypes in central China. Bull Entomol Res. 2011;101:81-88
13. Teng X, Wan FH, Chu D. Bemisia tabaci biotype Q dominates other biotypes across China. Fla Entomol. 2010;93:363-368
14. Pan HP, Chu D, Ge DQ. et al. Further spread of and domination by Bemisia tabaci (Hemiptera:Aleyrodidae) biotype Q on field crops in China. J Econ Entomol. 2011;104:978-985
15. Hu J, De Barro P, Zhao H. et al. An extensive field survey combined with a phylogenetic analysis reveals rapid and widespread invasion of two alien whiteflies in China. PLoS ONE. 2011;6:e16061
16. Crowder DW, Horowitz AR, De Barro PJ. et al. Mating behaviour, life history and adaptation to insecticides determine species exclusion between whiteflies. J Anim Ecol. 2010;79:563-570
17. Crowder DW, Sitvarin MI, Carrière Y. Plasticity in mating behaviour drives asymmetric reproductive interference in whiteflies. Anim Behav. 2010;79:579-587
18. Mclean DL, Kinsey MG. A technique for electronically recording aphid feeding and salivation. Nature. 1964;202:1358-1359
19. Tjallingii WF. Electrical nature of recorded signals during stylet penetration by aphids. Entomol Exp Appl. 1985;38:177-186
20. Tjallingii WF. Electronic recording of penetration behaviour by aphids. Entomol Exp Appl. 1978;24:521-530
21. Lei H, Tjallingii WF, van Lenteren JC. et al. Stylet penetration by larvae of the greenhouse whitefly on cucumber. Entomol Exp Appl. 1996;79:77-84
22. Lei H, Tjallingii WF, van Lenteren JC. Effect of tethering during EPG recorded probing by adults of the greenhouse whitefly. J Appl Entomol. 1997;121:211-217
23. Lei H, Tjallingii WF, van Lenteren JC. Probing and feeding characteristics of the greenhouse whitefly in association with host-plant acceptance and whitefly strains. Entomol Exp Appl. 1998;88:73-80
24. Lei H, van Lenteren JC, Tjallingii WF. Analysis of resistance in tomato and sweet pepper against the greenhouse whitefly using electrically monitored and visually observed probing and feeding behaviour. Entomol Exp Appl. 1999;92:299-309
25. Lei H, van Lenteren JC, Xu RM. Effects of plant tissue factors on the acceptance of four greenhouse vegetable host plants by the greenhouse whitefly: an electrical penetration graph (EPG) study. Eur J Entomol. 2001;98:31-36
26. Janssen JAM, Tjallingii WF, van Lenteren JC. Electrical recording and ultrastructure of stylet penetration by the greenhouse whitefly. Entomol Exp Appl. 1989;52:69-81
27. Walker GP, Perring TM. Feeding and oviposition behavior of whiteflies (Homoptera, Aleyrodidae) interpreted from AC electronic feeding monitor waveforms. Ann Entomol Soc Am. 1994;87:363-374
28. Johnson DD, Walker GP. Intracellular punctures by the adult whitefly Bemisia argentifolii on DC and AC electronic feeding monitors. Entomol Exp Appl. 1999;92:257-270
29. Johnson DD, Walker GP, Creamer R. Stylet penetration behavior resulting in inoculation of a semipersistently transmitted closterovirus by the whitefly Bemisia argentifolii. Entomol Exp Appl. 2002;102:115-123
30. Jiang YX, Lei H, Collar JL. et al. Probing and feeding behavior of two distinct biotypes of Bemisia tabaci (Homoptera: Aleyrodidae) on tomato plants. J Econ Entomol. 1999;92:357-366
31. Jiang YX, Blas C, Barrios L. et al. Correlation between whitefly (Homoptera: Aleyrodidae) feeding behavior and transmission of tomato yellow leaf curl virus. Ann Entomol Soc Am. 2000;93:573-579
32. Jiang YX, Nombela G, Muniz M. Analysis by DC-EPG of the resistance to Bemisia tabaci on an Mi-tomato line. Entomol Exp Appl. 2001;99:295-302
33. Jiang YX, Walker GP. Pathway phase waveform characteristics correlated with length and rate of stylet advancement and partial stylet withdrawal in AC electrical penetration graphs of adult whiteflies. Entomol Exp Appl. 2001;101:233-246
34. Jiang YX, Walker GP. Identification of phloem sieve elements as the site of resistance to silverleaf whitefly in resistant alfalfa genotypes. Entomol Exp Appl. 2007;125:307-320
35. Yin HD, Wang XY, Xue K. et al. Impacts of transgenic Bt cotton on the stylet penetration behaviors of Bemisia tabaci biotype B: Evidence from laboratory experiments. Insect Sci. 2010;17:344-352
36. Mayoral AM, Tjallingii WF, Castañera P. Probing behaviour of Diuraphis noxia on five cereal species with different hydroxamic acid levels. Entomol Exp Appl. 1996;78:341-348
37. Khasdan V, Levin I, Rosner A. et al. DNA markers for identifying biotypes B and Q of Bemisia tabaci (Hemiptera: Aleyrodidae) and studying population dynamics. Bull Entomol Res. 2005;95:605-613
38. van Helden M, Tiallingjj WF. Tissue localisation of lettuce resistance to the aphid Nasonovia ribisnigri using electrical penetration graphs. Entomol Exp Appl. 1993;68:269-278
39. Xue K, Wang XY, Huang CH. et al. Stylet penetration behaviors of the cotton aphid Aphis gossypii on transgenic Bt cotton. Insect Sci. 2008;16:137-146
40. Walker GP. The role of leaf cuticle in leaf age preference by bayberry whitefly (Homoptera: Aleyrodidae) on lemon. Ann Entomol Soc Am. 1998;81:365-369
41. Xu J, Lin KK, Liu SS. Performance on different host plants of an alien and an indigenous Bemisia tabaci from China. J Appl Entomol. 2011;135:771-779
Author contact
![]() Corresponding author: Dr. Youjun Zhang. Department of Entomology, Institute of Vegetables and Flowers. Chinese Academy of Agricultural Sciences, No. 12 Zhongguancun Nandajie, Haidian District, Beijing 100081, China. Phone: 86-10-82109518. Fax: 86-10-82109518. Email: zhangyjcaas.net.cn. Dr. Xuguo "Joe" Zhou. Department of Entomology, University of Kentucky, S-225 Agricultural Science Center North. Lexington, KY 40546-0091. Phone: 859-257-3125. Fax: 859-323-1120. Email: xuguozhouedu
Corresponding author: Dr. Youjun Zhang. Department of Entomology, Institute of Vegetables and Flowers. Chinese Academy of Agricultural Sciences, No. 12 Zhongguancun Nandajie, Haidian District, Beijing 100081, China. Phone: 86-10-82109518. Fax: 86-10-82109518. Email: zhangyjcaas.net.cn. Dr. Xuguo "Joe" Zhou. Department of Entomology, University of Kentucky, S-225 Agricultural Science Center North. Lexington, KY 40546-0091. Phone: 859-257-3125. Fax: 859-323-1120. Email: xuguozhouedu