Impact Factor ISSN: 1449-2288
- Issue 12; 2026
- Issue 11; 2026
- Issue 10; 2026
- Issue 9; 2026
- Issue 8; 2026
- Volume 22; 2026
- Past Issues
- Advance Articles
- Editorial Board
- Cover Images
- Index & Coverage
- Cover Suggestion
- Special Issues
Introduction
Materials and Methods
Results
Discussion
Abbreviations
Acknowledgements
References
Author Biography

 Global reach, higher impact
Int J Biol Sci 2012; 8(7):992-1004. doi:10.7150/ijbs.4454 This issue Cite
Research Paper
CD133+EpCAM+ Phenotype Possesses More Characteristics of Tumor Initiating Cells in Hepatocellular Carcinoma Huh7 Cells
Yi Chen, Dongke Yu, Hao Zhang, Hongwei He, Caixia Zhang, Wuli Zhao, Rong-guang Shao ![]()
Laboratory of Oncology, MOH Key Laboratory of Antibiotic Bioengineering, Institute of Medicinal Biotechnology, Chinese Academy of Medical Sciences & Peking Union Medical College, 1# Tiantan Xili, Beijing 100050, China.
Received 2012-4-9; Accepted 2012-7-24; Published 2012-8-1
Abstract
Background: EpCAM or CD133 has been used as the tumor initiating cells (TICs) marker in hepatocellular carcinoma (HCC). We investigated whether cells expressing with both EpCAM and CD133 surface marker were more representative for TICs in hepatocellular carcinoma Huh7 cells.
Methods: Four different phenotypes of CD133+EpCAM+, CD133+EpCAM-, CD133-EpCAM+ and CD133-EpCAM- in Huh7 cells were sorted by flow cytometry. Then cell differentiation, self-renewal, drug-resistance, spheroid formation and the levels of stem cell-related genes were detected to compare the characteristics of TICs. The ability of tumorigenicity was measured in nonobese diabetic/severe combined immunodeficient (NOD/SCID) mice to verify TICs.
Results: CD133+EpCAM+ cells have many characteristics of TICs in Huh7 cells compared with CD133+EpCAM-, CD133-EpCAM+, CD133-EpCAM- cells, including enrichment in side population cells, higher differentiation capacity, increased colony-formation ability, preferential expression of stem cell-related genes, appearance of drug-resistant to some chemotherapeutics, more spheroid formation of culture cells and stronger tumorigenicity in NOD/SCID mice.
Conclusion: CD133+EpCAM+ phenotype is precisely represented TICs in Huh7 cells. It might be useful for studying biology mechanism of TICs in hepatocellular carcinoma and screening new targets for cancer therapy.
Keywords: Tumor initiating cells, Hepatocellular carcinoma, CD133, EpCAM.
Introduction
Liver cancer in men is the fifth common cancer worldwide [1]. More than 90% of primary liver cancers represent hepatocellular carcinoma (HCC) [2]. Although chemotherapy and transplantation are used in clinic, the mortality of HCC still remains high [1]. It is attributed to recurrence and drug-resistance.
Tumor initiating cells (TICs) hypothesis provides a new insight into the formation of tumors. According to this hypothesis, TICs are considered with stem cell properties: self-renewal, differentiation, resistance and tumorigenicity as original [3]. TICs have been identified in some solid tumors, such as breast [4], brain [5], prostate [6], lung [7], head and neck [8], colon [9], pancreatic [10] cancers and melanoma [11]. More recently, there have been many researches revealed the existence of TICs in HCC. Several surface markers are used including CD133 [12-14], CD90 [15-16], CD44 [17], EpCAM [18-19], CD13 [20], OV6 [21], and ALDH [22]. Cells with different markers possess similar TICs properties, but show great heterogeneity sorted from different laboratories. So until now, there are no generally accepted TICs markers in HCC.
CD133, a 5-transmembrane domain glycoprotein, expresses in normal [23] and tumor tissues. The function of CD133 is not entirely known yet, however it has been used as a marker of TICs in many solid tumors, including liver cancer [12-14]. Differential expression of CD133 in several HCC cells is confused. Thus, CD133 alone is not sufficient to detect TICs in HCC [24]. Recently, EpCAM has been identified as a potential marker of TICs in HCC. CD133 or EpCAM has been used as a surface marker of Huh7 TICs separately [13, 18]. However, EpCAM highly co-expresses with CD133 in Huh7 cells [18].
Therefore, we hypothesized that cells expressing with both EpCAM and CD133 surface marker were more representative for TICs in Huh7 cells. In this study, CD133+EpCAM+, CD133+EpCAM-, CD133-EpCAM+ and CD133-EpCAM- phenotypes in Huh7 cells were sorted to compare the characteristics of TICs. In vitro, colony ability, differentiation potential, resistance, spheroid assay and stem cell-related genes expression were measured by cell culture. Furthermore, the ability of tumorigenicity in vivo was detected in NOD/SCID mice.
Materials and Methods
Animals Care and Ethics Statement
Pathogen-free NOD/SCID female mice aged 5-6 weeks were purchased from the Animal Institute of the Chinese Academy of Medical Science (CAMS). These animals were housed in pathogen-free conditions and provided food and water at the Institute of Medicinal Biotechnology of CAMS facility. All animal studies were approved by the animal ethical committee of CAMS. This study was carried out in strict accordance with the recommendations in the Guide for the Care and Use of Laboratory Animals of CAMS (Permit Number: SYXK (Jing) 2007-0013).
Cell culture
Human hepatocellular carcinoma Huh7 cells were obtained from the ATCC (Frederick, MD). Huh7 cells were cultured in DMEM supplemented with 10% inactivated fetal bovine serum and 1% penicillin-streptomycin (Gibco, USA). Human hepatocellular carcinoma Bel7402, Bel7404 and HepG2 cells were provided by the Cell Bank of Institute for Biological Sciences, China Academy of Sciences (Shanghai, China). Human hepatocellular carcinoma SMMC7721 cell was obtained from Cancer Institute of CAMS (Beijing, China). These four cell lines were cultured in RPMI 1640 medium (Hyclone, UT) supplemented with 10% inactivated fetal bovine serum and 1% penicillin-streptomycin. All cells were incubated at 37ºC with 5% CO2.
Flow cytometry analysis and sorting
Cells were resuspended in PBS and incubated with FcR blocking reagent (Miltenyi Biotec, Germany) for 10 min. Then cells were stained with the directly conjugated monoclonal antibodies, anti-human CD133-PE, anti-human IgG-PE isotype (Miltenyi Biotec, Germany), anti-human EpCAM-APC, anti-human IgG-APC isotype (R&D, USA) for 30-40 min in 4ºC. IgG isotype control was incubated in parallel. Flow cytometry analysis was performed on Accuri C6 (BD Biosciences, CA) using CFlow (BD Biosciences, CA) software. Cell sorting was performed on BD FACS Aria I (BD Biosciences, CA) using FlowJo (Tree Star, Oregon) software. Sorted cells were cultured in DMEM supplemented with 15% FBS for 7 days, then detected again by flow cytometry.
Side population analysis
Cells were suspended at 1×10⁶ cells/mL in DMEM medium with 2% fetal calf serum and 10 mM Hepes. These cells were incubated at 37℃ for 120 min with 5 μg/mL Hoechst 33342 (Sigma, USA) with intermittent mixing, either alone or in the presence of 50 μM verapamil (Sigma, USA). After incubation, cells were washed by PBS solution supplemented with 2% fetal calf serum and 10 mM Hepes. Then cells were incubated with appropriate concentration of anti-human CD133-PE and anti-human EpCAM-APC as mentioned in flow cytometry analysis. Cells analysis and purification were performed on FACS Aria II (BD Biosciences, CA). The expression of CD133 and EpCAM were detected in enriched side population (SP) and non-side population (Non-SP) cells.
Western blot analysis
Briefly as described previously [25-26], quantified protein lysates were separated by SDS-PAGE, transferred to polyvinylidene difluoride membrane (Millipore, USA) and probed with primary rabbit anti-EpCAM (1:500, Cell Signaling Technology, USA), mouse anti-CD133 (1:200, Miltenyi Biotec, Germany), rabbit anti-β-tublin (1:500, Santa Cruz, CA) overnight at 4ºC. Then the membranes were blotted with an appropriate horseradish peroxidase-linked rabbit or mouse secondary antibody (1:3000, Cell Signaling Technology, USA). Electrochemiluminescence was performed according to the manufacturer's instructions with ChemiImager 5500 imaging system (Alpha Innotech Co., CA). β-tublin was used as loading control.
Immunofluorescence assay
Cells were stained with rabbit anti-EpCAM (Cell Signaling Technology, USA) and mouse anti-CD133 (Miltenyi Biotec, Germany) as primary antibodies. FITC-conjugated anti-rabbit IgG (R&D, USA) or Rhodamine-conjugated anti-mouse IgG (Beyotime, China) were used as secondary antibodies. In the end, cells were counterstained with Hoechst 33358 (Beyotime, China) and photographed under a microscope (Nikon, Japan).
Plate colony formation assay
Sorted cells were seeded at a density of 5,000 cells per well in 6-well plates and cultured for 14-21 days. Cells were fed with new culture medium every 3 days. Primary colonies were trypsinized into single cell and counted, and then cells were replanted and cultured under the same conditions. In the end, cells were stained with hematoxylin (Beyotime, China), photographed by ImageQuant gel imager (GE, UK) and counted.
Soft agar colony formation assay
Various phenotype cells were detected with CytoSelect 96-Well Cell Transformation Assay (Cell Biolabs, USA). In brief, the mixture, containing 1.2% agar solution, 2×DMEM medium and 1,500 sorted cell suspension (1:1:1), was added into 96-well microplate. Plates were incubated for 8-10 days, and then performed quantitation of cell growth using the fluorescence measurement on EnVision Multilabel Reader (PerkinElmer, USA) with a 485/520 nm filter set [27]. Colonies were visualized by 0.1% P-Iodonitrotetrazolium violet (INT, Sigma, USA) staining and photographed by inverted microscope (Olympus, USA).
Drug resistance
After four sorted phenotypes were incubated for 48 h, IC50 concentration of 5-fluorouracil (5-FU) or doxorubicin (DOX) (Sigma, USA) was added. Then cells were incubated for an additional 48 h. Cell viability was determined by SRB cell proliferation assay as previous described [28].
RNA isolation and real-time PCR
Total mRNA was extracted from the cells by TRIzol reagent (Invitrogen, CA) with an extra step of acid phenol extraction. RT-PCR was carried out using a SuperScriptTM one-step RT-PCR kit (Invitrogen, CA) as described previously [25]. Real-time quantitative PCR amplification was performed with FastStart Universal Probe Master Mix (Roche, Germany) in CFX96 Real-time System (Bio-Rad, USA). TaqMan PCR primers and probes specific for human Nanog (assay ID: Hs02387400_g1*), Sox2 (assay ID: Hs01053049_s1) and Oct4 (assay ID: Hs00742896_s1) were obtained from Applied Biosystems (USA). Endogenous control GAPDH primers and probe were synthesized by Takara (Kyoto, Japan) as follows hGAPDHF: 5'-GGA CCT GAC CTG CCG TCT A-3'; hGAPDHR: 5'-TAG CCC AGG ATG CCC TTG AG-3'; hGAPDHP: 5' -CCT CCG ACG CCT GCT TCA CCA CCT-3'.
Spheroid formation
Cells free from serum were suspended in modified DMEM/F12 medium supplemented with 2% stem supplement, 2% B27 supplement, 1% penicillin-streptomycin, 1.8% bovine serum albumin (Gibco, USA), 20 ng/mL epidermal growth factor (EGF), 10 ng/mL basic fibroblast growth factor (bFGF, Invitrogen, CA), 5 μg/mL insulin (Sigma, USA), 50 ng/mL heparin (Stem cell Technologies, CA) [29]. The cells were subsequently cultured in ultra low attachment 24-well plates (Corning, USA) at a density of 5,000 cells per well. After 7 days of culture, spheres were counted and photographed under microscope (Nikon, Japan).
In vivo tumorigenicity assay
Freshly sorted cells were collected in sterile DMEM without FBS. 200 μL cell suspension, mixed with matrigel (BD Biosciences, CA) (1:1), was subcutaneously injected into each NOD/SCID mouse. CD133+EpCAM+ and CD133-EpCAM- cells were injected into two opposite sites of same mouse, while CD133+EpCAM- and CD133-EpCAM+ cells were injected into same mouse. The incidence of tumors was examined bi-weekly. After anaesthesia with chloral hydrate, mice were killed at 90 days after injection. The tumors were fixed with 4% paraformaldehyde and stained with hematoxylin-eosin (H&E).
Statistical analysis
Data of flow cytometry were expressed as the arithmetic mean. Other data were expressed as the arithmetic mean ± SD. Statistical analysis was performed using the t test. Probability of tumorigenicity in the study was analyzed by the Kaplan-Meyer method. P<0.05 was considered statistically significant.
Results
Differential expression of CD133 and EpCAM in HCC cells
The flow cytometry results showed that CD133 and EpCAM expressed differentially in Bel7404, Bel7402, Huh7, SMMC7721 and HepG2 cell surfaces (Fig. 1A). CD133 and EpCAM were obviously co-expressed only in Huh7 cells compared with other HCC cells. Consistent with these results, the expression of CD133 and EpCAM in HCC cells were also confirmed by western blot analysis (Fig. 1B). In Huh7 cells, the co-expression of CD133 and EpCAM were observed in cytoplasm and membrane (Fig. 2A). It suggested that CD133 and EpCAM were related to each other in Huh7 cells.
Expression of CD133 and EpCAM in hepatocellular carcinoma (HCC) cells. A. The surface expression of CD133 and EpCAM were detected by flow cytometry in various HCC cells. B. The protein levels of CD133 and EpCAM were detected by western blot. β-tublin was used as an internal control.

Expression of CD133 and EpCAM in normal and SP Huh7 cells. A. In immunofluorescence analysis, Huh7 cells were stained with anti-CD133 (red) and anti-EpCAM (green) antibodies. Nuclei (blue) are labeled with Hoechst 33358 dye. B. SP cells were identified as the poorly staining cell population (black triangle P2) that largely disappeared when verapamil was used. Then expression of CD133 and EpCAM were detected by flow cytometry in enriched SP and non-SP cells. SP, side population.
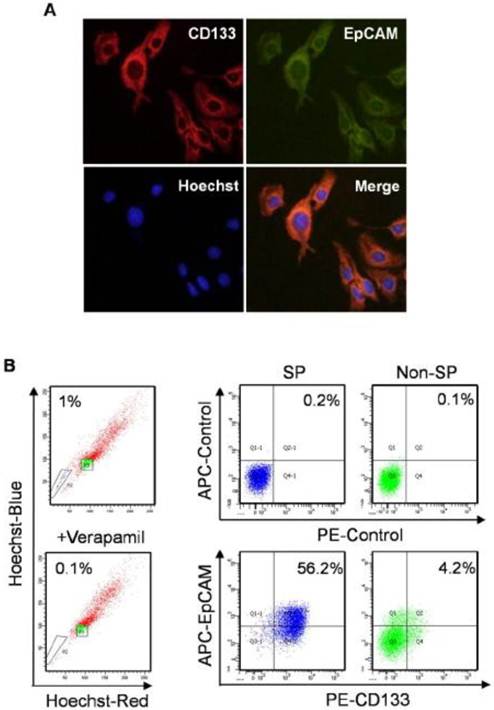
Preferential expression of CD133 and EpCAM in SP cells
SP cells are considered as TIC in HCC [30]. SP and non-SP cells were enriched to investigate the expression of CD133 and EpCAM by flow cytometry analysis. SP cells were 1% in Huh7 cells, which were obviously diminished in the presence of verapamil, a calcium channel blocker. The number of cells co-expressed with CD133 and EpCAM was 13-flod in SP cells compared with non-SP cells (Fig. 2B). The results suggested that CD133+EpCAM+ cells might preferential display the SP characteristics.
High differentiation potential of CD133+EpCAM+ cells
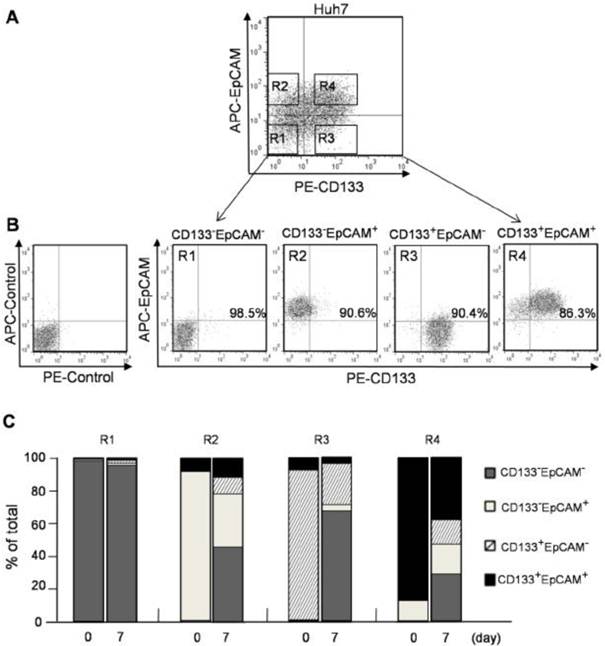
Four phenotypes of CD133-EpCAM- (R1), CD133-EpCAM+ (R2), CD133+EpCAM- (R3), CD133+EpCAM+ (R4) in Huh7 cells were sorted by flow cytometry (Fig. 2A). To determine the sorting efficiency, the purity of various phenotype cells was more than 85% verified immediately after sorting (Fig. 2B). After 7 days culture, 49% of CD133+EpCAM+ phenotype could differentiate into other three phenotypes, including 15.5% of CD133+EpCAM-, 5.6% of CD133-EpCAM+ and 28.0% of CD133-EpCAM-. However 37.3% of CD133+EpCAM+ phenotype was still reserved. 63.9% of CD133+EpCAM- and 59.6% of CD133-EpCAM+ phenotypes differentiated into CD133-EpCAM-, while 26.5% CD133+EpCAM- and 30.9% of CD133-EpCAM+ phenotypes remained in original status. Only a few of CD133+EpCAM- and CD133-EpCAM+ phenotypes differentiated into CD133+EpCAM+. In contrast, CD133-EpCAM- phenotype maintained their status (Fig. 2C). These results suggested that CD133+EpCAM+ phenotype could differentiate into other three phenotypes, while a few of other phenotypes could differentiate into CD133+EpCAM+. The most of CD133+EpCAM- and CD133-EpCAM+ phenotypes differentiated into CD133-EpCAM-. High differentiation potential was detected in CD133+ or EpCAM+ cells, especially in CD133+EpCAM+ cells.
Increase of colony formation ability in CD133+EpCAM+ cells
Plate primary colony formation assay showed that CD133+EpCAM+ cells markedly enhanced bigger and more tumor colonies by 1.8-fold, 1.9-fold and 7.9-fold than CD133+EpCAM-, CD133-EpCAM+ and CD133-EpCAM- cells respectively. Secondary colony formation assay also showed that CD133+EpCAM+ cells formed bigger and more tumor colonies than other three cells (Fig. 3A). In soft agar colony formation assays, CD133+EpCAM+ cells induced bigger and greater numbers of tumor colonies than CD133-EpCAM+, CD133+EpCAM-, CD133-EpCAM- cells. The reading of fluorescence of CD133+EpCAM+ cells was higher than that of other three cells (Fig. 3B). The data suggested that CD133+EpCAM+ cells possessed stronger clonogenic ability than other three cells.
CD133+ and EpCAM+ phenotypes enhanced the differentiation of Huh7 cells. A. CD133-EpCAM- (R1), CD133-EpCAM+ (R2), CD133+EpCAM- (R3) and CD133+EpCAM+ (R4) phenotypes of Huh7 cells were isolated by flow cytometry sorting. B. The sorting purity of R1, R2, R3 and R4 was detected respectively. C. R1, R2, R3 and R4 phenotypes were incubated for 7 days, and analyzed by flow cytometry. Data were from two independent experiments.
Augmentation of proliferation and drug-resistance in CD133+EpCAM+ cells
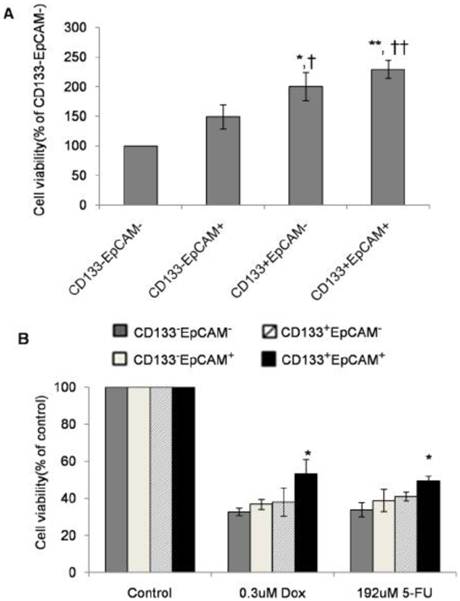
Drug-resistance as the characteristics of TICs has been reported in various cancers [31-36]. Unsorted Huh7 cells were treated by DOX and 5-FU for 48 h. Cell proliferation assay showed that IC50 concentration of DOX and 5-FU on unsorted Huh7 cells were respectively 0.3 μM and 192 μM (data not shown).
In non-treatment group, CD133+EpCAM+ cells proliferated significantly faster than CD133-EpCAM+ and CD133-EpCAM- cells. CD133+EpCAM- cells proliferated faster than CD133-EpCAM+ and CD133-EpCAM- cells (Fig. 4A). In DOX or 5-FU treated group, CD133+EpCAM+ cells showed increased resistance than CD133-EpCAM- cells (Fig. 4B). It suggested that increased proliferation and drug-resistance were displayed in CD133+EpCAM+ cells.
Colony formation ability was increased in CD133+EpCAM+ Huh7 cells. A. In plate colony formation assay, various phenotypes were cultured for 14-21 days, and then the primary colonies were replanted for another 14-21 days. Each experiment was performed three times. B. In soft agar colony formation assay, various phenotypes were planted on soft agar and cultured for 8-10 days. The stained colonies were photographed, and measured by the fluorescence reader. Data were from triple separate experiments. *P<0.05 to CD133-EpCAM-, †P<0.05 to CD133-EpCAM+, #P<0.05 to CD133+EpCAM-.

Upregulation of stem cell-related genes in CD133+EpCAM+ cells
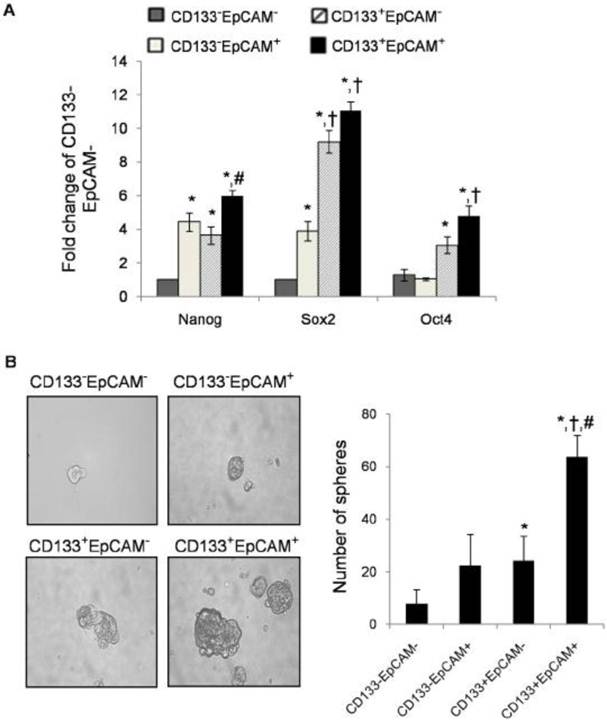
Many researchers found that TICs could express stem cell-related genes [37]. To determine stem cell-like properties, we detected three stem cell-related genes: Nanog, Sox2 and Oct4. CD133+EpCAM+ cells expressed higher mRNA level of Nanog than CD133+EpCAM- and CD133-EpCAM- cells. CD133+EpCAM+ cells expressed higher mRNA levels of Sox2 and Oct4 than CD133-EpCAM+ and CD133-EpCAM- cells (Fig. 5A). It was noteworthy that the expression of Sox2 and Oct4 in CD133+EpCAM- were more than that in CD133-EpCAM+ cells, while there were no significant differences of Nanog between these cells. The expression of Nanog, Sox2 and Oct4 genes were low in CD133-EpCAM- cells. The results suggested that CD133+EpCAM+ cells might preferential display the stem cell-like characteristics.
Enhanced proliferation and drug-resistance were observed in CD133+EpCAM+ cells. A and B. Various phenotypes were treated without (A) or with (B) doxorubicin (DOX) or 5-fluorouracil (5-Fu) for 48 h, and then cell proliferation was detected by SRB assay. Data were from triple independent experiments. *P<0.05 to CD133-EpCAM-, †P<0.05 to CD133-EpCAM+, **P<0.01 to CD133-EpCAM-, ††P<0.01 to CD133-EpCAM+.
Raised spheroid formation capacity of CD133+EpCAM+ cells
TICs have been enriched in nonadherent spherical clusters of cells in breast, liver and colon cancer cells [38-40]. Four sorted cells were cultured in serum-free medium for 7 days. The results showed that CD133+EpCAM+ cells formed larger, compacter and more spheroids than other three cells (Fig. 5B).
Enhanced tumorigenicity of CD133+EpCAM+ cells in NOD/SCID mice
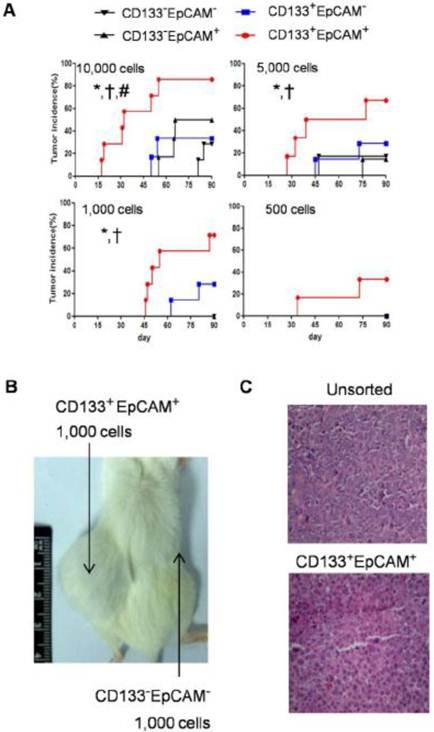
To analysis the tumor initiating capability, NOD/SCID mice were transplanted with various amounts of CD133-EpCAM-, CD133+EpCAM-, CD133-EpCAM+ and CD133+EpCAM+ cells. In 10,000 cells group, CD133+EpCAM+ cells possessed higher tumorigenicity and faster tumor growth than other three phenotypes. In 5,000 and 1,000 cells groups, CD133+EpCAM+ cells possessed higher tumorigenicity and faster tumor growth compared to CD133-EpCAM+ and CD133-EpCAM- cells. In 500 cells group, only CD133+EpCAM+ cells formed tumor mass (Table 1, Fig. 6A). For example, CD133+EpCAM+ cells, but not CD133-EpCAM- cells, could efficiently initiate tumors in NOD/SCID mice (Fig. 6B). Sorted CD133+EpCAM+ cells formed similar histological features of xenograft tumors as unsorted Huh7 cells (Fig. 6C). The results showed that CD133+EpCAM+ cells embodied the increased tumorigenicity in vivo.
Tumorigenicity of various Huh7 phenotypes in NOD/SCID mice.
| Phenotypes | Injecting numbers | Tumor incidencea |
|---|---|---|
| CD133+EpCAM+ | 10,000 | 6/7 |
| 5,000 | 4/6 | |
| 1,000 | 5/7 | |
| 500 | 2/6 | |
| CD133+EpCAM- | 10,000 | 2/6 |
| 5,000 | 2/7 | |
| 1,000 | 2/7 | |
| 500 | 0/7 | |
| CD133-EpCAM+ | 10,000 | 3/6 |
| 5,000 | 1/7 | |
| 1,000 | 0/7 | |
| 500 | 0/7 | |
| CD133-EpCAM- | 10,000 | 2/7 |
| 5,000 | 1/6 | |
| 1,000 | 0/7 | |
| 500 | 0/6 |
a The number of tumors detected/number of injections.
CD133+EpCAM+ cells possessed other characteristics of TICs. A. Various phenotypes were collected, and then the expression of Nanog, Sox2 and Oct4 were measured by real-time PCR. Data were from triple independent experiments. B. Cell spheres were imaged by microscope (x200 fields) after cultured in modified medium for 7 days. Data were shown as mean ± SD of three independent experiments. *P<0.05 to CD133-EpCAM-, †P<0.05 to CD133-EpCAM+, #P<0.05 to CD133+EpCAM-.
Raised tumorigenicity of CD133+EpCAM+ cells was detected in NOD/SCID mice. A. The indicated numbers of various phenotypes were injected subcutaneously in NOD/SCID mice for 90 days. The incidence of tumors was examined bi-weekly. B. 1,000 CD133+EpCAM+ or CD133-EpCAM- cells were injected in the indicated place for 90 days. C. The tumors were stained with hematoxylin-eosin. *P<0.05 to CD133-EpCAM-, †P<0.05 to CD133-EpCAM+, #P<0.05 to CD133+EpCAM-.
Discussion
Because of different experiment methods and cell types in every research group, the confusion results have been found in HCC. Recently, CD90 and CD13 have been used to identify HCC TICs, while CD44 and CD24 are mainly used as breast or pancreatic TICs markers [4, 10, 16, 20]. Using flow cytometry assay, we found the low expression of CD90, CD13 or CD44, and high expression of CD24 in HCC Bel7404, Bel7402, Huh7, SMMC7721 and HepG2 cells (data not shown). Otherwise, EpCAM or CD133 as an efficient marker of TICs has been proved by many researches in HCC, especially in Huh7 cells. Thus, we chose EpCAM and CD133 as the biomarkers of TICs.
In spite of single marker, two markers are combined to identify and isolate TICs precisely. CD133+CD44+ phenotype in SMMC7721, MHCC-LM3, and MHCC-97L cells [17], CD133+ALDH+ phenotype in PLC8024 cells [22], and CD45-CD90+ phenotype isolated from human tumor specimens and blood samples [16] are significantly more tumorigenic both in vitro and in vivo. Using other combination of surface markers, sorted Huh7 cells can not generate tumors in NOD/SCID mice [17]. However, we found that only 500 CD133+EpCAM+ cells formed tumors in NOD/SCID mice, rather than single marker positive cells. It was notable that CD133+EpCAM+ cells also possessed more characteristics of TICs rather than CD133+EpCAM-, CD133-EpCAM+ or CD133-EpCAM- cells in vitro. It suggests that CD133+EpCAM+ are the effective combination of TICs surface markers in Huh7 cells. Furthermore, recent clinic researches have shown that CD133 or EpCAM, associated with recurrence, alone may not be sufficient to serve as prognostic parameter of HCC [24, 41]. It is worthwhile for further investigation of CD133 and EpCAM in clinical significance.
CD133+EpCAM+ cells in SP cells were much more than in non-SP cells. Enriched SP cells were mainly composed of CD133+EpCAM+ cells. These data suggested that cells, co-expressing CD133 and EpCAM, possessed the characteristics of SP cells. Recently, SP cells are proved to be associated with drug-resistant [30]. Consistent with these results, our study showed that CD133+EpCAM+ cells possessed drug-resistant characteristic.
Stem cell-related genes Nanog, Sox2 and Oct4 are important for proliferation, self-renewal, and differentiation of stem cells [42-43]. Stem cell-related genes have been reported in TICs recently [13, 18]. In this study, stem cell-related genes were also up-regulated in CD133+EpCAM+ cells. These might be the causes for the enhancement of self-renewal and differentiation in CD133+EpCAM+ cells, but need for further investigation.
To observe the effects of CD133 or EpCAM, CD133+EpCAM- cells were compared with CD133-EpCAM+ cells in Huh7 cells. Exception of high expression of stem-related genes in CD133+EpCAM-, there was no significant difference between two markers in vitro. In vivo, CD133+EpCAM- cells had been found more tumorigenic potential than CD133-EpCAM+ cells. It suggested that CD133 had more relative characteristics of TICs than EpCAM. Moreover, EpCAM has been proved to be a direct transcriptional target in the Wnt/β-catenin signaling pathway [44]. CD133 has been decreased through the blockade of Notch pathway [45]. It is worthwhile for further study of these signaling pathways on CD133 and EpCAM in Huh7 cells.
Although the high expression of EpCAM in Bel7402 cells, there was no obvious difference between EpCAM+ and EpCAM- cells in vitro, including colony and sphere formation ability (data not shown). Meanwhile the expression of CD133 and EpCAM were low in HepG2 cells, which could not form subcutaneous tumor in ATCC. It was hypothesized that there might be another surface marker in Bel7402 or HepG2 cells with different cellular origin.
After flow cytometry sorting, CD133+EpCAM+ cells differentiated into the other phenotypes in medium with FBS, which was confirmed by other group [18]. Recently, it has been reported that spheroid cells expressed TICs characteristics [38]. Taken together, the combination of multi-marker sorting and the spheres formation might be the better strategy to maintain the TICs characteristics in a restricted period of time. It will be more suitable for studying basic biology of TICs and screening new drug targets.
In conclusion, our data suggest that CD133+EpCAM+ phenotype precisely represented the characteristics of TICs in Huh7 cells, including self-renewal, differentiation, resistance, tumorigenicity. It may promote the basic research on TICs and drug-screening.
Abbreviations
TICs: tumor initiating cells; HCC: hepatocellular carcinoma; NOD/SCID: nonobese diabetic /severe combined immunodeficient; EpCAM: epidermal cell adhesion molecule; EGF: epidermal growth factor; bFGF: basic fibroblast growth factor.
Acknowledgements
This research was supported by Grants from National Natural Science Foundation of China (No. 30900237 and No. 30772583); National Basic Research Program of China (No.2009CB521807); National S&T Major Special Project on Major New Drug Innovation (No. 2009ZX09301-003).
Competing Interests
The authors have declared that no competing interest exists.
References
1. Dudeck O, Ricke J. Advances in regional chemotherapy of the liver. Expert Opin Drug Deliv. 2011;8:1057-1069
2. Jemal A, Bray F, Center MM. et al. Global cancer statistics. CA Cancer J Clin. 2011;61:69-90
3. Zhou BB, Zhang H, Damelin M. et al. Tumour-initiating cells: challenges and opportunities for anticancer drug discovery. Nat Rev Drug Discov. 2009;8:806-823
4. Al-Hajj M, Wicha MS, Benito-Hernandez A. et al. Prospective identification of tumorigenic breast cancer cells. Proc Natl Acad Sci. 2003;100:3983-3988
5. Singh SK, Hawkins C, Clarke ID. et al. Identification of human brain tumour initiating cells. Nature. 2004;432:396-401
6. Collins AT, Berry PA, Hyde C. et al. Prospective identification of tumorigenic prostate cancer stem cells. Cancer Res. 2005;65:10946-10951
7. Kim CF, Jackson EL, Woolfenden AE. et al. Identification of bronchioalveolar stem cells in normal lung and lung cancer. Cell. 2005;121:823-835
8. Prince ME, Sivanandan R, Kaczorowski A. et al. Identification of a subpopulation of cells with cancer stem cell properties in head and neck squamous cell carcinoma. Proc Natl Acad Sci. 2007;104:973-978
9. Ricci-Vitiani L, Lombardi DG, Pilozzi E. et al. Identification and expansion of human colon-cancer-initiating cells. Nature. 2007;445:111-115
10. Li C, Heidt DG, Dalerba P. et al. Identification of pancreatic cancer stem cells. Cancer Res. 2007;67:1030-1037
11. Schatton T, Murphy GF, Frank NY. et al. Identification of cells initiating human melanomas. Nature. 2008;451:345-349
12. Suetsugu A, Nagaki M, Aoki H. et al. Characterization of CD133+ hepatocellular carcinoma cells as cancer stem/progenitor cells. Biochem Biophys Res Commun. 2006;351:820-824
13. Ma S, Chan KW, Hu L. et al. Identification and characterization of tumorigenic liver cancer stem/progenitor cells. Gastroenterology. 2007;132:2542-2556
14. Yin S, Li J, Hu C. et al. CD133 positive hepatocellular carcinoma cells possess high capacity for tumorigenicity. Int J Cancer. 2007;120:1444-1450
15. Yang ZF, Ho DW, Ng MN. et al. Significance of CD90+ cancer stem cells in human liver cancer. Cancer Cell. 2008;13:153-166
16. Yang ZF, Ngai P, Ho DW. et al. Identification of local and circulating cancer stem cells in human liver cancer. Hepatology. 2008;47:919-928
17. Zhu Z, Hao X, Yan M. et al. Cancer stem/progenitor cells are highly enriched in CD133+CD44+ population in hepatocellular carcinoma. Int J Cancer. 2010;126:2067-2078
18. Yamashita T, Ji J, Budhu A. et al. EpCAM-positive hepatocellular carcinoma cells are tumor-initiating cells with stem/progenitor cell features. Gastroenterology. 2009;136:1012-1024
19. Kimura O, Takahashi T, Ishii N. et al. Characterization of the epithelial cell adhesion molecule (EpCAM)+ cell population in hepatocellular carcinoma cell lines. Cancer Sci. 2010;101:2145-2155
20. Haraguchi N, Ishii H, Mimori K. et al. CD13 is a therapeutic target in human liver cancer stem cells. J Clin Invest. 2010;120:3326-3339
21. Yang W, Yan HX, Chen L. et al. Wnt/beta-catenin signaling contributes to activation of normal and tumorigenic liver progenitor cells. Cancer Res. 2008;68:4287-4295
22. Ma S, Chan KW, Lee TK. et al. Aldehyde dehydrogenase discriminates the CD133 liver cancer stem cell populations. Mol Cancer Res. 2008;6:1146-1153
23. Bauer N, Fonseca AV, Florek M. et al. New insights into the cell biology of hematopoietic progenitors by studying prominin-1 (CD133). Cells Tissues Organs. 2008;188:127-138
24. Salnikov AV, Kusumawidjaja G, Rausch V. et al. Cancer stem cell marker expression in hepatocellular carcinoma and liver metastases is not sufficient as single prognostic parameter. Cancer Lett. 2009;275:185-193
25. Ren K, Jin H, Bian C. et al. MR-1 modulates proliferation and migration of human hepatoma HepG2 cells through myosin light chains-2 (MLC2)/focal adhesion kinase (FAK)/Akt signaling pathway. J Biol Chem. 2008;283:35598-35605
26. Zhang H, Zhang S, He H. et al. RasGAP-derived peptide 38GAP potentiates the cytotoxicity of cisplatin through inhibitions of Akt, ERK and NF-kappaB in colon carcinoma HCT116 cells. Cancer Lett. 2011;308:62-70
27. Shen L, Zeng S, Chen J. et al. E1A inhibits the proliferation of human cervical cancer cells (HeLa cells) by apoptosis induction through activation of HER-2/Neu/Caspase-3 pathway. Med Oncol. 2008;25:222-228
28. Sun HX, He HW, Zhang SH. et al. Suppression of N-Ras by shRNA-expressing plasmid increases sensitivity of HepG2 cells to vincristine-induced growth inhibition. Cancer Gene Ther. 2009;16:693-702
29. Ghods AJ, Irvin D, Liu G. et al. Spheres isolated from 9L gliosarcoma rat cell line possess chemoresistant and aggressive cancer stem-like cells. Stem Cells. 2007;25:1645-1653
30. Chiba T, Kita K, Zheng YW. et al. Side population purified from hepatocellular carcinoma cells harbors cancer stem cell-like properties. Hepatology. 2006;44:240-251
31. Fischer M, Yen WC, Kapoun AM. et al. Anti-DLL4 inhibits growth and reduces tumor-initiating cell frequency in colorectal tumors with oncogenic KRAS mutations. Cancer Res. 2011;71:1520-1525
32. Enguita-German M, Schiapparelli P, Rey JA. et al. CD133+ cells from medulloblastoma and PNET cell lines are more resistant to cyclopamine inhibition of the sonic hedgehog signaling pathway than CD133- cells. Tumour Biol. 2010;31:381-390
33. Janikova M, Skarda J, Dziechciarkova M. et al. Identification of CD133+/nestin+ putative cancer stem cells in non-small cell lung cancer. Biomed Pap Med Fac Univ Palacky Olomouc Czech Repub. 2010;154:321-326
34. Zhang K, Waxman DJ. PC3 prostate tumor-initiating cells with molecular profile FAM65Bhigh/MFI2low/LEF1low increase tumor angiogenesis. Mol Cancer. 2010;9:319-331
35. Marchini C, Montani M, Konstantinidou G. et al. Mesenchymal/stromal gene expression signature relates to basal-like breast cancers, identifies bone metastasis and predicts resistance to therapies. PLoS One. 2010;5:e14131
36. Ma S, Tang KH, Chan YP. et al. miR-130b Promotes CD133(+) liver tumor-initiating cell growth and self-renewal via tumor protein 53-induced nuclear protein 1. Cell Stem Cell. 2010;7:694-707
37. Wang XQ, Ongkeko WM, Chen L. et al. Octamer 4 (Oct4) mediates chemotherapeutic drug resistance in liver cancer cells through a potential Oct4-AKT-ATP-binding cassette G2 pathway. Hepatology. 2010;52:528-539
38. Cao L, Zhou Y, Zhai B. et al. Sphere-forming cell subpopulations with cancer stem cell properties in human hepatoma cell lines. BMC Gastroenterol. 2011;11:71-81
39. Xie G, Zhan J, Tian Y. et al. Mammosphere cells from high-passage MCF7 cell line show variable loss of tumorigenicity and radioresistance. Cancer Lett. 2011;316:53-61
40. Tsai KS, Yang SH, Lei YP. et al. Mesenchymal stem cells promote formation of colorectal tumors in mice. Gastroenterology. 2011;141:1046-1056
41. Izumi N. Prediction and prevention of intrahepatic recurrence of hepatocellular carcinoma. Hepatology Research. 2012;42:226-232
42. Kashyap V, Rezende NC, Scotland KB. et al. Regulation of stem cell pluripotency and differentiation involves a mutual regulatory circuit of the NANOG, OCT4, and SOX2 pluripotency transcription factors with polycomb repressive complexes and stem cell microRNAs. Stem Cells Dev. 2009;18:1093-1108
43. Kim D, Kim CH, Moon JI. et al. Generation of human induced pluripotent stem cells by direct delivery of reprogramming proteins. Cell Stem Cell. 2009;4:472-476
44. Yamashita T, Budhu A, Forgues M. et al. Activation of hepatic stem cell marker EpCAM by Wnt-beta-catenin signaling in hepatocellular carcinoma. Cancer Res. 2007;67:10831-10839
45. Fan X, Khaki L, Zhu TS. et al. NOTCH pathway blockade depletes CD133-positive glioblastoma cells and inhibits growth of tumor neurospheres and xenografts. Stem Cells. 2010;28:5-16
Author Biography
Dr. Rong-guang Shao is a professor of molecular pharmacology at Institute of Medicinal Biotechnology, Peking Union Medical College & Chinese Academy of Medical Sciences. The current research fields of Professor Shao's group include: (1) Cell cycle checkpoint regulation in enhancing sensitivity of chemotherapy; (2) Antibody-drug conjugate for cancer treatment; (3) Cancer gene therapy targeting cell cycle and apoptosis; (4) Tumor initiating cells in liver cancer.
Dr. Yi Chen obtained doctor's degree from Peking Union Medical College & Chinese Academy of Medical Sciences in 2012. She was a Ph.D. student under the supervision of Prof. Rong-guang Shao. Her research mainly engages with the identification of TICs in liver cancer and screening of the targeting drugs.
![]() Corresponding author: Tel: +86 10 63026956; fax: +86 10 63026956. E-mail: shaorcn (R.-g. Shao).
Corresponding author: Tel: +86 10 63026956; fax: +86 10 63026956. E-mail: shaorcn (R.-g. Shao).