Impact Factor ISSN: 1449-2288
- Issue 12; 2026
- Issue 11; 2026
- Issue 10; 2026
- Issue 9; 2026
- Issue 8; 2026
- Volume 22; 2026
- Past Issues
- Advance Articles
- Editorial Board
- Cover Images
- Index & Coverage
- Cover Suggestion
- Special Issues
Introduction
2. Materials and Methods
3. Results and Discussion
4. Conclusion
Supplementary Material
Acknowledgements
References

 Global reach, higher impact
Int J Biol Sci 2012; 8(8):1188-1196. doi:10.7150/ijbs.5059 This issue Cite
Research Paper
Hydrophobic Properties of tRNA with Varied Conformations Evaluated by an Aqueous Two-Phase System
Keishi Suga, Hibiki Tomita, Seishiro Tanaka, Hiroshi Umakoshi ![]()
Division of Chemical Engineering, Graduate School of Engineering Science, Osaka University, Osaka, Japan
Received 2012-8-15; Accepted 2012-9-25; Published 2012-10-15
Abstract
The surface properties of transfer RNA (tRNA) were analyzed using a poly(ethylene glycol)/dextran aqueous two-phase system (ATPS), where the surface net hydrophobicity (HFS) and the local hydrophobicity (LH) were evaluated based on the partition coefficient of tRNA in the ATPS. According to the evaluated HFS values, the surface of the tRNA molecule was hydrophilic at 20° -40 °C, and it became hydrophobic at 50° -80 °C because of the exposure of the intrinsic nucleobases of tRNA. In contrast, the LH values were found to be maximal at 20° -40 °C. The conformation of tRNA was investigated by Raman and circular dichroism (CD) spectroscopies, corroborating the results with the calculated prediction of its secondary structure (Mfold). It was shown that 66% of A-form structure existed at room temperature; the base stacking (θ265) was gradually decreased, and the A-form structure (θ208) was denatured along with a sigmoid curve against the temperature increase; the denatured secondary structures were observed above 50° C by Mfold prediction. The HFS value of the DNA duplex was found to be hydrophilic, compared to that of the single-stranded DNA, indicating that the exposure of nucleobases is a key factor of the hydrophobic properties of nucleotides. We conclude that the hydrophobic property of the tRNA surface was directly affected by its conformational transition.
Keywords: transfer RNA, hydrophobicity
Introduction
The various types of functional nucleic acids play important roles in biological events. RNA is a polynucleotide which carries genetic information such as DNA, and it also possesses a catalyst function, which is known as the "ribozyme." The conformation of RNA is a key to the regulation of its functions: the recognition of amino acids or aminoacyl tRNA synthetase, the reading of genetic information on mRNA, the peptidyl transfer of ribosomal RNA, etc. [1, 2]. Transfer RNA (tRNA) is one of the well-studied ribonucleotides (ribozymes) that transfers amino acids to the ribosome. Such molecular recognition requires several possible driving forces: (i) electrostatic and (ii) hydrophobic interaction, or (iii) hydrogen bond. These attracting forces may depend on the surface properties of the biomacromolecule, which are likely related to its conformation. The physiochemical properties of the surface of the biomacromolecule are likely to have an important role in the molecular recognition, however, the relationship between the surface properties and the conformation in the nucleic acids has not yet been fully determined.
The interaction of supermolecular assemblies (i.e., the liposome) with various types of nucleic acids has been reported [3-5]. In order to understand the interaction mechanism between the assemblies and the nucleic acids, analyses of the surface properties of nucleic acids are necessary. However, there are few reports on the methodology for evaluating the surface properties of nucleic acids [6]. Some chromatographic techniques — such as ion exchange chromatography (IEX), high-performance liquid chromatography (HIG-HPLC), and reverse-phase chromatography (RV-HPLC) — could be useful for the evaluation of biomolecules. However, there are some limitations in analyzing the biomacromolecules that could induce their conformational change, due mainly to the solid-based stationary phase in a column. In contrast, an aqueous two-phase system (ATPS) is a biocompatible system that can be applied to the partitioning of various biomacromolecules and biomaterials, such as amino acids, (poly)peptides, proteins (enzymes), and cells. The ATPS has been used in a systematic approach to evaluating the surface properties of biomacromolecules [7-10]. The system's biocompatibility, ease of operation, and designability allow the above-mentioned characteristics to be evaluated in the designed ATPS simply by measuring the partition coefficient of standard biomolecules, of which the characteristics are well known. Among the various types of ATPS available, the poly(ethylene glycol) (PEG)/dextran (Dex) ATPS has been used to analyze the surface hydrophobicity of biomolecules, because the partition of biomolecules in the PEG/Dex ATPS depends on their hydrophobicities in the pI and low ionic strength condition [11]. In addition, the PEG/Dex ATPS has a "mild" interface and can be used under metal ion-free conditions, and thus the PEG/Dex ATPS provides a desirable partition method for evaluations of the surface properties of nucleic acids.
In the present study, the surface properties of various nucleic acids including DNA or RNA were successfully evaluated by using the PEG/Dex ATPS, focusing on the surface "hydrophobicity." The surface net hydrophobicity (HFS) and the local hydrophobicity (LH) were quantitatively characterized using the designed PEG/Dex ATPS. The dynamics of the transfer RNA (tRNA) conformation were analyzed under heat stress conditions, by using Raman and circular dichroism (CD) spectroscopy together with Mfold prediction. The relationship between the hydrophobic properties and the tRNA conformation was discussed by comparing its conformation with the hydrophobic properties of nucleotide monophosphate (NMP), single-stranded DNA (ssDNA), and double-stranded DNA (duplex).
2. Materials and Methods
2.1. Materials
Transfer RNA (tRNA) originating from E. coli tRNA and nucleotide monophosphate (NMP; AMP, UMP, CMP, and GMP) were purchased from Sigma-Aldrich (St. Louis, MO, USA). Custom-synthesized poly-(dA) and poly-(dT) were purchased from Life Technologies Japan Ltd. (Tokyo, Japan). Poly(ethylene glycol) (PEG 1540, 4000, and 6000; Mw 1.5 kDa, 3 kDa and 7 kDa, respectively), dextran (Dex 90-210k; Mw 90-210 kDa), and other chemicals were purchased from Wako Pure Chemical Industries, Ltd. (Osaka, Japan) and were used without further purification. Chemical structure of materials is shown in the supplementary information (Supplementary Material: Fig. S1).
2.2. Preparation of aqueous two-phase system
ATPS with a variety of hydrophobicities was prepared according to previous reports [8, 9]. The basic composition of the systems (the total weight is 1.4 g) for the partitioning of biomolecules was 9-13 wt% PEG 1540, 4000, 6000 and 7-9 wt% Dex 90-210k. The ATPSs were prepared by mixing the stock solutions of 30 wt% PEG and 30 wt% Dex with the tRNA solution. After overnight-incubation of the tRNA solution at 30-80 oC, the upper PEG-rich phase and the bottom Dex-rich phase of the ATPS were carefully separated at room temperature. The concentration of tRNA was quantitatively analyzed by the fluorescence intensity of a RNA-specific probe SYBR Green II [12].The amount of NMPs or DNAs was analyzed by UV absorbance at 258 nm. The partition coefficient, K, was defined as follows:
K = CPEG/CDex
where CPEG and CDex are the concentration of nucleic acids in PEG phase and Dex phase, respectively.
2.3. Definition of the hydrophobicity of ATPS
The surface properties of various kinds of biomolecules have previously been evaluated in our previous works [8-10]. The partition coefficient of molecules in ATPS is defined as follows:
ln K = Kelctrostatic + Khydrophobic + Ksalt + Kligand + …
where Kelctrostatic, Khydrophobic, Ksalt, Kligand represent the contribution by electrostatic, hydrophobic, salt, and ligand effect, respectively. Under the pI and low ionic strength condition, the values of Khydrophobic and Ksalt can be ignored [11], thus the partition of biomolecules is simply dependent on the hydrophobicity:
ln K = Khydrophobic
The hydrophobicity of ATPS was determined based on the partitioning behaviors of amino acids. The relationship of the partition coefficient of amino acids and their hydrophobicity has already been analyzed in the previous reports [7, 8, 13]. The hydrophobicity differences between two phases in ATPS can herewith be defined as hydrophobicity factor, HF:
ln K = HF x (RH + B)
where RH is the relative hydrophobicity determined based on the Nozaki-Tanford value [13] and B is the normalization constant defined as the ratio of the partition coefficient and the hydrophobicity of glycine, ln KGly/ΔGGly (Supplementary Material: Fig. S2(A)). The HF values of various kinds of ATPS, determined based on partitioning behaviors of amino acids, are shown in Supplementary Material: Figure S2(B) and Table 1.
Composition of ATPS and the hydrophobicity factor (HF)
| PEG (w/w %) | Dex (w/w %) | HF [mol/kJ]* |
|---|---|---|
| PEG1540 (10.8) | Dex90-210k (7) | 0.0032 |
| PEG4000 (10.8) | Dex90-210k (9) | 0.0070 |
| PEG1540 (13) | Dex90-210k (9) | 0.0093 |
| PEG4000 (9) | Dex60-90k (9) | 0.0098 |
| PEG4000 (9) | Dex90-210k (9) | 0.0126 |
| PEG6000 (9) | Dex60-90k (9) | 0.0195 |
| PEG6000 (9) | Dex90-210k (9) | 0.0201 |
2.4. Evaluation of the surface net hydrophobicity (HFS) and the local hydrophobicity (LH)
The hydrophobicity of nucleic acids was determined by studying the partition behaviors in ATPS. It has been previously reported that a liner relationship can be obtained between HF and ln K, where the surface net hydrophobicity (HFS) of biomolecules can be defined as follows [7, 8]:
ln K = HFS x HF
The local hydrophobicity (LH) was further determined by investigating the partitioning behaviors in ATPSs with and without a hydrophobic ligand-modified PEG, Triton X-405, and can be defined as follows:
LH = Δln K = ln K(+)Triton - ln K(-)Triton
where ln K(+)Triton and ln K(-)Triton are the partition coefficients in the presence and absence of 1 mM Triton X-405 in PEG6000/Dex ATPS, respectively. The total concentration of tRNA in ATPS was 1.4 μM. All measurements were performed at least 3 times and the data was integrated. No aggregates or precipitation were observed in ATPS, in the presence of tRNA or DNA (data not shown).
2.5. CD spectroscopy analysis
The conformation of RNA was analyzed by using a JASCO J-820 SFU spectropolarimeter (JASCO, Tokyo) [3]. The CD spectrum from 300 to 200nm was measured with a quartz cell (0.1 cm path length) at a scan speed of 50 nm min-1 and a width of 2 nm. Five scans excluding buffer background signals were accumulated, and the obtained data was calculated as molar ellipticity. The sample was prepared with 2.2 mM of tRNA with 10mM Tris-HCl at pH7.8.
2.6. Raman spectroscopy analysis
The Raman spectra of tRNA were measured by using confocal Raman microscopy LabRAM HR-800 (HORIBA, Ltd., Kyoto, Japan), at a wavelength of 533 nm, laser power at the sample of 100 mW and total data accumulation time of 90 sec. For each sample, the background signal of the solution was removed, and then the baseline was corrected. The corrected Raman spectra were normalized according to the previous report [14], whereas the peak at 1098 cm-1 is invariant of the base composition. The final concentration of tRNA was 1 mM.
2.7. Prediction of secondary structure of nucleic acids
The prediction of the secondary structure of the nucleic acid was attempted based on the thermodynamic algorithm to minimize the free energy of the nucleotide sequences algorithm (Mfold web server) [15]. The nucleotide sequences used in this study are shown in Table 2: tRNAPhe , tRNAGly [16], tRNALeu [17], poly-(dA), and poly-(dT).
Library of nucleic acids and their HFS values
| Nucleic acids | HFS [kJ/mol]** | Sequence |
|---|---|---|
| AMP CMA GMP UMP | -23.4 -20.3 -34.2 -20.5 | Adenosine monophosphate Cytidine monophosphate Guanosine monophosphate Uridine monophosphate |
| poly-(dA) | -140.7 | 5'-GAAATAATACGACTCACTATAGGGAAAAAAAAAAAAAAAAAAAAAAAAAAAAAAAAAAAAAAAAAAAAAAAAAA-3' |
| poly-(dT) | -131.2 | 5'-TTTTTTTTTTTTTTTTTTTTTTTTTTTTTTTTTTTTTTTTTTTTTTTTTTCCCTATAGTGAGTCGTATTATTTC-3' |
| duplex* (poly-(dA) and poly-(dT)) | -168.8 | 5'-GAAATAATACGACTCACTATAGGGAAAAAAAAAAAAAAAAAAAAAAAAAAAAAAAAAAAAAAAAAAAAAAAAAA-3'and 5'-TTTTTTTTTTTTTTTTTTTTTTTTTTTTTTTTTTTTTTTTTTTTTTTTTTCCCTATAGTGAGTCGTATTATTTC-3' |
| tRNA Phe 14 | -191.7*** (at 30 oC) | 5'-GCGGAUUUAGCUCAGUUGGGAGAGCGCCAGACUGAAGAUCUGGAGGUCCUGUGUUCGAUCCACAGAAUUCGCACCA-3' |
| tRNA Leu 15 | -100.5*** (at 50 oC) | 5'-GCGAAGGUGGCGGAADDGGDAGACGCGCUAGCUUCAGGΨGΨUAGUGUCCUUACGGACGUGGGGGTΨCAAGUCCCCCCCCUCGCACCA-3' |
| tRNA Gly 14 | -66.6*** (at 70 oC) | 5'-GCGGGAGUAGCUCAGUCGGUAGAGCACGACCUUGCCAAGGUCGGGGUCGCGGGGUUCAAGUCCCGUCUCCCGCUCCA-3' |
* duplex: poly-(dA) and poly-(dT) were annealed in 70 oC for 5 min, then theduplex was cooled gradiently.
** The HFS values were measured at 30 oC.
*** tRNA used in this study was a mixture of 15 kinds of tRNA including tRNAPhe , tRNALeu, and tRNAGly.
2.8. Statistical analysis
The results are expressed as mean ± standard derivation (SD). All experiments were performed at least in triplicate. The data distribution was analyzed, and statistical differences were evaluated using the Student's t-test. A P-value of <0.05%was considered significant.
3. Results and Discussion
Single-stranded RNA is known to possess a flexible structure [4] that can form various intramolecular base pairs such as the Watson-Crick type, etc. The secondary structure of tRNA (known as a "cloverleaf") is common to almost all tRNAs, independent of type, sequences, or host cells. In the present study, the surface properties of tRNA from E. coli were investigated by using the PEG/Dex ATPS method under metal ion-free conditions, and the conformational changes of tRNA were also investigated.
3.1. Analysis of the surface net hydrophobicity (HFS) of the tRNA
The values of both HFS and LH have been defined as indicators of the surface hydrophobicity of biomolecules with the use of the PEG/Dex ATPS method [7]. Figure 1 shows a typical example of the dependence of the tRNA partition coefficient, K, on the hydrophobicity (HF) of the ATPS. Herein, the HF value can be defined based on the Nozaki-Tanford value of amino acid hydrophobicity and can be regarded as the difference in 'hydrophobicity' between the PEG and Dex phases. As shown in Figure 1, a linear relationship can be obtained between HF and ln K, clearly showing that the surface hydrophobicity of tRNA can be evaluated by using an ATPS, in the same way as the hydrophobicity of proteins or enzymes [8, 9, 18, 19]. The slope of the lines in Figure 1 can herewith be defined as the surface net hydrophobicity (HFS), where the HFS values vary with the temperature.
Partition behaviors of tRNA in PEG/Dex ATPS. The HF values of ATPSs are summarized in Table 1. Temperature: 20 oC (closed circle: black line), 30 oC (open diamond: 2-dot-dash line), and 60 oC [open triangle: dot line]. The total concentration of tRNA in ATPS was 1.4 μM. ATPS: (i) PEG1540(10.8 w/w%)/Dex90-210k(7 w/w%), (ii) PEG1540(10.8 w/w%)/Dex90-210k(9 w/w%), (iii) PEG1540 (9 w/w%)/Dex90-210k( 9 w/w%), (iv) PEG4000(9 w/w%)/Dex90-210k(9 w/w%), (v) PEG6000(9 w/w%)/Dex90-210k(9 w/w%).
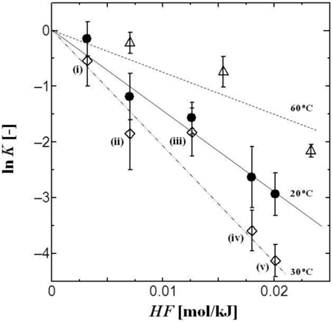
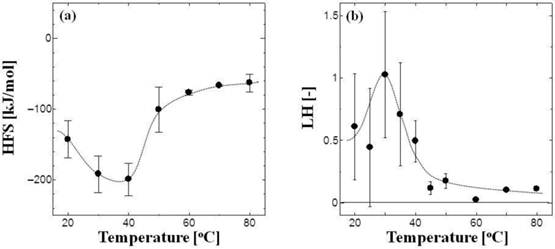
Figure 2a shows the dependence on temperature of the HFS values of the tRNA. The surface of the tRNA molecule was hydrophilic at physiological temperatures (20°-40°C), whereas at 60°-80°C it became hydrophobic. The melting temperature (Tm) was reported as 52°C in metal ion-free conditions [4]. tRNA is denatured at higher temperatures [3, 4], suggesting that its surface hydrophobicity can be affected by its conformation. One possible mechanism of the increase in surface hydrophobicity is exposure of hydrophobic nucleobases: the phosphate backbone structure of nucleic acid is known to be hydrophilic, whereas the moiety of nucleobase is rather hydrophobic [20]. It has been reported that tRNA and DNA interact with PEG and PAMAM-G4 dendrimers, resulting in the conformational change of nucleic acids [21-25]. Although no aggregates were observed in the present study, the surface hydrophobicities (HFS and LH) of tRNA and DNA play an important role in the interaction between PEG, dendrimers, and liposomes [3, 4].
Temperature dependence of the HFS values (a) and the LH values (b) of tRNA. The total concentration of tRNA in ATPS was 1.4 μM.
In general, the surface of DNA is shielded by phosphate backbones, where hydrophobic nucleobases form complementary base pairs and are then packed inside the DNA molecule in order to exclude the intrinsic water molecules [6]. The HFS values of NMPs (AMP, GMP, CMP, and UMP) that were determined by the ATPS method are also shown in Table 2. The values of the NMPs were approx. −20 kJ/mol, which is much more hydrophobic than in the case of tRNA (−192 kJ/mol). The difference in the free energies (ΔG) of nucleic acid bases of guanine and adenine has been reported as −16.2 kJ/mol in the transfer from water to cyclohexane [20]. Our use of the PEG/Dex ATPS revealed that the difference in the HFS values of AMP and GMP was −10.6 kJ/mol. This result implies that there is a correlation between the surface free energy and the surface net hydrophobicity. The HFS value should be discussed in future studies as an indicator of the surface hydrophobicity.
3.2. Analysis of the local hydrophobicity (LH) of the tRNA
The local hydrophobicity (LH) of the tRNA was also analyzed at various temperatures (Fig. 2b). Triton X-405 is known to be partitioned in the PEG-rich phase of ATPSs, due to the poly(ethylene glycol) moiety in its structure. Since hydrophobic pockets exposed on the tRNA surface can be bound with the t-octylphenyl group of Triton X-405 through hydrophobic interaction, the partition coefficient of tRNA is thus increased in the PEG/Dex ATPS by adding Triton-X 405 to the system. The LH value indicates the intensity of the hydrophobicity of the pockets on the local domain of the molecule surface, and their number [9, 18, 19]. The LH value of tRNA was maximal within the temperature range of 20°-40°C, indicating that the tRNA has a larger number of clustered hydrophobicity pockets than at 50°-80°C. According to previous reports [9, 18, 19], a protein (or enzyme) in a partly denatured state known as the "molten-globule" state shows a higher LH value, and it has high affinity with molecular assemblies such as the molecular chaperone (e.g., GroES) or liposome; both types of assemblies have the ability to assist the conformational change of the protein [25, 26]. It is possible that tRNA with a higher LH value can easily interact with other biomolecules or liposomes [3].
3.3. Structural analysis of tRNA by using Raman spectroscopy
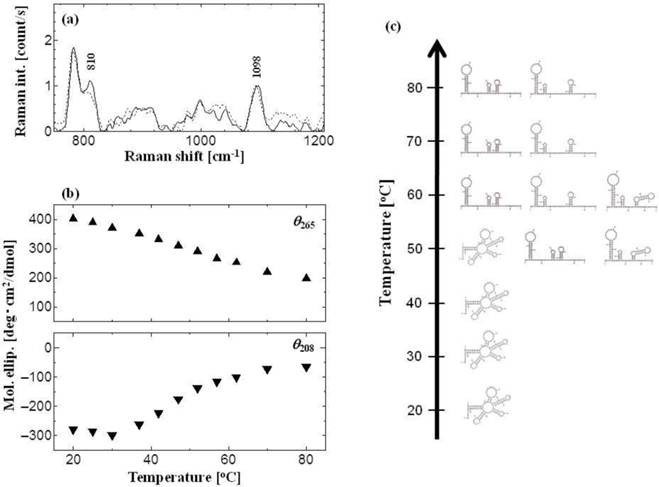
tRNA shows a stereotypic A-form conformation [27, 28]. The above results regarding the surface hydrophobicities indicate that the tRNA has a stable structure in water solution in the temperature range of 20°-40°C, but it becomes unstable at 50°-80°C. The conformation of tRNA was investigated at various temperatures (Fig. 3). The Raman spectra of tRNA at 30°C and 60°C are shown in Figure 3a, where the peak at 810 cm−1 was assigned as the diester OPO stretching vibration (A-form marker), and the peak at 1098 cm−1 was assigned as the PO2− symmetric stretching vibration (inner reference, invariant to the base composition) [29, 30]. In the aqueous solution of RNA polynucleotides, the peak value of the intensity ratio (R: R = I810/I1098) has been reported to vary from 0 to 1.64, depending on the percentage of nucleotide residue existing inside the segments of ordered structure of the A-form [31-33]. The R values obtained in the present study were 1.08 for 30°C and 0.87 for 60°C, showing that 66 % and 53 % of the A-form structure of the tRNA were maintained in these conditions. In addition, neither the B-form marker (peak at 835 cm−1) nor the Z-form marker (peak at 745 cm−1) were observed at 60°C, indicating that the tRNA was denatured without any conformational transition to B- or Z-form. It was therefore demonstrated that the structure of tRNA can be denatured depending on the surrounding temperature.
Conformational analysis of tRNA. (a) Raman spectrum of tRNA with different temperatures: black line for 30 oC, and dot line for 60 oC. Peaks at 810 cm-1 and 1098 cm-1 show diester OPO stretching vib. (A-form marker) and PO2- symmetric stretching vib. (inner reference), respectively. The concentration of tRNA was 1 mM. (b) Peak intensities of CD spectra at θ265 (closed up-triangle) and θ208 (closed down-triangle). The concentration of tRNA was 2.2 μM. (c) Predicted secondary structure of tRNAPhe using Mfold web server [15].
3.4. Evaluation of the conformational change of tRNA by CD spectroscopy and Mfold prediction
Circular dichroism (CD) spectroscopy is also a powerful method for analyzing the conformation of biomolecules [34]. Some specific peaks were observed in the CD spectrum of tRNA, showing a positive peak at 265 nm (θ265: base stacking) and a negative peak at 208 nm (θ208: A-form double helix) [4]. The denaturation of tRNA was monitored by CD spectra as shown in Figure 3b. The degree of the base stacking (θ265) gradually decreased, whereas that of the A-form helix structure (θ208) decreased in a sigmoidal manner. Since no peak shifts were observed at 208 nm, the denatured conformation of tRNA is considered a "single strand-rich" structure.
We herein assumed a two-state transition between the intact state (under 40°C) and the denatured state (over 50°C). The secondary structure of tRNAPhe was calculated by using a thermodynamic simulation approach, Mfold [15] (Fig. 3c). A stereotypic cloverleaf was observed at 20°-50°C, and the 'denatured' structure was observed at 50°-80°C. With the temperature increase, the amount of tRNA moieties that did not form base pairs also increased. The same results were obtained in the cases of tRNALeu and tRNAGly (data not shown). It is therefore suggested that the increase of HFS values can be caused by the denaturation of the A-form structure with an increase of exposed nucleobases, since the nucleobase part is more hydrophobic.
In fact, a similar process can be observed in the temperature dependence of the surface hydrophobicities (Fig. 2a) and conformational changes (Fig. 3a). It is considered that the surface properties of tRNA are able to reflect the tertial information of the tRNA conformation. Therefore, the HFS values are not only a parameter of the surface hydrophobicity but also an indicator of the tRNA conformation.
3.5. Relationship between DNA morphology and the surface net hydrophobicity (HFS)
A possible reason for the increase in the HFS value under heating conditions is that the nucleobases are exposed. The HFS values of nucleic acids are summarized in Figure 4, where the HFS values of protein and enzyme [8, 9] are shown together. The nucleic acids were found to be hydrophilic, and the nucleobases were more hydrophobic.
Ladder of the surface net hydrophobicity (HFS) obtained in this study. The HFS values of protein or enzyme (shown with asterisk) have been previously reported [8, 9].
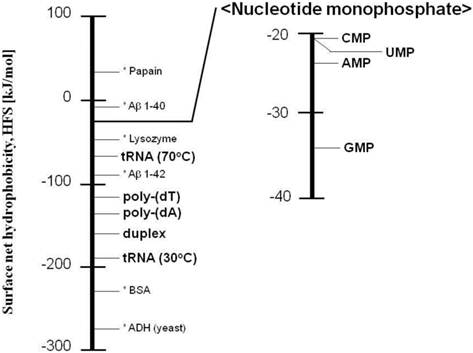
To estimate the relationship between the hydrophobicity and the nucleic acid conformation, the HFS values of ssDNA [poly-(dA), poly-(dT)] and double-stranded DNA [duplex of poly-(dA) and poly-(dT)] were also determined: the HFS values of poly-(dA), poly-(dT), and duplex were −141 kJ/mol, −131 kJ/mol, and −168.8 kJ/mol, respectively (Table 2). The duplex of poly-(dA) and poly-(dT) was found to be more hydrophilic than the ssDNA because the hydrophobic nucleobases wrapped by phosphate backbones were isolated from the surrounding water molecules [6]. It was thus demonstrated that the morphology of DNA also affected the surface hydrophobic properties.
The difference in HFS values between the duplex and ssDNA was approx. −30 kJ/mol, and was the same as the HFS values of the NMPs (i.e., HFSduplex ≈ HFSssDNA + HFSNMP). Therefore, we conclude that the exposed nucleobases in the nucleic acids resulted in an increase in the HFS value. The function of nucleic acids is regulated by their conformation [1-3, 5, 35]. The possible driving forces that achieve molecular recognition or interaction with biomolecules are hydrophobic interaction, electrostatic interaction, and hydrogen bond interaction. The present results indicate that the hydrophobic properties of nucleic acids were markedly affected by their conformational transition. The conformational transition of biomolecules is expected to play an important role in molecular recognition.
4. Conclusion
We successfully characterized the surface net hydrophobicity (HFS) and the local hydrophobicity (LH) of tRNA by using the PEG/Dex ATPS method. The HFS value and the LH value were found to vary depending on the conformational change of tRNA in high-temperature conditions, clearly demonstrating that the hydrophobic properties of polynucleotides are deeply related to their conformation (i.e., HFS and the exposure of nucleobases, LH and A-form structure). HFS and LH are the possible driving forces in molecular recognition or interaction with biomolecules and lipid membranes [3, 4]. Since the morphological changes of polynucleotides in biological systems play an important role [5, 35], the evaluation of hydrophobicity by using the ATPS method can offer a better understanding of the nature of nucleic acids.
Although nucleic acids are sensitive to the surrounding solution (pH, ionic strength, temperature, the presence of metal cations), the PEG/Dex ATPS, which has a "mild" hydrophobic interface, can be used to analyze their surface hydrophobicity in the "intact" condition. The obtained information (HFS and LH) can be used to investigate the conformation and interaction mechanism of nucleic acids with protein, enzyme, cell membrane and other supermacromolecules.
Supplementary Material
Fig.S1 - Chemical structure of materials. Fig.S2 - (a) Relationship between the partition coefficients of amino acids and their hydrophobicity; (b) Hydrophobicity factor of ATPS.
Acknowledgements
The fundamental concept of this study was supported by the Research Group of “Membrane Stress Biotechnology” and the Sigma Multidisciplinary Research Laboratory Group (Graduate School of Engineering Science, Osaka University) “Membranomics”. We thank Ms. Tomoko Numata (HORIBA, Ltd.) for her technical support as far as the Raman spectroscopy measurement is concerned. This work was supported by the Funding Program for Next Generation World-Leading Researchers of the Council for Science and Technology Policy (CSTP) (GR066), and a grant from the Global COE program “Bio-Environmental Chemistry” of the Japan Society for the Promotion of Science (JSPS). One of the authors (K.S.) also expresses his gratitude for the JSPS and GCOE scholarships.
Competing Interests
The authors have declared that no competing interest exists.
References
1. Marsden S, Nardelli M, Linder P, McCarthy JEG. Unwinding Single RNA Molecules Using Helicases Involved in Eukaryotic Translation Initiation. J. Mol. Biol. 2006;361:327-335
2. Korostelev A, Trakhanov S, Laurberg M, Noller HF. Crystal Structure of a 70S Ribosome-tRNA Complex Reveals Functional Interactions and Rearrangements. Cell. 2006;126:1065-1077
3. Suga K, Tanabe T, Tomita H, Shimanouchi T, Umakoshi H. Conformational change of single-stranded RNAs induced by liposome binding. Nucl. Acids Res. 2011;39:8891-8900
4. Suga K, Umakoshi H, Tomita H, Tanabe T, Shimanouchi T, Kuboi R. Liposomes destabilize tRNA during heat stress. Biotechnol. J. 2010;5:526-529
5. Tsuji A, Yoshikawa K. ON-OFF switching of transcriptional activity of large DNA through a conformational transition in cooperation with phospholipid membrane. JACS. 2010;132:12464-12471
6. Sasaki M, Nakasato I, Sugiura H, Fujita H, Sakata T. Estimation of an index of hydrophobicity of DNA interior using 5-methoxypsoralen as a fluorescent probe. Photochem. Photobiol. 1987;46:551-555
7. Kuboi R, Yano K, Komasawa I. Evaluation of Surface Properties and Partitioning of Proteins in Aqueous Two-Phase Extraction Systems. Solv. Extr. Res. Dev. Japan. 1994;1:42-52
8. Kuboi R, Umakoshi H. Analysis and separation of amyloid β-peptides using aqueous two-phase systems under stress conditions - From aqueous two-phase system to liposome membrane system. Solv. Extr. Res. Dev. Japan. 2006;13:9-21
9. Umakoshi H, Yoshimoto N, Yoshimoto M, Shimanouchi T, Kuboi R. Characterization of surface properties of microbial transglutaminase using aqueous two-phase partitioning method. Solv. Extr. Res. Dev. Japan. 2008;15:111-115
10. Umakoshi H, Kuboi R, Komasawa I. Control of partitioning of bacterial cells and characterization of their surface properties in aqueous two-phase systems. J. Ferm. Bioeng. 1997;84:572-578
11. Albertsson PA. Partition of Cell Particles and Macromolecules in Polymer Two-Phase Systems. Adv. Protein Chem. 1970;24:309-341
12. Morozkin ES, Laktionov PP, Rykova EY, Vlassov VV. Fluorometric quantification of RNA and DNA in solutions containing both nucleic acids. Anal. Biochem. 2003;322:48-50
13. Nozaki Y, Tanford C. The solubility of amino acids and two glycine peptides in aqueous ethanol and dioxane solutions. J. Biol. Chem. 1971;246:2211-2217
14. Hobro AJ, Rouhi M, Blanch EW, Conn GL. Raman and Raman optical activity (ROA) analysis of RNA structural motifs in Domain I of the EMCV IRES. Nucl. Acids Res. 2007;35:1169-1177
15. Zuker M. Mfold web server for nucleic acids folding and hybridization prediction. Nucl. Acids Res. 2003;31:3406-3415
16. W.-Hardt D, Schlegl J, Erdmann VA, Hartmann RK. Gel retardation analysis of E.Coli M1 RNA - tRNA complexes. Nucl. Acids Res. 1993;21:3521-3527
17. H.-Blank U, Soll D. The nucleotide sequence of two leucine tRNA species from Escherichia Coli K12. Biochem. Biophys. Res. Comm. 1971;43:1192-1197
18. Shimanouchi T, Shimauchi N, Nishiyama K, Vu HT, Yagi H, Goto Y, Umakoshi H, Kuboi R. Characterization of amyloid β fibrils with an aqueous two-phase system: Implications of fibril formation. Solv. Extr. Res. Dev. Japan. 2010;17:121-128
19. Umakoshi H, Nishida M, Suga K, Bui HT, Shimanouchi T, Kuboi R. Characterization of green fluorescent protein using aqueous two-phase systems. Solv. Extr. Res. Dev. Japan. 2009;16:145-150
20. Shih P, Pedersen LG, Gibbs PR, Wolfenden R. Hydrophobicities of the nucleic acid bases: Distribution coefficients from water to cyclohexane. J. Mol. Biol. 1998;280:421-430
21. Froehlich E, Mandeville J.S, Arnold D, Kreplak L, Tajmir-Riahi H.A. Effect of PEG and mPEG-anthracene on tRNA aggregation and particle formation. Biomacromol. 2012;13:282-287
22. Froehlich E, Mandeville J.S, Arnold D, Kreplak L, Tajmir-Riahi HA. PEG and mPEG-anthracene induce DNA condensation and particle formation. J. Phys. Chem. B. 2011;115:9873-9879
23. Froehlich E, Mandeville JS, Kreplak L, Tajmir-Riahi HA. Aggregation and particle formation of tRNA by dendrimers. Biomacromol. 2011;12:2780-2787
24. Froehlich E, Mandeville J.S, Weinert C.M, Kreplak L, Tajmir-Riahi HA. Bundling and aggregation of DNA by cationic dendrimers. Biomacromol. 2011;12:511-517
25. Yoshimoto M, Kuboi R, Yang Q, Miyake J. Immobilized liposome chromatography for studies of protein-membrane interactions and refolding of denatured bovine carbonic anhydrase. J. Chromato. B. 1998;712:59-71
26. Yoshimoto M, Shimanouchi T, Umakoshi H, Kuboi R. Immobilized liposome chromatography for refolding and purification of protein. J. Chromat. B: Biomed. Sci. Appl. 2000;743:93-99
27. Carmona P, Rodriguez-Casado A, Molina M. Conformational structure and bindingmode of glyceraldehydes-3-phosphate dehydrogenase to tRNA studied by Raman and CD spectroscopy. Biochim. Biophys. Acta. 1999;1432:222-233
28. Gregoire CJ, Gautheret D, Loret EP. No tRNA3Lys Unwinding in a Complex with HIVNCp7. J. Biol. Chem. 1997;272:25143-25148
29. De Gelder J, De Gussem K, Vandenabeele P, Moens L. Reference database of Raman spectra of biological molecules. J. Raman Spectr. 2007;38:1133-1147
30. Gong B, Chen JH, Yajima R, Chen Y, Chase E, Chadalavada DM. et al. Bevilacqua, Raman crystallography of RNA. Methods. 2009;49:101-111
31. Carmona P, Molina M, RodrÃguez-Casado A. Raman spectra and structure of a 25mer HCV RNA, J. Raman Spectr. 2009;40:893-897
32. Thomas G.J.Jr, Chen MC, Hartman KA. Raman studies of nucleic acids. X. Conformational structures of Escherichia coli transfer RNAs in aqueous solution. Biochim Biophys Acta. 1973;324:37-49
33. Thomas G.J.Jr, Prescott B, Hamilton MG. Raman spectra and conformational properties of ribosomes during various stages of disassembly. Biochem. 1980;19:3604-3613
34. Clark CL, Cecil PK, Singh D, Gray DM. CD, absorption and thermodynamic analysis of repeating dinucleotide DNA, RNA and hybrid duplexes [d/r(AC)]12∙[d/r(GT/U)]12 and the influence of phosphorothioate substitution. Nucl. Acids Res. 1997;25:4098-4105
35. Laso MRV, Zhu D, Sagliocco F, Brown AJP, Tuite MF, McCarthy JEG. Inhibition of translational initiation in the yeast Saccharomyces cerevisiae as a function of the stability and position of hairpin structures in the mRNA leader. J. Biol. Chem. 1993;268:6453-6462
Author contact
![]() Corresponding author: Prof. Dr. Hiroshi Umakoshi. Division of Chemical Engineering, Graduate School of Engineering Science, Osaka University, 1-3 Machikaneyama-cho, Toyonaka, Osaka 560-8531, Japan; Tel: +81-6-6850-6286; Fax: +81-6-6850-6286; E-mail: umakoshies.osaka-u.ac.jp
Corresponding author: Prof. Dr. Hiroshi Umakoshi. Division of Chemical Engineering, Graduate School of Engineering Science, Osaka University, 1-3 Machikaneyama-cho, Toyonaka, Osaka 560-8531, Japan; Tel: +81-6-6850-6286; Fax: +81-6-6850-6286; E-mail: umakoshies.osaka-u.ac.jp