Impact Factor ISSN: 1449-2288
- Issue 12; 2026
- Issue 11; 2026
- Issue 10; 2026
- Issue 9; 2026
- Issue 8; 2026
- Volume 22; 2026
- Past Issues
- Advance Articles
- Editorial Board
- Cover Images
- Index & Coverage
- Cover Suggestion
- Special Issues
Introduction
Materials and Methods
Results
Discussion
Supplementary Material
Abbreviations
Acknowledgements
References

 Global reach, higher impact
Int J Biol Sci 2012; 8(10):1363-1374. doi:10.7150/ijbs.5106 This issue Cite
Research Paper
Identification of Metastamirs as Metastasis-associated MicroRNAs in Clear Cell Renal Cell Carcinomas
Zofia Wotschofsky1,2*, Julia Liep1,2*, Hellmuth-Alexander Meyer1,3, Monika Jung1, Ina Wagner4, Alexander C. Disch5, Klaus D. Schaser5, Ingo Melcher5, Ergin Kilic6, Jonas Busch1, Steffen Weikert1, Kurt Miller1, Andreas Erbersdobler7, Hans-Joachim Mollenkopf4, Klaus Jung1,2,8 ![]()
1. Department of Urology, University Hospital Charité, Berlin, Germany.
2. Berlin Institute for Urologic Research, Berlin, Germany.
3. Institute of Physiology, University Hospital Charité, Berlin, Germany.
4. Max Planck Institute for Infection Biology, Berlin, Germany.
5. Center for Musculoskeletal Surgery, University Hospital Charité, Berlin, Germany.
6. Institute of Pathology, University Hospital Charité, Germany.
7. Institute of Pathology, University Rostock, Germany.
8. Corresponding author: Prof. Dr. Klaus Jung, Department of Urology, University Hospital Charité, Schumannstrasse 20/21, D-10117 Berlin, Germany; E-mail: klaus.jung@charite.de; Tel. ++49-30 450-515041, Fax:++49-30 450-51590.
* These authors contributed equally.
Received 2012-8-26; Accepted 2012-10-24; Published 2012-10-28
Abstract
MicroRNAs (miRNAs) play a pivotal role in cancerogenesis and cancer progression, but their specific role in the metastasis of clear cell renal cell carcinomas (ccRCC) is still limited. Based on microRNA microarray analyses from normal and cancerous samples of ccRCC specimens and from bone metastases of ccRCC patients, we identified a set of 57 differentially expressed microRNAs between these three sample groups of ccRCC. A selected panel of 33 miRNAs was subsequently validated by RT-qPCR on total 57 samples. Then, 30 of the 33 examined miRNAs were confirmed to be deregulated. A stepwise down-regulation of miRNA expression from normal, over primary tumor to metastatic tissue samples, was found to be typical. A total of 23 miRNAs (miR-10b/-19a/-19b/-20a/-29a/-29b/-29c/-100/-101/-126/-127/-130/-141/-143/-145/-148a/-192/-194/-200c/-210/-215/-370/-514) were down-regulated in metastatic tissue samples compared with normal tissue. This down-regulated expression in metastatic tissue in comparison with primary tumor tissue was also present in 21 miRNAs. In cell culture experiments with 5-aza-2'-deoxycytidine and trichostatin A, epigenetic modifications were shown as one reason of this down-regulation. The altered miRNA profiles, comprising newly identified metastasis-associated miRNAs, termed metastamir and the predicted miRNA-target interactions together with the significant correlations of miRNAs that were either lost or newly appeared in the studied sample groups, afford a solid basis for further functional analyses of individual miRNAs in RCC metastatic progression.
Keywords: Renal cell carcinoma, Microarray, RT-qPCR, microRNAs, Metastasis.
Introduction
Renal cell carcinoma (RCC) is one of the ten most frequent tumors, representing approximately 3-5% of all adult malignancies [1]. In 2012, 64,770 new cancer cases and 13,570 deaths are expected in the USA [1]. Approximately 80-90% of this cancer comprises the histological clear cell subtype of RCC (ccRCC). At the time of initial diagnosis, approximately 60% of the patients have a localized carcinoma, and nearly 20% are identified with regional or distant metastases [2]. As approximately 30% of RCC cases develop metastatic disease following surgery with curative intent, there is a need to better detection of high risk RCC to potentially improve the curative treatment for RCC disease. Metastatic spread of RCC, primarily occurring in the lungs, bones, liver or brain, account for the high morbidity and poor prognosis. The average survival time from the diagnosis of distant metastasis ranges around 24 months, and less than 20% of the patients survive more than 5 years [2]. Thus, essential research efforts are needed to establish novel molecular-based strategies to more successfully combat this aggressive metastatic disease.
Cancer progression is a complex multi-step process for which the path from a primary tumor to a metastatic lesion is still largely unknown. It is suggested that the organ-specific sequence of these stepwise events is induced by epigenetic and genetic changes [3]. Therefore, a better understanding of these molecular processes could allow the development of early diagnostic markers and could lead to effective, targeted approaches to preventing and treating RCC metastasis. Recent reports have shown the emerging role of microRNAs (miRNAs) in cancerogenesis. The identified miRNAs associated to cancer have been termed oncomirs [4], and the specific miRNAs with pro- and anti-metastatic effects are so-called metastamirs [5,6]. These non-protein coding RNAs of approximately 20-22 nucleotides are involved in the regulation of approximately 30% of all of the genes at the post-transcriptional level [7]. As of July 2012, a total of 1921 mature human miRNAs have been annotated in the miRBase release 18.0 (http://www.mirbase.org). Meanwhile, numerous studies have proven the differential miRNA expression for different cancer types [8-11]. For urological malignancies, we recently summarized the expression data of miRNAs as well as the potential role of miRNAs as regulators in the signal transduction pathways and as metastamirs [6,12,13]. In the case of renal cell carcinoma, several studies have reported on differential miRNA expression patterns [14-18]. However, the information on specific miRNAs in relation to the RCC metastasis is limited. In the literature, only a few reports on miRNA profiles or single miRNAs that are related to RCC metastasis are published with a minimal overlap of miRNAs between those studies [19-23].
Therefore, in the present study, we aimed (a) to specify a typical metastamir pattern of ccRCC by examining our own miRNA microarray data from non-malignant and malignant samples of ccRCC specimens as well as from bone metastatic ccRCC samples, (b) to validate the most prominent metastamirs in reverse transcription quantitative RT-PCR (RT-qPCR) assays, (c) to examine epigenetic modifications as potential reason for altered miRNA expression, (d) to correlate the expression of validated miRNAs with each other and with clinico-pathological variables, and (e) to use an enrichment strategy comprising miRNA and predicted gene targets thereof prominent in the renal cell carcinoma pathway in the Kyoto Encyclopedia of Genes and Genomes (KEGG). These microRNA metastatic signatures could be helpful for providing a better understanding of the biology of ccRCC and for predicting clinical outcomes and metastatic recurrences.
Materials and Methods
Patients and Tissue Samples
A total 22 non-malignant tissue samples from 22 non-metastatic ccRCC patients (21 male, one female; median age 62, range 41-78 years) and 22 malignant samples from another 22 ccRCC patients (21 male, one female; median age 67, range 39-87 years) undergoing radical nephrectomy as well as metastatic tissue samples from 13 patients (12 male, one female, median age 67, range 40-89 years) undergoing surgical resection of ccRCC bone metastases were collected between 2003 and 2010 at the University Hospital Charité, as previously reported [24]. Tissue samples were snap frozen in liquid nitrogen directly after surgery and were stored at -80°C until RNA isolation. Fifteen tumor samples were classified as pT1, one as pT2, and six as pT3, according to the 2002 TNM classification, while the histological grading according to the 2004 WHO criteria resulted in four G1, 17 G2, and one G3 (Table 1). All of the tumor types were ccRCC. The study was approved by the Ethics Committee of the University Hospital Charité in accordance with the principles of Declaration of Helsinki; the patients provided informed consent. All of these samples were used for the validation of the microarray-based selection of differentially expressed miRNAs with RT-qPCR. Tissue samples used for microarray profiling were previously described [24].
Clinical and histopathological characteristics of investigated patients.
| Characteristic | ccRCC patients undergoing nephrectomy (n=22) | Bone metastatic ccRCC patients (n=13) |
|---|---|---|
| Age, years | ||
| Median | 67 | 69 |
| Range | 37-78 | 40-89 |
| Sex | ||
| Male | 21 | 12 |
| Female | 1 | 1 |
| pT stage | Not applicable | |
| pT1 | 15 | |
| pT2 | 1 | |
| pT3 | 6 | |
| pT4 | - | |
| N stage | Not applicable | |
| pN0 | 6 | |
| pN1 | - | |
| pNx | 16 | |
| M stage | ||
| M0 | 22 | |
| M1 | - | |
| Mx | - | |
| Surgical margin | Not applicable | |
| R0 | 19 | |
| R1 | 1 | |
| R2 | 1 | |
| Rx | 1 |
ccRCC: clear cell renal cell carcinoma.
Cell Culture Experiments with Epigenetic Modifications
The ccRCC cell lines ACHN and A498 were maintained in Eagle's Minimum Essential Medium (Biochrom, Berlin, Germany), Caki-1 in McCoy's 5a Medium (Invitrogen, Darmstadt, Germany), and 786-O in RPMI 1640 (Invitrogen) under standard conditions (37°C, 5% CO2) recommended by the American Type Culture Collection (Manassas, VA, USA). All media were supplemented with 10% fetal calf serum (PAA, Pasching, Austria) and 100 U/ml penicillin and 100 mg/ml streptomycin (both PAA). For the demethylation and histone deacetylase inhibition experiments, the cells were plated in 6-well plates and 24 h later, they were treated with 1 µM 5-Aza-2'-deoxycytidine (Aza) (Sigma, Munich, Germany) for 72 h or with 1 µM Aza for 72 h followed by 100nM trichostatin A (TSA) (Sigma) for 24h. The media with Aza was renewed after 48 h.
RNA Extraction, Microarray-based MiRNA Profiling and Quantitative RT-PCR of MiRNAs
Analyses were performed as previously described [11,17,24]. Details are given in Doc S1 of Supplementary Material.
Prediction of MicroRNA Targets
Target prediction was performed using miRecords (http://mirecords.umn.edu/miRecords) which integrates several miRNA target prediction programs [25]. We assumed a useful prediction only if the putative target was concordantly identified by three of the most common algorithms (miRanda, PicTar, and TargetScan). Some miRNAs were not listed neither in the PicTar tools used in the miRecords search machine and were also not listed in the actualized PicTar program [26]. In this case, additional positive predictions by two other algorithms (PITA, RNAhybrid) in miRecords were used as a criterion for a putative target. The web-based software DIANA-mirPath (http://diana.cslab.ece.ntua.gr) was applied to identify genes that are affected by differentially expressed miRNAs in the renal cell carcinoma pathway provided by the KEGG database [27].
Statistical Analysis
Statistical analyses were performed with Graph Pad Prism version 6.0 (GraphPad Software Inc., La Jolla, CA, USA), IBM SPSS Statistics version 19 (IBM Corp., Somers, NY, USA), and MedCalc version 12.2.1 (MedCalc Software, Mariakerke, Belgium). Differences between the miRNA expressions of the three sample groups were analyzed by non-parametric tests (Kruskal-Wallis-test with Dunn's test; Mann-Whitney U test), as indicated in the corresponding passages in the text. Significances in the cell experiments were calculated by the Student's t-test. Correlations were assessed by Spearman's rank correlation coefficients. P-values of <0.05 (two-tailed) were considered to be statistically significant. Data of the cell Sample size determinations were performed using Graph-Pad StatMate, version 2.0, based on an alpha error of 5% and a power of 80% (Doc S2 of Supplementary Material).
Results
Characteristics of the Isolated Total RNA
The median RNA yield from one mg wet weight of normal, malignant, and metastatic tissue samples amounted to 937 ng (95% CI, 734-1247 ng), 499 ng (466-636 ng), and 809 ng (331-1165 ng), respectively. The yield from the malignant RCC samples was significantly lower compared with the quantities that were isolated from the two other tissue samples (Kruskal-Wallis test, P<0.001). The median ratios of the absorbances at 260 nm to 280 nm (2.04, 2.01, and 2.00) and the median RIN values (7.45, 7.8, and 7.2) of the RNA samples from the three sample groups did not differ (Kruskal-Wallis test, P>0.05).
Microarray-based Selection of Metastamirs
The normalized data and the quality flags (present and absent calls) generated from GeneSpring software were used to identify differentially expressed miRNA genes between sample groups. Here, 148 miRNAs of the 470 human miRNA species located on the Agilent microarray chip were flagged as “valid” in a minimum of 80% of the samples from each group. A total of 57 of these miRNAs with a minimum 1.5-fold difference between the mean expression in the malignant RCC samples and bone-metastatic samples were classified as dysregulated miRNAs (Mann-Whitney U test, corrected P<0.05; Supplementary Material: Table S1). These miRNAs were re-evaluated concerning chip raw-signal intensity to detect the selected candidates in RT-qPCR. Our previously published work showed that the raw signal strength in microarray experiments and the ability to detect a miRNA by RT-qPCR was strongly correlated [11]. Therefore, a threshold of a mean raw signal >850 was used to condense the number of potentially deregulated miRNAs to a final list of 28 targets resulting from this microarray analysis (Table 2 and Supplementary Material: Table S1).
miRNAs included in the RT-qPCR analysis regarding their metastatic association.†
| Selected miRNAs by microarray analysis | |||||
| Microarray‡ | RT-qPCR‡ | ||||
| No. | miRNA | Fold changes | P | Fold changes | P |
| 1 | miR-10b | -2.29 | 0.001 | -3.91 | <0.0001 |
| 2 | miR-19a | -2.76 | 0.001 | -1.94 | <0.0001 |
| 3 | miR-19b | -1.68 | 0.003 | -1.71 | <0.0001 |
| 4 | miR-21 | +1.65 | 0.035 | +1.23 | 0.986 |
| 5 | miR-29a | -1.78 | 0.003 | -1.98 | 0.0004 |
| 6 | miR-29b | -3.36 | 0.001 | -4.28 | <0.0001 |
| 7 | miR-29c | -3.63 | 0.001 | -4.00 | <0.0001 |
| 8 | miR-100 | -2.40 | 0.025 | -1.87 | 0.007 |
| 9 | miR-101 | -2.17 | 0.001 | -3.57 | 0.001 |
| 10 | miR-126 | -2.76 | 0.001 | -2.60 | 0.002 |
| 11 | miR-130a | -1.76 | 0.013 | -1.78 | 0.019 |
| 12 | miR-143 | -2.51 | 0.015 | -2.44 | 0.011 |
| 13 | miR-145 | -2.80 | 0.005 | -2.56 | 0.001 |
| 14 | miR-148a | -2.10 | 0.009 | -1.65 | 0.039 |
| 15 | miR-192 | -2.98 | 0.013 | -5.13 | 0.001 |
| 16 | miR-194 | -3.40 | 0.010 | -7.05 | 0.0002 |
| 17 | miR-195 | -2.31 | 0.021 | -2.55 | 0.054 |
| 18 | miR-223 | +2.83 | 0.013 | -1.02 | 0.824 |
| 19 | miR-370 | +11.3 | 0.001 | +1.43 | 0.905 |
| 20 | miR-451 | +4.79 | 0.013 | +1.60 | 0.403 |
| 21 | miR-494 | +5.73 | 0.001 | +1.17 | 0.063 |
| 22 | miR-575 | +7.87 | 0.001 | see Note§ | - |
| 23 | miR-630 | +15.2 | 0.001 | see Note§ | - |
| 24 | miR-638 | +5.93 | 0.001 | +1.56 | 0.030 |
| Selected miRNAs from a ccRCC-specific miRNA panel [17] | |||||
| 1 | miR-141 | - | - | -3.91 | <0.0001 |
| 2 | miR-155 | - | - | +1.52 | 0.267 |
| 3 | miR-200c | - | - | -2.62 | 0.004 |
| 4 | miR-210 | - | - | -1.54 | 0.063 |
| 5 | miR-224 | - | - | +1.38 | 0.484 |
| 6 | miR-514 | - | - | -3.78 | 0.007 |
| Selected miRNAs after literature search | |||||
| 1 | let-7f | Gottardo et al. [14] | see Note§ | ||
| 2 | miR-20a | Chow et al. [29] | -1.40 | 0.002 | |
| 3 | miR-26a | Liu et al. [31], Chow et al. [30], Heinzelmann et al. [20] | -2.11 | <0.0001 | |
| 4 | miR-106b | Chow et al. [30], Slaby et al. [19] | see Note§ | ||
| 5 | miR-125b | Liu et al. [31] | see Note§ | ||
| 6 | miR-127 | Saito et al .[28] | -1.43 | 0.091 | |
| 7 | miR-215 | Nakada et al. [15] | -7.28 | 0.007 | |
| 8 | miR-296 | Juan et al. [18] | +3.55 | 0.001 | |
†miRNAs investigated in this study were chosen on the basis of the microarray-based selection of metastamirs in the present study, a specific panel of differentially expressed miRNAs in renal cell carcinoma described in a previous study [17] and literature data as indicated. ‡Fold changes in metastatic to primary renal cell carcinoma samples (see Figure 1 and Supplementary Material: Table S1). Symbols: +, up-regulation; -, down-regulation. §miRNAs in italics showed Cq values >35 in RT-qPCR of the pooled samples and were therefore excluded in subsequent analyses.
RT-qPCR Validation of Metastamirs
To confirm the results of the microarray data sets, 24 out of these 28 miRNAs with the highest differential fold changes and the immediate availability of test kits build the selection criteria for the validation using RT-qPCR (Table 2). Furthermore, six differentially expressed miRNAs based on our previous ccRCC profiling study [17] and eight additional miRNAs from literature [14,15,18-20,28-31] were included in this first validation approach (Table 2).
The initial validation of all these 38 miRNAs was checked regarding their measurability (Cqs <35) in three RNA pools that were prepared with equal amounts of RNAs from eight RNA samples isolated from normal, malignant, and metastatic samples. Five miRNAs with Cqs >35 in the pools were excluded from further analysis. The remaining 33 miRNAs were measured in 57 individual clinical samples in the final RT-qPCR validation normalized against the previously validated reference gene combination of miR-28, miR-103, and miR-106a (Table 2) [24]. Only a few of the 33 miRNAs are affiliated with the same miRNA gene family or miRNA cluster (Supplementary Material: Table S2). A very good agreement between the microarray data and the RT-qPCR results was evident (Table 2).
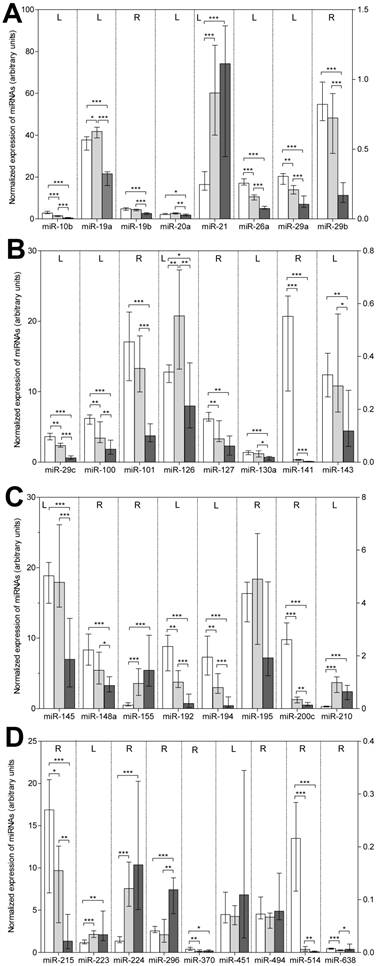
The results of the RT-qPCR measurements in the three sample groups are presented in Figure 1 and in detail in Supplementary Material: Table S3. The following features are striking: (a) 30 of the 33 total examined miRNAs, except for miR-195, miR-451, and miR-494, showed a differentially expressed pattern in the three sample groups. (b) The general down-regulation of miRNAs in bone metastatic samples found in the microarray analysis was confirmed; 21 of the 30 deregulated miRNAs were significantly down-regulated (P<0.005) in metastatic samples when compared with those in primary tumors (Table 2). In addition, these 21 miRNAs, as well as miR-127 and miR-370, were less expressed in metastatic than in normal tissue samples. (c) Eight miRNAs (miR-19b, miR-20a, miR-29b, miR-101, miR-130a, miR-143, miR-145, and miR-148) did not differ in their expression between normal and tumor RCC samples but decreased in metastatic samples. This decreased expression in metastatic samples was also observed for miR-19a and miR-126, which were more highly expressed in tumor RCC samples compared with samples from normal tissue. (d) Only six miRNAs (miR-21, miR-155, miR-210, miR-223, miR-224, and miR-296) were up-regulated in metastatic samples in comparison to normal tissue samples, while only one of these miRNAs (miR-296) and the additional miR-638 were higher expressed compared with primary tumor samples. (e) A gradually reduced expression in non-malignant tissue samples as compared to primary tumor and metastatic samples was observed for 11 miRNAs (miR-10b, miR-26a, miR-29a, miR-29c, miR-100, miR-141, miR-192, miR-194, miR-200c, miR-215, and miR-514).
Expression of the 33 miRNAs validated by RT-qPCR in normal, primary tumor, and metastatic tissue samples of renal cell carcinoma. Columns (blank column: normal, non-malignant tissue, n=22; gray column: primary tumor tissue, n=22; black column: bone metastatic tissue, n=13) represent medians with 95% CIs. The reference miRNA combination of miR-28, miR-103, and miR-106a was used for normalization [24]. For the sake of completeness, we also included in this figure of deregulated miRNAs the data of miR-19b and miR-141 previously reported [24]. For reasons of clarity, miRNAs were listed according to their number and the left (L) and right (R) y-axis, as indicated in the upper part of the figure, was used to represent the expression levels of the various miRNAs. Statistical differences were calculated by the Mann-Whitney U test between the groups and indicated as follows: *, P<0.05; **, P<0.01; ***, at least P<0.001.
Down-regulation of miRNAs by Epigenetic Modifications
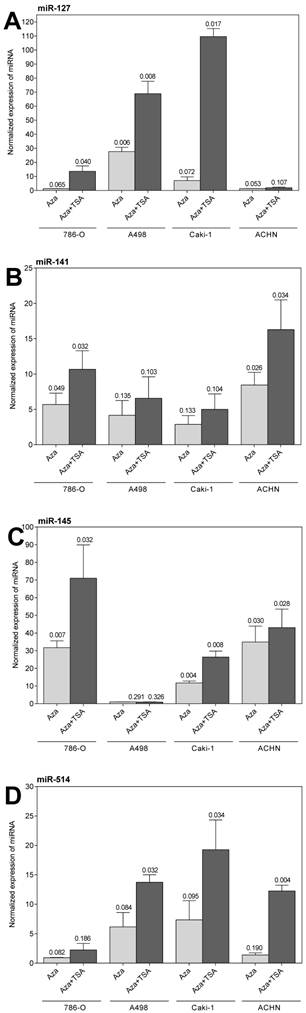
We hypothesized that the high proportion of down-regulated miRNAs could possibly be caused by epigenetic modifications. Therefore, we exemplarily selected miR-29a, miR-101, miR-127, miR-141, miR-145, miR-200c, miR-215, and miR-514 to study their expression in RCC cell lines after treatment with the demethylating agent 5-aza-2'-deoxycytidine alone or in combination with the histone deacetylase inhibitor trichostatin A. As shown in Figure 2, the expression of miR-127, miR-141, miR-145, and miR-514 could be restored, whereby the re-expression effect was generally enhanced when both agents were used in combination. The other four miRNA (data not shown) did not change their expression behavior under the above-mentioned treatment.
Expression of miR-127, miR-141, miR-145, and miR-514 in the renal cell carcinoma cell lines 786-O, A498, Caki-1, and ACHN treated with 5-aza-2'-deoxycytidine (Aza) and trichostatin A (TSA). Values are given as fold changes (mean ± SEM) in treated cells compared with the expression in untreated cells. The reference gene combination of RNU48 and RNU6B was used for normalization and the expression in the untreated cells was set one.
Correlation between the Expression of MiRNAs and Their Expression with Clinico-pathologic Variables
The correlation between the expression of the individual miRNAs was analyzed by Spearman's rank correlation (Supplementary Material: Table S4). From this analysis, 32 miRNA pairs were identified with correlation coefficients (rs) >0.70 (Table 3). Taking into account this high level of rs >0.70 as criterion of co-expression/co-regulation between miRNAs, differential correlation patterns between the three groups were observed (Table 3). Two main situations could be distinguished: (a) significant correlations of the miRNA pairs in all of the sample groups without or with slight differences between them (e.g., the pairs miR-10b/miR-126, miR-19a/miR-19b, miR-192/miR-194, and miR-194/miR-215) and (b) distinctly different correlation coefficients of the miRNA pairs between two different sample groups with either the loss of correlation (e.g., miR-21/miR-223, miR-130a/miR-143) or a new correlation (e.g., miR-10b/miR-143, miR-127/miR-200c) that appeared in the metastatic samples compared with those in non-malignant and primary tumor samples. miRNA pairs from the same family/cluster (Supplementary Material: Table S2) did not always correlate (e.g., miR-141/miR-200c, miR-29a/miR-29b) whereas significantly altered correlations were observed between miRNA pairs (e.g., miR-19a/miR-20a, miR-143/miR-145), depending on the sample group studied. As explained in the Discussion section, the correlation data, especially the loss or new appearance of correlations between the different miRNA pairs in the study groups, could be helpful to interpret the changed involvement of miRNAs as characteristics for the respective groups.
Spearman rank correlation coefficients (rS) >0.70 between miRNAs in normal (non-malignant) renal tissue samples in comparison to the rS-values of miRNAs in tissue samples from the primary clear cell renal cell carcinoma and metastases.
| Correlation between miRNA pairs | rS | |||
|---|---|---|---|---|
| Non-malignant | ccRCC | Metastases | ||
| miR-10b | miR-101 | 0.473 | 0.382† | 0.709 |
| miR-10b | miR-126 | 0.560 | 0.813 | 0.808 |
| miR-10b | miR-143 | 0.280†,b | 0.280†,b,c | 0.852b,c |
| miR-10b | miR-194 | 0.721a,b | 0.161†,a | -0.269†,b |
| miR-19a | miR-19b | 0.871 | 0.720 | 0.945 |
| miR-19a | miR-20a | 0.534a | 0.877a,c | 0.319†,c |
| miR-19b | miR-130a | 0.375†,a,b | 0.870a,c | -0.456†,b,c |
| miR-21 | miR-223 | 0.770a,b | 0.299†,a | 0.060†,b |
| miR-29a | miR-130a | 0.761b | 0.447 | 0.027†,b |
| miR-29a | miR-141 | 0.730 | 0.286† | 0.407† |
| miR-29b | miR-29c | 0.579 | 0.754 | 0.462† |
| miR-29b | miR-514 | -0.021†,b | 0.046†,c | -0.797b,c |
| miR-101 | miR-194 | 0.794b | 0.506 | 0.203†,b |
| miR-101 | miR-215 | 0.800b | 0.530 | 0.275†,b |
| miR-126 | miR-143 | 0.247†,b | 0.144†,c | 0.907b,c |
| miR-126 | miR-145 | -0.249†,b | 0.089†,c | 0.874b,c |
| miR-126 | miR-195 | 0.246†,b | 0.344†,c | 0.835b |
| miR-127 | miR-195 | 0.478 | 0.235† | 0.742 |
| miR-127 | miR-200c | -0.106†,b | 0.073†,c | -0.736b |
| miR-127 | miR-370 | 0.677a | 0.906a | 0.879 |
| miR-130a | miR-143 | 0.832b | 0.496c | -0.225†,b,c |
| miR-130a | miR-195 | 0.840b | 0.424 | 0.071†,b |
| miR-141 | miR-210 | 0.438 | 0.738c | 0.016†,c |
| miR-143 | miR-145 | 0.466b | 0.641c | 0.934b,c |
| miR-143 | miR-195 | 0.780 | 0.625 | 0.769 |
| miR-145 | miR-370 | 0.136† | 0.522 | 0.703 |
| miR-148a | miR-194 | 0.799a,b | 0.0224†,a | -0.264†,b |
| miR-192 | miR-194 | 0.854 | 0.835 | 0.967 |
| miR-192 | miR-215 | 0.768 | 0.868 | 0.951 |
| miR-194 | miR-215 | 0.864 | 0.773 | 0.940 |
| miR-451 | miR-638 | 0.566 | 0.313† | 0.775 |
| miR-494 | miR-638 | 0.353† | 0.622 | 0.709 |
ccRCC: clear cell renal cell carcinoma; rs: Spearman's rank correlation coefficient. † Correlation coefficients with this superscript indicate non-significant (P>0.05) correlations within the group. Figures without this superscript indicate significant correlation between the corresponding miRNA pair. aSignificant differences (at least P <0.05) between the correlation coefficients from non-malignant and primary tumor samples. bSignificant differences (at least P<0.05) between the correlation coefficients from non-malignant and metastatic tissue samples. cSignificant differences (at least P<0.05) of the correlation coefficients from the primary tumor samples and metastatic tissue samples.
No significant association was found between the expression of any miRNA and age (rS with P values 0.061 to 0.974). Out of the 33 miRNAs measured, only miR-130a (rs=-0.450; P=0.036), miR-200c (rs=0.488; P=0.021), and miR-638 (rs=-0.648; P=0.001) were significantly (P<0.05) correlated with the tumor stage, while miR-19a (rs=-0.450; P=0.036), miR-130a (rs=-0.627; P=0.048), miR-210 (rs=-0.455; P =0.048), and miR-451 (rs=0.441; P=0.040) significantly correlated with the tumor grade.
Putative MiRNA Target Genes
In Table 4, we summarized validated and the number of predicted putative miRNA-target interactions of the 30 differentially expressed miRNAs shown in this study. As stated in the Methods section, only the genes that were identified by the three computational prediction programs miRanda, PicTar, and TargetScan were considered. However, despite this strong selection criterion, the high figures of predicted and already validated targets related to the KEGG pathway "renal cell carcinoma" [27] are obvious (Table 4).
Predicted and validated targets of the differentially expressed miRNAs in this study.
| hsa-miRNA | Predicted targets† | Validated targets of the RCC pathway‡ |
|---|---|---|
| miR-10b | 57 | PIK3CA, CRK, PAK7 |
| miR-19a | 321 | PIK3CA, HIF1A, KRAS, PAK6, RAP1B, RAP1A, PIK3R3, RAF1 |
| miR-19b | 326 | PIK3CA, HIF1A, KRAS, PAK6, RAP1B, RAP1A, PIK3R3, RAF1 |
| miR-20a | 293 | HIF1A, EGLN3, EPAS1, VEGFA, CRK, MAPK1, PAK7, EGLN1 |
| miR-21 | 67 | PIK3R1 |
| miR-26a | 206 | HGF, CREBBP, PAK2, RAP1B, RAP1A, EP300 |
| miR-29a | 281 | PDGFB, PIK3R1, VEGFA, CDC42, PIK3R2, ARNT, AKT3, TGFB3 |
| miR-29b | 284 | PDGFB, PIK3R1, VEGFA, CDC42, PIK3R2, AKT3 |
| miR-29c | 315 | PDGFB, PIK3R1, VEGFA, CDC42, PIK3R2, ARNT, AKT3, TGFB3 |
| miR-100 | 15 | - |
| miR-101 | 188 | TCEB1, MAPK1, RAC1, PAK2, RAP1B, AKT2, PAK7 |
| miR-126 | 4 | CRK |
| miR-127 | 4 | - |
| miR-130a | 233 | MET, EGLN3, SOS1, PAK6, EP300 |
| miR-141 | 168 | HGF, CDC42, GRB2, TGFB2, GAB1 |
| miR-143 | 74 | KRAS, PTPN11, EGLN1 |
| miR-145 | 101 | PAK7 |
| miR-148a | 166 | MET, SLC2A1, EPAS1, SOS1, EP300, PIK3R3 |
| miR-155 | 96 | PIK3CA, HIF1A, KRAS, SOS1, RAP1B, ETS1 |
| miR-192 | 19 | - |
| miR-194 | 74 | HIF1A, MAPK1, RAP1B, AKT2 |
| miR-200c | 289 | TCEB1, CRKL, SOS1, PTPN11, VEGFA, RAC1, RAP1B, ETS1, PAK7, EP300, EGLN1, JUN |
| miR-210 | 4 | - |
| miR-215 | 19 | RAP1B |
| miR-223 | 58 | PAK7 |
| miR-224 | 82 | ETS1 |
| miR-296 | 1050 | - |
| miR-370 | 132 | PIK3CA, SOS1 |
| miR-514 | 550 | RBX1, SLC2A1, JUN, AKT3 |
| miR-638 | 254 | - |
†Number of predicted targets according to the algorithms explained in Materials and Methods. The individual targets are available as complete list upon request. ‡Validated targets indicated by the software DIANA-mirPath (http://diana.cslab.ece.ntua.gr) corresponding to the genes that were provided to be affected in the renal cell carcinoma pathway as shown in the KEGG database [27].
Discussion
In 2007, Ma et al. [32] showed for the first time that miRNAs belong to the group of critical regulators in the complex invasion-metastasis network process of breast cancer. Because miRNAs regulate ~30% of the transcriptome by either translational inhibition, destabilization or RNA decay [33], these cellular components are considered to be important modulators of signal transduction pathways in metastatic progression, including for urological tumors [6,13,34].
In the present work, we used several approaches for identifying the involvement of miRNAs in RCC metastasis. These approaches included microarray screening of differentially expressed miRNAs, the subsequent validation of the most distinctly deregulated over- and under-expressed miRNAs by RT-qPCR using additional clinical samples, correlation analysis of these miRNAs between the sample groups, the prediction of putative miRNA-target interactions, and the compilation of validated targets by the deregulated miRNAs in the KEGG pathway "renal cell carcinoma". The basic principle was the differential expression of miRNAs between normal, primary tumor, and metastatic tissue. We consider the comparative examination of the three sample groups to be necessary for clear evidence of differential expression to avoid misleading conclusions. For example, the expression of six miRNAs (miR-21, miR-155, miR-210, miR-223, miR-224, and miR-296) was found to be up-regulated in primary tumor and metastatic samples compared with normal tissue, but there was no difference between primary tumor and metastases except for miR-296. In contrast, two miRNAs (miR-127 and miR-370) out of the 23 down-regulated miRNAs in metastases compared with normal tissue were not differentially expressed between primary tumor and metastases, while eight miRNAs (miR-19b, miR-20a, miR-29b, miR-101, miR-130a, miR-143, miR-145, and miR-148) were not differentially expressed between normal and tumor RCC samples but were decreased in metastatic samples. Thus, to test only the expression difference between primary tumor and metastatic tissue samples, there is a risk that important characteristics could be overseen and that might cause misinterpretation regarding the behavior of metastatic miRNA expression.
In the present work, we not only confirmed some the results of other studies, but mainly identified new miRNAs that were associated with RCC metastasis. Although the results of several expression studies regarding metastatic RCC samples have been reported after we started our study only a very small number of miRNAs has been congruently described as differentially expressed in these reports [19-23]. On the whole, 165 differentially expressed miRNAs were detected by microarray analysis in these four studies, which were performed by three independent groups and in our study (Supplementary Material: Table S6). However, only two (miR-10b, miR-143) and 13 miRNAs (let-7d, miR-10b, miR-26a, miR-29a, miR-29b, miR-30c, miR-106b, miR-126, miR-130a, miR-143, miR-145, miR-195, miR-451) were concordantly found to be altered in all studies or in at least three studies (Supplementary Material: Table S6). As previously discussed [12], this limited overlap might result from the use of different detection platforms with certain preanalytical and analytical particularities and in tumor and cohort differences that are not always clearly characterized as required. A different number of differentially expressed miRNAs will inevitably be detected if microarrays based on different mirBase releases are used because the current mirBase database is continuously updated with the newly discovered miRNAs. In addition, results based only on microarray data have the limitation of a relatively high false-positive rate. Thus, the validation of the microarray results by RT-qPCR is required. We validated the relatively high number of 33 miRNAs by RT-qPCR. In addition to the deregulated miRNAs found in our microarray analysis, we included in this validation process some additional miRNAs from the literature as potential metastasis marker (Table 2). In the above-mentioned studies, a smaller number of five to nine different deregulated miRNAs were validated or examined in further functional studies. Five (miR-10b, miR-126, miR-192, miR-194, miR-215) of seven deregulated miRNAs in the study of Khella et al. [22] and seven (miR-10b, miR-126, miR-143, miR-145, miR-192, miR-194, miR-195) of nine suspicious miRNAs in the study of Slaby et al. [23], recently published in the time when we prepared the submission of our work, were described to be associated with RCC metastasis in a similar fashion to the observations found in our work (Supplementary Material: Table S6). However, when compared with all previous studies, we validated 17 additional miRNAs in this study (miR-19a, miR-19b, miR-20a, miR-21, miR-29a, miR-29b, miR-29c, miR-100, miR-101, miR-130a, miR-148a, miR-223, miR-224, miR-296, miR-370, miR-514, and miR-638) that were associated with RCC metastasis and that were not described before. Thus, to the best of our knowledge, the presented list of 30 deregulated miRNAs comprises the most extensive list of RCC metastamirs validated by RT-qPCR. In this respect, the global approach in our study to assess the expression data in the three groups of normal, primary tumor, and metastatic tissue samples, both in the screening phase by microarrays and in the validation phase by RT-qPCR, as mentioned above, proved to be advantageous.
As described, a stepwise down-regulation of miRNA expression from normal over primary tumor to metastatic tissue samples appears to be more typical than an up-regulated expression in RCC progression. Already in 2005 Lu et al. [8] observed a general reduction of the expression level of many miRNAs in tumors. Because of the reduced global miRNA expression, the authors concluded that miRNAs could function to drive differentiation and prevent cell division. In this case, the expression levels of miRNAs might reflect the degree of cell differentiation [8,35]. The gradual down-regulation of miRNAs from normal tissue over the primary tumor to metastatic tissue in our study generally points in the same direction. It is obvious that the miRNAs affect the essential characteristics of cancer development and progression defined as the hallmarks of cancer in complex regulatory circuits [8,36]. But the complexity of these interactions might also explain that the downregulation of miRNAs, as shown for miR-19a, miR-130a, , miR-143, and miR-145 (Figure 1), does not always occur in a stepwise manner.
But there is still the question how the prevalent down-regulation of the miRNAs is mediated [8,37]. Previous studies showed that approximately miRNA coding genes are frequently located at fragile sites, in minimal regions of loss of heterozygosity, minimal regions of amplification or common breakpoint regions which are cancer-related genomic regions [38]. But cancer is not only caused by genetic mutations. The development of tumors results from accumulation of both, genetic and epigenetic changes. Alterations of the epigenetic pattern play also a very important role in miRNA dysregulation in human tumors. As actually reviewed for urological tumors [39], there seems to be a complicated feedback network between epigenetic changes and miRNA expression. Our data show that epigenetic mechanisms of hypermethylation and histone acetylation of chromatin are probably more important for the miRNA dysregulation in RCC than previously assumed [40]. However, other mechanism of miRNA deregulation caused by an altered transcription factor activity or by malfunctions in the miRNA biogenesis machinery have to be considered [37].
The comprehensive approach of this study also allowed us to apply correlation analysis of miRNAs within each sample group and between the normal group, the primary tumor, and the metastatic sample group. Considering the relatively high correlation coefficient of >0.70 to be an indicator of co-regulation/co-expression, characteristic constellations were observed. The consistent high correlation of numerous miRNA pairs between the three sample groups contrasted with the loss or appearance of new correlations. The loss or new appearance of new correlations of miRNAs can indicate important cellular and molecular alterations. Thus, miRNAs with that peculiarity are of special importance. A loss of correlation between the up-regulated miRNA pairs miR-21/miR-223 and the down-regulated pairs miR-101/miR-194 are two examples (Table 3). RHOB is a tumor suppressor gene and is predicted to be a common target, among others, for the two mentioned up-regulated miRNAs, miR-21 and miR-223, in metastases (Supplementary Material: Table S5). Moreover, RAC1, a small GTP-binding protein was predicted to be a putative target for miR-101 as well as for miR-194 (Supplementary Material: Table S5). The repression of RhoB protein induced by miR-21 is associated with increased proliferation, migration, invasion, and the decreased apoptosis of cancer cells [41,42] and RCC survival [43], while the Rac1 protein was found to be able to suppress tumor initiation and metastasis by cancer stem cells [44]. Thus, the differentially altered miRNA expression during the tumor initiation and metastasis reflected by the different development of the correlation of respective miRNA pairs between the sample groups suggests that the effects of the mentioned miRNAs on targets change during cancer progression. The altered pleiotropic effects of miRNAs during the different stages of cancer development may be the consequence [45]. It is obvious that these results already imply the necessity to explore miRNA-target interactions in the various stages of cancer development under the aspect of feedback networks.
To underline this view, we compiled the in silico predicted targets only for informational purposes (Table 4; Supplementary Material: Table S5). The number of predicted targets is partly very high and contrasts with the relatively low number of actually validated targets indicated in the KEGG database as part of the renal cell cancer pathway. However, it draws attention to new research topics at the same time. For certain miRNAs, a higher number of targets presented in the TarBase 6.0 of the DIANA lab (http://diana.cslab.ece.ntua.gr) compared with the predicted targets were observed (data not shown). This discrepancy is partly explained by altered mRNA levels of target genes in microarray analyses after transfection experiments in cell lines that were considered to be proof of evidence without further functional validation, which requires loss- and/or gain-of-function analyses.
Some limitations of this study merit discussion. We deliberately refrained from functional analysis of individual miRNAs and their potential targets, which might be considered to be a limitation of the present study. However, the primary focus of our work on the actual expression regulation in clinical samples and the identification of new miRNAs associated with RCC metastasis reinforce our view that sustainable validation data are essential for future research studies. A limited number of samples seems to be evaluated, however, the number of actually examined samples was consistent with the specified preconditions of type I and II errors (α=5%; β=80%) in the sample size calculations to perform this study. The results additionally confirmed that the risk of type I and II errors as problem in small studies could be excluded as much as possible.
In summary, this study on miRNAs profiles in normal, primary RCC, and metastatic tissue samples provides a comprehensive list of 30 deregulated metastasis-associated miRNAs termed metastamirs. A stepwise down-regulation of miRNA expression from normal over primary tumor to metastatic tissue samples was found to be typical. We primarily identified new miRNAs associated with RCC metastasis, and also confirmed the results of other studies because only a few miRNAs have been concordantly described as RCC metastamirs. This metastatic miRNA profile, together with the compiled predicted targets, provides a solid basis for the functional analysis of individual miRNAs and the subsequent integrative network evaluation of data.
Supplementary Material
Doc S1, Doc S2, Table S1-S5.
Abbreviations
ccRCC: clear cell renal cell carcinoma; Cq: quantification cycles; KEGG: Kyoto Encyclopedia of Genes and Genomes; miRNA: microRNA; RIN: RNA integrity number; RT-qPCR: quantitative RT-PCR.
Acknowledgements
This work was supported by fellowships from the Stiftung Urologische Forschung, Berlin, Germany for Zofia Wotschofsky and Julia Liep and this study includes parts of their doctoral theses.
Competing Interests
The authors have declared that no competing interest exists.
References
1. Siegel R, Naishadham D, Jemal A. Cancer statistics, 2012. CA Cancer J Clin. 2012;62:10-29
2. SEER Cancer Statistics Review, 1975-2009; National Cancer Institute, Bethesda, MD. Howlader N, Noone AM, Krapcho M, et al. http://seer.cancer.gov/csr/1975_2009_pops09/
3. Nguyen DX, Bos PD, Massague J. Metastasis: from dissemination to organ-specific colonization. Nat Rev Cancer. 2009;9:274-84
4. Esquela-Kerscher A, Slack FJ. Oncomirs - microRNAs with a role in cancer. Nat Rev Cancer. 2006;6:259-69
5. Hurst DR, Edmonds MD, Welch DR. Metastamir: the field of metastasis-regulatory microRNA is spreading. Cancer Res. 2009;69:7495-8
6. White NM, Fatoohi E, Metias M, Jung K, Stephan C, Yousef GM. Metastamirs: a stepping stone towards improved cancer management. Nat Rev Clin Oncol. 2011;8:75-84
7. Filipowicz W, Bhattacharyya SN, Sonenberg N. Mechanisms of post-transcriptional regulation by microRNAs: are the answers in sight? Nat Rev Genet. 2008;9:102-14
8. Lu J, Getz G, Miska EA, Alvarez-Saavedra E, Lamb J, Peck D. et al. MicroRNA expression profiles classify human cancers. Nature. 2005;435:834-8
9. Iorio MV, Ferracin M, Liu CG, Veronese A, Spizzo R, Sabbioni S. et al. MicroRNA gene expression deregulation in human breast cancer. Cancer Res. 2005;65:7065-70
10. Volinia S, Calin GA, Liu CG, Ambs S, Cimmino A, Petrocca F. et al. A microRNA expression signature of human solid tumors defines cancer gene targets. Proc Natl Acad Sci U S A. 2006;103:2257-61
11. Schaefer A, Jung M, Mollenkopf HJ, Wagner I, Stephan C, Jentzmik F. et al. Diagnostic and prognostic implications of microRNA profiling in prostate carcinoma. Int J Cancer. 2010;126:1166-76
12. Schaefer A, Stephan C, Busch J, Yousef GM, Jung K. Diagnostic, prognostic and therapeutic implications of microRNAs in urologic tumors. Nat Rev Urol. 2010;7:286-97
13. Fendler A, Stephan C, Yousef GM, Jung K. MicroRNAs as regulators of signal transduction in urological tumors. Clin Chem. 2011;57:954-68
14. Gottardo F, Liu CG, Ferracin M, Calin GA, Fassan M, Bassi P. et al. Micro-RNA profiling in kidney and bladder cancers. Urol Oncol. 2007;25:387-92
15. Nakada C, Matsuura K, Tsukamoto Y, Tanigawa M, Yoshimoto T, Narimatsu T. et al. Genome-wide microRNA expression profiling in renal cell carcinoma: significant down-regulation of miR-141 and miR-200c. J Pathol. 2008;216:418-27
16. Petillo D, Kort EJ, Anema J, Furge KA, Yang XJ, Teh BT. MicroRNA profiling of human kidney cancer subtypes. Int J Oncol. 2009;35:109-14
17. Jung M, Mollenkopf HJ, Grimm C, Wagner I, Albrecht M, Waller T. et al. MicroRNA profiling of clear cell renal cell cancer identifies a robust signature to define renal malignancy. J Cell Mol Med. 2009;13:3918-28
18. Juan D, Alexe G, Antes T, Liu H, Madabhushi A, Delisi C. et al. Identification of a microRNA panel for clear-cell kidney cancer. Urology. 2010;75:835-41
19. Slaby O, Jancovicova J, Lakomy R, Svoboda M, Poprach A, Fabian P. et al. Expression of miRNA-106b in conventional renal cell carcinoma is a potential marker for prediction of early metastasis after nephrectomy. J Exp Clin Cancer Res. 2010;29:90
20. Heinzelmann J, Henning B, Sanjmyatav J, Posorski N, Steiner T, Wunderlich H. et al. Specific miRNA signatures are associated with metastasis and poor prognosis in clear cell renal cell carcinoma. World J Urol. 2011;29:367-73
21. White NM, Khella HW, Grigull J, Adzovic S, Youssef YM, Honey RJ. et al. miRNA profiling in metastatic renal cell carcinoma reveals a tumour-suppressor effect for miR-215. Br J Cancer. 2011;105:1741-9
22. Khella HW, White NM, Faragalla H, Gabril M, Boazak M, Dorian D. et al. Exploring the role of miRNAs in renal cell carcinoma progression and metastasis through bioinformatic and experimental analyses. Tumour Biol. 2012;33:131-40
23. Slaby O, Redova M, Poprach A, Nekvindova J, Iliev R, Radova L. et al. Identification of MicroRNAs associated with early relapse after nephrectomy in renal cell carcinoma patients. Genes Chromosomes Cancer. 2012;51:707-16
24. Wotschofsky Z, Meyer HA, Jung M, Fendler A, Wagner I, Stephan C. et al. Reference genes for the relative quantification of microRNAs in renal cell carcinomas and their metastases. Anal Biochem. 2011;417:233-41
25. Xiao F, Zuo Z, Cai G, Kang S, Gao X, Li T. miRecords: an integrated resource for microRNA-target interactions. Nucleic Acids Res. 2009;37:D105-D110
26. Anders G, Mackowiak SD, Jens M, Maaskola J, Kuntzagk A, Rajewsky N. et al. doRiNA: a database of RNA interactions in post-transcriptional regulation. Nucleic Acids Res. 2012;40:D180-D186
27. Papadopoulos GL, Alexiou P, Maragkakis M, Reczko M, Hatzigeorgiou AG. DIANA-mirPath: Integrating human and mouse microRNAs in pathways. Bioinformatics. 2009;25:1991-3
28. Saito Y, Liang G, Egger G, Friedman JM, Chuang JC, Coetzee GA. et al. Specific activation of microRNA-127 with downregulation of the proto-oncogene BCL6 by chromatin-modifying drugs in human cancer cells. Cancer Cell. 2006;9:435-43
29. Chow TF, Mankaruos M, Scorilas A, Youssef Y, Girgis A, Mossad S. et al. The miR-17-92 cluster is over expressed in and has an oncogenic effect on renal cell carcinoma. J Urol. 2010;183:743-51
30. Chow TF, Youssef YM, Lianidou E, Romaschin AD, Honey RJ, Stewart R. et al. Differential expression profiling of microRNAs and their potential involvement in renal cell carcinoma pathogenesis. Clin Biochem. 2010;43:150-8
31. Liu H, Brannon AR, Reddy AR, Alexe G, Seiler MW, Arreola A. et al. Identifying mRNA targets of microRNA dysregulated in cancer: with application to clear cell renal cell carcinoma. BMC Syst Biol. 2010;4:51
32. Ma L, Teruya-Feldstein J, Weinberg RA. Tumour invasion and metastasis initiated by microRNA-10b in breast cancer. Nature. 2007;449:682-8
33. Chekulaeva M, Filipowicz W. Mechanisms of miRNA-mediated post-transcriptional regulation in animal cells. Curr Opin Cell Biol. 2009;21:452-60
34. Lujambio A, Lowe SW. The microcosmos of cancer. Nature. 2012;482:347-55
35. Sassen S, Miska EA, Caldas C. MicroRNA: implications for cancer. Virchows Arch. 2008;452:1-10
36. Hanahan D, Weinberg RA. Hallmarks of cancer: the next generation. Cell. 2011;144:646-74
37. Iorio MV, Croce CM. Causes and consequences of microRNA dysregulation. Cancer J. 2012;18:215-22
38. Calin GA, Sevignani C, Dumitru CD, Hyslop T, Noch E, Yendamuri S. et al. Human microRNA genes are frequently located at fragile sites and genomic regions involved in cancers. Proc Natl Acad Sci U S A. 2004;101:2999-3004
39. Liep J, Rabien A, Jung K. Feedback networks between microRNAs and epigenetic modifications in urological tumors. Epigenetics. 2012;7:315-25
40. Lopez-Lago MA, Thodima VJ, Guttapalli A, Chan T, Heguy A, Molina AM. et al. Genomic deregulation during metastasis of renal cell carcinoma implements a myofibroblast-like program of gene expression. Cancer Res. 2010;70:9682-92
41. Liu M, Tang Q, Qiu M, Lang N, Li M, Zheng Y. et al. miR-21 targets the tumor suppressor RhoB and regulates proliferation, invasion and apoptosis in colorectal cancer cells. FEBS Lett. 2011;585:2998-3005
42. Zhang A, Liu Y, Shen Y, Xu Y, Li X. miR-21 modulates cell apoptosis by targeting multiple genes in renal cell carcinoma. Urology. 2011;78:474-9
43. Zaman MS, Shahryari V, Deng G, Thamminana S, Saini S, Majid S. et al. Up-regulation of microRNA-21 correlates with lower kidney cancer survival. PLoS One. 2012;7:e31060
44. Akunuru S, Palumbo J, Zhai QJ, Zheng Y. Rac1 targeting suppresses human non-small cell lung adenocarcinoma cancer stem cell activity. PLoS One. 2011;6:e16951
45. Lichner Z, Mejia-Guerrero S, Ignacak M, Krizova A, Bao TT, Girgis AH. et al. Pleiotropic action of renal cell carcinoma-dysregulated miRNAs on hypoxia-related signaling pathways. Am J Pathol. 2012;180:1675-87
Author contact
![]() Corresponding author: Dr. Klaus Jung, Email: klaus.jungde.
Corresponding author: Dr. Klaus Jung, Email: klaus.jungde.