10
Impact Factor
ISSN: 1449-2288
Int J Biol Sci 2013; 9(1):108-118. doi:10.7150/ijbs.5306 This issue Cite
Research Paper
Fatty Acid and Transcriptome Profiling of Longissimus Dorsi Muscles between Pig Breeds Differing in Meat Quality
1. College of Animal Science, South China Agricultural University, Guangdong province, Guangzhou 510642, China.
2. Dongguan Institute of Animal Science, Guangdong province, Dongguan 523086, China.
3. College of Life Science, Xiamen University, Fujian province, Xiamen, 361005, China.
* These authors contributed equally to this work.
Received 2012-9-28; Accepted 2012-12-24; Published 2013-1-7
Abstract
Fat and lean pig breeds show obvious differences in meat quality characteristics including the fatty acid composition of muscle. However, the molecular mechanism underlying these phenotypes differences remains unknown. This study compared meat quality traits between Lantang (a Chinese indigenous breed) and Landrace (a typical lean breed). The Lantang pigs showed higher L* values and intramuscular fat content, lower pH45min, pH24h and shear force in longissimus dorsi (LD) muscle than Landrace (P < 0.05). Fatty acid analysis demonstrated the lower monounsaturated fatty acids (MUFA) and higher polyunsaturated fatty acids (PUFA) percentage in Lantang LD than that in Landrace LD (P < 0.05). To further identify candidate genes for fatty acid composition, the transcriptome of LD muscle from the two breeds were measured by microarrays. There were 586 transcripts differentially expressed, of which 267 transcripts were highly expressed in Lantang pigs. After the validation by real-time quantitative PCR, 13 genes were determined as candidate genes for fatty acid composition of muscle, including Stearoyl-CoA desaturase (SCD). Then, a SCD over-expression plasmid was transfected into C2C12 cells to reveal the effect of SCD on the fatty acid composition in vitro. The results showed that SCD over-expression significantly increased PUFA proportion, while reduced that of saturated fatty acids (SFA) in C2C12 cells (P < 0.05). In summary, this study compared the differences of fatty acid composition and transcriptome in two breeds differing in meat quality, and further identified the novel role of SCD in the regulation of PUFA deposition.
Keywords: Lantang pigs, Landrace, Longissimus dorsi, Fatty acid composition, Microarray, SCD
Introduction
For a long time, there is an increasing interest in improving meat quality for producers and consumers. Fatty acid composition plays an important role in meat quality, not only in the flavor quality, but also in the nutritional value of meat. Fatty acids, especially polyunsaturated fatty acids (PUFA), are major flavor precursors of meat. Cameron et al. showed that C18: 2, C20: 4 and C22: 6 polyunsaturated fatty acids were a positive correlation with flavor of meat [1]. Furthermore, the amount and composition of fatty acids in the food are also associated with human health. In developed countries, the percentage and total amount of saturated fatty acids (SFA) have been identified as dietary risk factors [2], which may related to various cancers and especially coronary heart disease. However, an appropriate amount of dietary intake of C20:5n-3 (eicosapentaenoic acid, EPA) and C22:6n-3 (docosahexaenoic acid, DHA) has shown a reduced risk of cardio-vascular diseases [3]. PUFA are required for the normal composition of sperm, retina and brain lipids and for the optimal maturation of visual and cortical function in preterm infants [4]. Therefore, increasing PUFA content and reducing SFA content of meat has become a tendency of meat quality improvement.
Fatty acid composition is influenced by genetic factors including breed differences. It was reported that intramuscular fat of Duroc pigs had higher concentrations of SFA and MUFA and lower concentrations of PUFA than Landrace [5]. Similarly, Zhang et al. analyzed fatty acid composition in longissimus dorsi (LD) muscle from eight different breed purebred pigs, and found that Duroc pigs had the greatest content of total SFA, Poland China pigs had a greater MUFA content than other breeds except the Spotted, and PUFA contents were greater in Hampshire, Landrace and Yorkshire pigs compared with those of other breeds [6]. Some genes and enzymes about fatty acid metabolism have been reported to be involved in fatty acid profiles regulation. For example, stearoyl-CoA desaturase (SCD) catalyzes the △9-cis desaturation of SFA, preferring palmitoyl-CoA (C16:0) and stearoyl-CoA (C18:0) as substrates and producing palmitoleoyl-CoA (C16:1) and oleoyl-CoA (C18:1), respectively [7]. Elongation of long-chain fatty acids family member 6 (Elovl6) catalyzes the elongation of saturated and monounsaturated fatty acids with 12, 14, and 16 carbons [8, 9]. In addition, some fatty acid transport proteins, such as fatty acid transport protein-1 (FATP-1), fatty acid translocase (FAT) and caveolin-1, are required for transmembrane transport of exogenous long-chain fatty acids, which therefore affect fatty acid composition. Although there are many genes have been revealed to be associated with the fatty acid composition, the identification of the potential major genes or novel function genes for fatty acid profiles still needed by means of a high-throughput screening methods.
Thus, the objective of this study was to evaluate the meat quality and fatty acid composition of Lantang pigs (a Chinese indigenous pig breed) and Landrace (a typical lean pig breed), then to identify candidate genes for fatty acid composition by microarrays and quantitative real-time PCR. Finally, over-expression of SCD gene in C2C12 myoblasts was conducted to determine the novel role of SCD in PUFA deposition.
Materials and methods
Animals and muscle sampling
A Chinese indigenous pig breed Lantang and a typical lean pig breed Landrace were studied. Animals were fed the same commercial feed (60% Corn, 18% soybean meal, 18% wheat bran and 4% premix). Ten pigs per breed, half barrows and half gilts, were chosen at their marketed weight (103 ± 3 kg, Lantang pigs at 9 months of age, Landrace at 6 months of age). Animals were slaughtered in an experimental slaughterhouse, located far away from the farm, using captive bolt stunning followed by exsanguination. The facilities of the slaughterhouse met the requirements of the Institute of Animal Care and Use Committee.
The left side of the carcass was used to measure meat quality parameters. The samples were removed from the longissimus dorsi (LD) muscle after slaughter, placed in vacuum bags, and frozen for meat quality analysis. LD muscle samples for RNA extraction were immediately frozen in liquid nitrogen, and stored at -80°C. Samples for intramuscular fat content (IMF) and fatty acid composition determination were stored in -80°C until analysis.
Meat quality parameters
Muscle pH was measured in the LD muscle at the 3rd/4th last rib with a DELTA-320 portable pH-meter at 45 min (pH 45min) and 24 h (pH 24h) post-mortem (p.m.). The part of LD muscle above the last rib was sliced, exposed to the air for 2 h after p.m. and meat color measured on the cut surface using a chromameter (Minolta CR-300; Osaka, Japan) with CIE lab color system: L* (lightness), a* (redness) and b* (yellowness). Drip loss was measured using the hanging bag method [10] and calculated as the percentage of weight lost over the 24 h period.
While still frozen, each LD (3rd/4th last rib level) fillet was cooked to a final internal temperature of 70 °C. After cooked, the samples were cooled to 25 °C prior to ten 1.3 cm cores being removed parallel to the orientation of the muscle fibers. Warner-Bratzler shear force (WBSF) values were determined by an Instron universal testing machine (Model 1122, Instron Corporation, Norwood, MA) for each core and averaged for each sample.
Intramuscular fat content and fatty acid composition analysis
Intramuscular fat content, as a percentage of fresh tissue was determined by gravimetric analysis according to the method of Yang [11], using a 25 g-sample of the LD muscle.
Total lipids were extracted from LD muscle samples with chloroform/methanol (2:1) [12]. Fatty acid methyl esters were prepared following the direct method of O'Fallon et al. [13] and analysed by gas chromatography mass spectrometry (TRACE GC-2000 GS-MSTM, Thermo Finnigan) on a DB5 capillary column (30m×0.25mm). The amount of each fatty acid was calculated as peak area percentage of total fatty acids.
Microarray assay
The total RNA of LD muscle samples was extracted by a TRIzol reagent (Invitrogen, Carlsbad, CA, USA) according to the manufacturer's protocol. The biotinylated cRNA targets were prepared as described by Zhou et al. [14] and gene expression profiling was performed on the GeneChip® Porcine Genome Array (Affymetrix) from CapitalBio Corporation (Beijing, China). This array contains a total of 23,937 probe sets that interrogate approximately 23,256 transcripts from 20,201 Sus scrofa genes. Microarrays were scanned with Scanner 3000 using Operating Software Version 1.4 (Affymetrix, Santa Clara, CA, USA). The criterion on detection of differentially expressed genes was no less than two fold changed in expression level. Gene ontology (GO) terms and Kyoto Encyclopedia of Genes and Genomes (KEGG) pathways were analyzed by a Molecule Annotation System (MAS 3.0, http://bioinfo.capitalbio.com/mas3/) combined with NCBI BLAST (http://blast.ncbi.nlm.nih.gov/Blast.cgi).
Quantitative PCR (Q-PCR)
Total RNA was isolated from LD muscle of pigs as described above and reverse transcribed to cDNA using murine Moloney leukemia virus reverse transcriptase (MMLV, Promega, Madison, WI, USA) and random primer N10 (N=A, T, C or G). Q-PCR was performed with SYBR Green Mix reagents (Toyobo) on the Stratagene Mx3005p PCR instrument. The primer sequences were listed in Table 1. GAPDH (glyceraldehydes-3-phosphate dehydrogenase) and β-actin are used as candidate housekeeping genes. The PCR conditions were 95°C for 1 min, 35 cycles of denaturation at 95°C for 15 s, annealing at 60°C for 15 s and extension at 72°C for 40 s. Relative gene expression for each gene was calculated using the formula described in previous report: R0,T/R0,R= (1+ER)Ct,R/(1+ET)Ct,T [15].
Primers of genes selected for quantitative PCR confirmation.
| Gene symbol | GenBank No. | Primer sequence (5′- 3′) | Product size (bp) |
|---|---|---|---|
| SCD | NM_213781 | F: CCCAGCCGTCAAAGAGAA | 200 |
| R: CGATGGCGTAACGAAGAAA | |||
| FASN | NM_001099930 | F: GCTTGTCCTGGGAAGAGTGTA | 115 |
| R: AGGAACTCGGACATAGCGG | |||
| LPIN1 | EU164847 | F: TGCTGAAAATGTGGGCTCC | 88 |
| R: AACCGACCAGTCTCCCTTGA | |||
| PGC-1α | NM_213963 | F: AGAGTATGAGAAGCGGGAGTC | 126 |
| R: CTCAGTTCTGTCCGTGTTGTG | |||
| CYP3A29 | NM_214423 | F: TGATGGATGACTAGGGATTCTG | 208 |
| R: AGTCTGTTGATACAAGTGCTGAG | |||
| ACL | EU073662 | F: GCCACTGCCGACTACATCT | 149 |
| R: TTGGGGTTGAGCAAGGTC | |||
| LPL | NM_214286 | F: TGCTGGGAATCCAAACTGAA | 156 |
| R: TCTGGCACCACTGGAACAAT | |||
| DGAT2 | BE015012 | F: ACGCTCTGCTTGGAGTGAC | 242 |
| R: GCACAAATACACGAGCCTGA | |||
| GPX1 | NM_214201 | F: GACCGACCCCAAGTTTATCAC | 122 |
| R: TCAGAAAGCGACGGCTGTAC | |||
| GADD45A | NM_001044599 | F: GGAGCCCGAAGATAGATGAC | 114 |
| R: CCTGCGTGGTTCTTTGTAAT | |||
| CACT | AK233127 | F: TAGCCAGGAACACTCACCAG | 111 |
| R: GCACATTTGCTCAGTCCACTT | |||
| APOOL | XM_001925965 | F: GCATCCATTCGCACTACAAC | 185 |
| R: ACAAAGCCTGCCAATCCT | |||
| IGF2 | NM_214438 | F: ATTGGACAGAAGCCTAAAGAAC | 102 |
| R: GGCTGAGTGGGCAGAAAT | |||
| KLF5 | CN161957 | F: AAAATGCCAAAAGGGGTCT | 257 |
| R: CAACCAATTTATGCTTTTCATG | |||
| Ssc.17312 | BX673056 | F: CAGCTCCACGCCCTTGTC | 218 |
| R: ATAAACGCCGTCAGCCATC | |||
| β-actin | DQ845171 | F: CCACGAAACTACCTTCAACTC | 131 |
| R: TGATCTCCTTCTGCATCCTGT | |||
| GAPDH | AF043486 | F: ATTCCACGGCACAGTCA | 130 |
| R: GGACTCCACGACATACTCAG |
Cell culture and differentiation
C2C12 myoblasts were cultured in Dulbecco's modified Eagle's medium (DMEM) with high glucose (GIBCO) containing 10% fetal bovine serum. The cells were incubated at 37ºC in a humidified incubator (5% CO2). To induce differentiation, cells were cultured in DMEM plus 2% horse serum after reaching 80% confluency. Media was renewed every 2 days.
Plasmid construction and transfection
A BamHI-EcoRI fragment of 1195 bp containing SCD (GenBank No. NM_213781.1) open reading frame was cloned into pcDNA3.1(+) (Invitrogen), named pcDNA-SCD. After sequence verification, the recombinant plasmid DNA was extracted using an Endo-free Plasmid Kit (Qiagen).
At 70% confluence, C2C12 cells were transfected with empty vector or pcDNA-SCD by lipofection (Lipofectamine 2000, Invitrogen) according to the manufacturer's instructions. Transfected cells were selected in growth media with 1 mg/mL G418 for ten days. The surviving colonies were isolated and separately amplified. Cell line maintenance was performed with 0.5 mg/mL G418.
Statistical Analysis
All data were statistically analysed by SPSS, version 17.0. Data was expressed as means ± standard error of the mean (SEM). Comparison of the two means was made by a 2-tail independent t-test, with P < 0.05 taken as statistically significant.
Results
Characteristics of meat quality of Landrace and Lantang pigs
Meat quality traits measured in the current experiment are presented in Table 2. The pH 24h was significantly higher (P < 0.01) in Lantang pigs than that in Landrace, but the pH 45min was lower (P < 0.05) in Lantang pigs. Drip loss measured in longissimus dorsi (LD) muscle showed no significant difference between the two breeds. However, meat from Lantang pigs had lower (P < 0.05) shear force values compared to meat from Landrace pigs. With respect to color measurements, the L* values were higher in Lantang LD muscle (48.94 vs. 45.79 in Landrace; P < 0.01) but the a* and b* values were not significantly affected by breed. Lantang pigs exhibited a higher intramuscular fat content than Landrace (P < 0.01).
Meat quality traits of longissimus dorsi muscle in different pig breeds.
| Landrace | Lantang | SEM | Sig. A | |
|---|---|---|---|---|
| pH 45min | 6.37 | 6.04 | 0.08 | * |
| pH 24h | 5.49 | 5.65 | 0.03 | ** |
| drip loss, % | 2.67 | 2.73 | 0.19 | NS |
| Shear force, N | 78.80 | 61.23 | 4.36 | * |
| L* (lightness) | 45.79 | 48.94 | 0.58 | ** |
| a* (redness) | 15.44 | 16.41 | 0.30 | NS |
| b* (yellowness) | 3.39 | 3.57 | 0.16 | NS |
| Intramuscular fat, % | 1.43 | 2.46 | 0.18 | ** |
A Significance: NS, not significant (P > 0.05); * (P < 0.05); ** (P < 0.01).
Fatty acid composition of longissimus dorsi muscle
Table 3 shows results of fatty acid composition of LD muscle between the two breeds. The proportion of C16:1, C18:1 (oleic acid) and total monounsaturated fatty acids (MUFA) was significantly lower in Lantang than that in Landrace (P < 0.01). However, the proportion of polyunsaturated fatty acids (PUFA), including C18:2 (linoleic acid), C20:2, C20:3, C20:4 (arachidonic acid) and C22:6 (docosahexaenoic acid), was significantly higher in Lantang pigs (P < 0.05). Thus, LD muscle in Lantang pigs had a higher proportion of total PUFA (P < 0.01). There was no significant difference in the proportion of total saturated fatty acids (SFA) between the two breeds.
Fatty acid composition (% of total fatty acids) in LD muscle from different pig breeds.
| Fatty acid (%) | Landrace | Lantang | SEM | Sig. A |
|---|---|---|---|---|
| C14:0 | 1.34 | 1.09 | 0.09 | NS |
| C16:0 | 26.71 | 25.28 | 0.83 | NS |
| C16:1 | 3.62 | 2.49 | 0.24 | ** |
| C17:0 | 0.39 | 0.19 | 0.03 | ** |
| C18:0 | 13.28 | 14.01 | 0.38 | NS |
| C18:1 | 31.09 | 24.13 | 1.15 | ** |
| C18:2 | 17.84 | 23.27 | 0.98 | ** |
| C18:3 | 0.15 | 0.15 | 0.01 | NS |
| C20:1 | 0.25 | 0.26 | 0.02 | NS |
| C20:2 | 0.21 | 0.31 | 0.02 | ** |
| C20:3 | 0.99 | 1.47 | 0.12 | * |
| C20:4 | 4.03 | 6.46 | 0.44 | ** |
| C22:6 | 0.11 | 0.81 | 0.05 | * |
| SFA | 41.72 | 40.65 | 0.91 | NS |
| MUFA | 34.96 | 26.89 | 1.33 | ** |
| PUFA | 23.32 | 32.46 | 1.56 | ** |
A Significance: NS, not significant (P > 0.05); * (P < 0.05); ** (P < 0.01).
B SFA: saturated fatty acids; MUFA: monounsaturated fatty acids; and PUFA: polyunsaturated fatty acids.
Identification of differentially expressed genes in longissimus dorsi muscle between Landrace and Lantang pigs
In order to screen for putative candidate genes linked to the traits differ in pig breeds, we performed a microarray assay. The transcriptome analysis indicated that 45.7% and 41.6% of the gene transcripts on the microarray were expressed (detection value: P < 0.05) in LD from Lantang and from Landrace respectively, and the remaining genes were marginal expressed (0.05 < P < 0.065) or absent (P > 0.065). After quantile normalization and statistical analyses, 586 transcripts with at least 2-fold difference were identified at the significance level (P < 0.05) between the two breeds. Compared with the expression of transcripts in Landrace LD, 289 transcripts out of 586 transcripts were up-regulated, and the other 297 transcripts were down-regulated in Lantang LD.
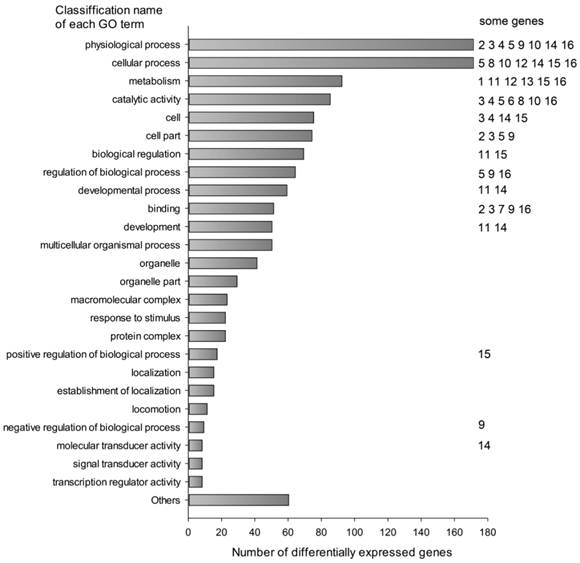
The differentially expressed transcripts were mainly classified into cellular process (171 transcripts, 13.16%), physiological process (171 transcripts, 13.16%), metabolism (92 transcripts, 7.08%), catalytic activity (85 transcripts, 6.54%), cell part (74 transcripts, 5.70%) and others by Gene Ontology analysis using MAS 3.0 (Fig. 1). They were involved in many functions and several genes might affect the fatty acid composition of muscle (Table 4).
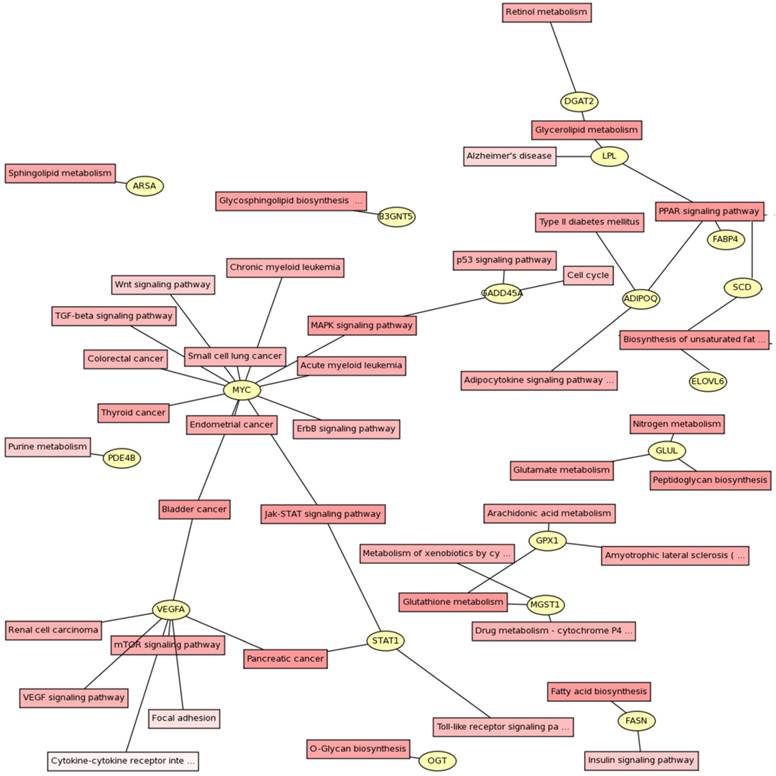
Signaling pathways were identified using KEGG pathway database (Fig. 2). The genes could be assigned into numerous subcategories including PPAR signaling pathway (ADIPOQ, FABP4, LPL and SCD), biosynthesis of unsaturated fatty acids (ELOVL6, FASN and SCD), Glycerolipid metabolism (DGAT2 and LPL), MAPK signaling pathway (GADD45A, HSP70.2 and MYC), Jak-STAT signaling pathway (MYC and STAT1), mTOR signaling pathway (VEGFA), arachidonic acid metabolism (GPX1), TGF-β and Wnt signaling pathways (MYC), and so on.
List of some differentially expressed genes in LD muscle between Lantang and Landrace pigs.
| Gene symbol | Gene description | Genbank ID | Fold change |
|---|---|---|---|
| Transcription factor | |||
| CEBPB | CCAAT/enhancer binding protein (C/EBP), beta | AF103945 | 1.95 |
| LPIN1 | lipin 1 | EU164847 | 5.39 |
| PPARGC-1 | peroxisome proliferator activated receptor gamma, coactivator 1 alpha | NM_213963 | 3.19 |
| GADD45A | growth arrest and DNA-damage-inducible, alpha | NM_001044599 | 4.81 |
| MYF6 | myogenic factor 6 | XM_001924251 | 3.13 |
| Adipocyte differentiation and function | |||
| ADIPOQ | adiponectin, C1Q and collagen domain containing | NM_214370 | 3.76 |
| KLF5 | highly similar to NM_001730.3 Kruppel-like factor 5 (Homo sapiens) | CN161957 | 5.97 |
| LOC100154721 | similar to adipose specific 2 | XM_001927304 | 2.5 |
| Fatty acid uptake and transport | |||
| LPL | Lipoprotein lipase | NM_214286 | 2.94 |
| FABP4 | fatty acid binding protein 4, adipocyte | NM_001002817 | 2.17 |
| APOOL | Similar to Apolipoprotein O-like | XM_001925965 | -3.74 |
| Fatty acid synthesis and metabolism | |||
| FASN | fatty acid synthase | NM_001099930 | 6.67 |
| SCD | stearoyl-CoA desaturase | NM_213781 | 11.83 |
| ELOVL6 | highly similar to NP_076995.1 ELOVL family member 6, elongation of long chain fatty acids | AK232419 | 3 |
| CYP3A29 | cytochrome P450 3A29 | NM_214423 | 3.11 |
| GPX1 | glutathione peroxidase 1 | NM_214201 | 2.44 |
| CACT | highly similar to NP_000378.1 solute carrier family 25 (carnitineacylcarnitine translocase), member 20 | AK233127 | -2.23 |
| Lipid metabolism | |||
| ANXA1 | annexin A1 | XM_001925719 | 2.04 |
| CLU | clusterin | NM_213971 | 3.46 |
| ANXA2 | annexin A2 | NM_001005726 | 3.04 |
| PDE4B | phosphodiesterase 4B, cAMP-specific | NM_001130018 | 2.09 |
| Triglyceride synthesis | |||
| DGAT2 | highly similar to NP_080660.1 diacylglycerol O-acyltransferase 2 (Mus musculus) | BE015012 | 2.77 |
| Insulin sensitivity | |||
| IGF2 | Insulin-like growth factor 2 (somatomedin A) | NM_213883 | -5.51 |
| OGT | O-linked N-acetylglucosamine (GlcNAc) transferase | NM_001039748 | -2.23 |
“+” and “-” indicated the up- and down- regulated expression in Lantang vs. Landrace pigs, respectively.
Classification of differentially expressed transcripts by gene ontology annotation. Differentially expressed probes were classified using Molecule Annotation System (MAS 3.0, http://bioinfo.capitalbio.com/mas3/). Some genes were marked with numbers in the Figure: 1 ADIPOQ, 2 ANXA1, 3 ANXA2, 4 CYP3A29, 5 DGAT2, 6 ELOVL6, 7 FABP4, 8 FASN, 9 GADD45A, 10 GPX1, 11 KLF5, 12 LPIN1, 13 LPL, 14 MYF6, 15 PPARGC-1 and 16 SCD.
Gene pathway network about the differential expressed genes. The differential expressed genes and the corresponding pathways were shown in the circles and boxes, respectively.
Confirmation of differentially expressed genes by quantitative PCR
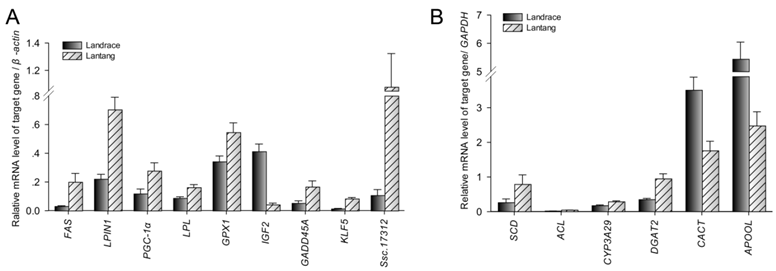
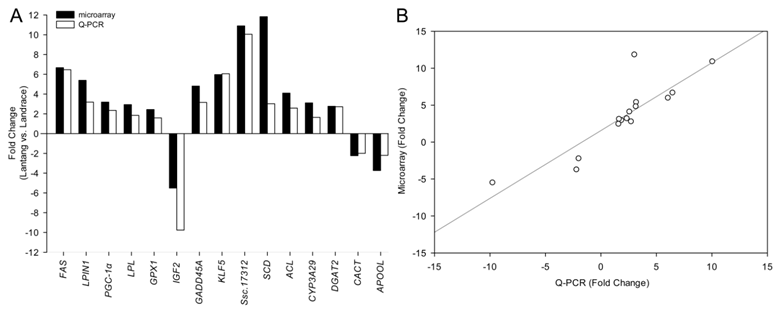
Among the differentially expressed transcripts identified by microarray, 15 genes were selected for confirmation by quantitative PCR (Q-PCR). These genes included three down-regulated genes (IGF2, CACT and APOOL) and twelve up-regulated genes (FAS, LPIN1, PGC-1α, LPL, GPX1, GADD45A, SCD, ACL, CYP3A29, DGAT2, KLF5 and Ssc.17312) in Lantang group. All the selected genes showed significant (P < 0.05) differential expression in LD between the two breeds in the Q-PCR results (Fig. 3). Remarkably, the fold changes of most genes exceeded 2-fold, except LPL, GPX1 and CYP3A29. Although the magnitude of fold change obtained by microarray and Q-PCR was different in some instances, the expression trends of these genes were similar (Fig. 4A). Further, a statistically significant positive correlation was found between microarray data and Q-PCR results (r = 0.864, P < 0.0001) using the Pearson correlation analysis. The correlation is shown in Fig. 4B.
Validation of differentially expressed genes by Q-PCR. Data were means ± SEM (n = 10). The genes were significant difference between Landrace and Lantang pigs using Q-PCR (P < 0.05).
Difference of fold change in mRNA level of each gene between microarray and Q-PCR analysis. Fold changes were calculated as mRNA levels in longissimus dorsi (LD) from Lantang, compared with those from Landrace. Bars above X-axis indicated that genes were highly expressed in Lantang LD, while those under X-axis indicated that genes were highly expressed in Landrace LD. Most of the changes of the genes were greater than 2-fold except LPL, GPX1 and CYP3A29.
SCD over-expression alters fatty acid composition in C2C12 cells
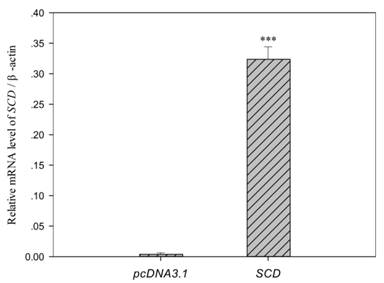
Among the differentially genes, we chose SCD as one of candidate genes for fatty acid composition. Over-expression of SCD in C2C12 myoblasts was conducted and cells were harvested after 4 days of differentiation. As shown in Fig. 5, endogenous SCD mRNA expression in C2C12 cells carrying empty vector was weak, whereas a high level of SCD mRNA was detected in cells transfected with pcDNA-SCD.
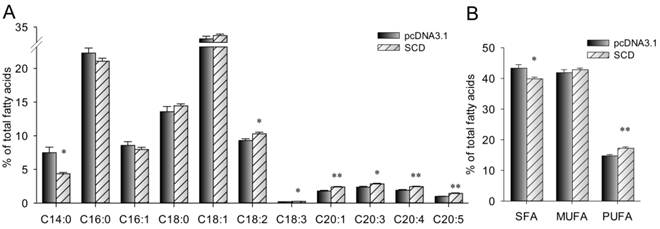
Cellar fatty acid composition was measured. As shown in Fig. 6, the proportion of C14:0 (myristic acid) and total SFA in SCD over-expression cells were significantly lower than that in control cells (P < 0.05). However, SCD over-expression cells had a higher proportion of C18:2 (linoleic acid), C18:3 (linolenic acid), C20:1, C20:3, C20:4 (arachidonic acid), C20:5 (eicosapentaenoic acid) and total PUFA.
Analysis of exogenous SCD in C2C12 cells. Cells were harvested after 4 days of differentiation. The SCD mRNA expression in cells transfected with pcDNA-SCD was 80 fold higher than cells carrying empty pcDNA3.1 vector. Data were means ± SEM (n = 6). *** (P < 0.001).
Fatty acid composition (% of total fatty acids) in C2C12 cells was altered by SCD. The bars indicate the means ± SEM for cells from 6 replicates. Statistical significance is indicated as follow: * (P < 0.05), ** (P < 0.01).
Discussion
Lantang pigs had higher intramuscular fat (IMF) content in longissimus dorsi (LD) muscle which was consistent with the results reported by Dai et al. [16]. Increased IMF content can significantly improve meat quality, especially for tenderness [17], which was confirmed by our finding that tenderness of LD muscle in Lantang pigs was better than that in Landrace pigs. Our results also showed that muscle fiber area of Lantang pigs was smaller than that of Landrace pigs (data not shown). This result supports the negative relationship between muscle fiber size and tenderness in pork [18, 19]. The pH decline and ultimate pH are two main determinants of water-holding capacity and meat color [20]. Thus, Langtang pigs with higher pH 24h and lower pH decline displayed higher L* values although their drip loss did not appear significant difference.
In the present study, the fatty acid composition in longissimus dorsi muscle between Lantang and Landrace pigs was significantly different. The results were in general agreement with other studies showing that breed affected the proportion of several fatty acids and total lipid content [5, 6]. Lantang LD muscle had a higher C18:2, C20:4 and C22:6, which were considered as flavor precursors of meat. This provides an evidence for that Chinese indigenous pigs show better pork flavor intensity [21]. On the other hand, meat of Lantang pigs is good for human health because these polyunsaturated fatty acids (PUFA) are essential to the human body, involved in many biological functions [4].
Some genes have been reported to have a role in determining fatty acid composition. In order to find as many genes as possible that may be function in the trait, our study related global gene expression profiles to muscle fatty acid composition. Affymetrix Porcine Genome Array was applied according to its sensitivity and reproducibility for swine genomic studies [22]. Although fold changes of the selected genes were not exactly same between real-time PCR assay and microarray assay, the expression tendencies were highly consistent, suggesting that the data from microarray assay in our study was reliable.
Among the differentially expressed genes, 13 genes were identified as candidate genes for fatty acid composition, due to their functional/pathway annotations. FAS, SCD and ELOVL2 are key enzymes of fatty acid biosynthesis, which were highly expressed in Lantang LD muscle with higher PUFA proportion; CYP3A29, GPX1 and CACT take part in fatty acid metabolism; LPL, CD36 (data not shown) and APOOL play a role in fatty acid transport; KLF5 is a key regulator of adipocyte differentiation. DGAT2 is a diacylgycerol acyltransferase gene which catalyzes the final step in the production of triacylglycerol. It has been reported that fatty acid composition was altered in yeast strains lacking DGAT2 enzyme [23]. In our study, DGAT2 was found to be highly expressed in Lantang LD muscle. Further analysis indicated that positive correlation occurred between DGAT2 mRNA level and muscle PUFA proportion (data not shown).
PGC-1α (peroxisome proliferator-activated receptor-γ coactivator 1α) exerts strong effects on many aspects of mitochondrial energy metabolism [24], which can determine muscle fatty acid composition. It was reported that PGC-1α coactivated PPARα, a key regulator of genes involved in mitochondrial fatty acid oxidation [24]. Moreover, PGC-1α was involved in the activation of the L-CPT I gene, which was considered the rate-controlling enzyme in fatty acid oxidation [25]. LPIN1, identified in 2001 [26], was strongly correlated with body fat accumulation. Two lipin-1 protein isoforms are generated by alternative mRNA splicing of the LPIN1 gene. One has a function as phosphatidate phosphatase enzymes in triglyceride and phospholipid biosynthesis, and the other is an inducible transcriptional coactivator during adipogenesis and lipid metabolism. Interestingly, lipin1 activates mitochondrial fatty acid oxidative metabolism by inducing PGC-1α target pathway [27]. In this study, LPIN1 and PGC-1α mRNA levels were positively correlated, and they were all correlated with muscle PUFA proportion (data not shown).
Stearoyl-CoA desaturase (SCD) is a microsomal enzyme that catalyzes the synthesis of monounsaturated fatty acids from saturated fatty acyl-CoAs. The preferred substrates for SCD are palmitoyl- and stearoyl-CoA, which are converted to palmitoleoyl- and oleoyl-CoA, respectively [28, 29]. This function could directly affect fatty acid composition in muscle. However, the impact of SCD gene in fatty acid is not unique and the monounsaturated fatty acids are just intermediate products. In the present study, over-expression of SCD gene increased the proportion of C18:2, C18:3, C20:1, C20:3, C20:4 and total PUFA, and reduced that of C14:0 and total saturated fatty acids (SFA) in C2C12 cells. These results suggested that SCD might have other ways to affect fatty acid composition besides being a desaturase enzyme. It was reported that high expression and activity of SCD1 corresponded with low rates of fatty acid oxidation [30]. SCD1-deficient mice had increased energy expenditure and up-regulated expression of several genes encoding enzymes of fatty acid β-oxidation [31]. On the other hand, fatty acid metabolism could influence cellular fatty acid uptake although the mechanism is not known [32]. Therefore, improving the proportion of PUFA may be due to changes in fatty acid metabolism or uptake by SCD over-expression. In addition, SCD may regulate other fatty acid desaturases or elongases required by PUFA synthesis to determine muscle fatty acid composition, but this will need further confirmation.
Acknowledgements
This work was supported by the National Basic Research Program of China (2009CB941601); National Basic Research Program of China (2012CB124701); the Joint Funds of the National Natural Science Foundation of China (u0731004); Talent Project of Guangdong Colleges. We also appreciate and gratefully acknowledge the Breed Pig Farm of Banling for their help in animals supply.
Competing Interests
The authors have declared that no competing interest exists.
References
1. Cameron ND, Enser M, Nute GR. et al. Genotype with nutrition interaction on fatty acid composition of intramuscular fat and the relationship with flavour of pig meat. Meat Sci. 2000;55:187-195
2. Pascual JV, Rafecas M, Canela MA. et al. Effect of increasing amounts of a linoleic-rich dietary fat on the fat composition of four pig breeds. Part II: Fatty acid composition in muscle and fat tissues. Food Chem. 2007;100:1639-1648
3. Gebauer SK, Psota TL, Harris WS. et al. n-3 Fatty acid dietary recommendations and food sources to achieve essentiality and cardiovascular benefits. Am J Clin Nutr. 2006;83:S1526-S1535
4. Tapiero H, Nguyen Ba G, Couvreur P. et al. Polyunsaturated fatty acids (PUFA) and eicosanoids in human health and pathologies. Biomed Pharmacother. 2002;56:215-222
5. Cameron ND, Enser MB. Fatty acid composition of lipid in Longissimus dorsi muscle of Duroc and British Landrace pigs and its relationship with eating quality. Meat Sci. 1991;29:295-307
6. Zhang S, Knight TJ, Stalder KJ. et al. Effects of breed, sex, and halothane genotype on fatty acid composition of pork longissimus muscle. J Anim Sci. 2007;85:583-591
7. Ntambi JM, Miyazaki M. Regulation of stearoyl-CoA desaturases and role in metabolism. Prog Lipid Res. 2004;43:91-104
8. Moon Y-A, Shah NA, Mohapatra S. et al. Identification of a Mammalian Long Chain Fatty Acyl Elongase Regulated by Sterol Regulatory Element-binding Proteins. J Biol Chem. 2001;276:45358-45366
9. Matsuzaka T, Shimano H, Yahagi N. et al. Cloning and characterization of a mammalian fatty acyl-CoA elongase as a lipogenic enzyme regulated by SREBPs. J Lipid Res. 2002;43:911-920
10. Honikel KO. Reference methods for the assessment of physical characteristics of meat. Meat Sci. 1998;49:447-457
11. Yang G. Pig Production. Beijing, China: Chinese Agricultural Press. 2003
12. Folch J, Lees M, Sloane-Stanley G. A simple method for the isolation and purification of total lipids from animal tissues. J Biol Chem. 1957;226:497-509
13. O'Fallon JV, Busboom JR, Nelson ML. et al. A direct method for fatty acid methyl ester (FAME) synthesis: Application to wet meat tissues, oils and feedstuffs. J Anim Sci. 2007;85:1511-1521
14. Zhou G, Wang S, Wang Z. et al. Global comparison of gene expression profiles between intramuscular and subcutaneous adipocytes of neonatal landrace pig using microarray. Meat Sci. 2010;86:440-450
15. Liu W, Saint DA. A New Quantitative Method of Real Time Reverse Transcription Polymerase Chain Reaction Assay Based on Simulation of Polymerase Chain Reaction Kinetics. Anal Biochem. 2002;302:52-59
16. Dai F, Feng D, Cao Q. et al. Developmental differences in carcass, meat quality and muscle fibre characteristics between the Landrace and a Chinese native pig. S Afr J Anim Sci. 2010;39:267-273
17. Van Laack R, Stevens S, Stalder K. The influence of ultimate pH and intramuscular fat content on pork tenderness and tenderization. J Anim Sci. 2001;79:392-397
18. Ryu YC, Kim BC. The relationship between muscle fiber characteristics, postmortem metabolic rate, and meat quality of pig longissimus dorsi muscle. Meat Sci. 2005;71:351-357
19. Gondret F, Lefaucheur L, Juin H. et al. Low birth weight is associated with enlarged muscle fiber area and impaired meat tenderness of the longissimus muscle in pigs. J Anim Sci. 2006;84:93-103
20. Offer G, Knight P. The structural basis of water-holding in meat. Part 2: Drip losses. In: (ed.) Lawrie R, Developments in Meat Science 4. London: Elsevier Applied Science. 1988;4:173-241
21. Lu P, Li D, Yin J. et al. Flavour differences of cooked longissimus muscle from Chinese indigenous pig breeds and hybrid pig breed (Duroc×Landrace×Large White). Food Chem. 2008;107:1529-1537
22. Tsai S, Mir B, Martin AC. et al. Detection of transcriptional difference of porcine imprinted genes using different microarray platforms. BMC genomics. 2006;7:328
23. Sandager L, Gustavsson MH, Ståhl U. et al. Storage Lipid Synthesis Is Non-essential in Yeast. J Biol Chem. 2002;277:6478-6482
24. Finck BN, Kelly DP. PGC-1 coactivators: inducible regulators of energy metabolism in health and disease. J Clin Invest. 2006;116:615-622
25. Louet JF, Hayhurst G, Gonzalez FJ. et al. The coactivator PGC-1 is involved in the regulation of the liver carnitine palmitoyltransferase I gene expression by cAMP in combination with HNF4 alpha and cAMP-response element-binding protein (CREB). J Biol Chem. 2002;277:37991-38000
26. Péterfy M, Phan J, Xu P. et al. Lipodystrophy in the fld mouse results from mutation of a new gene encoding a nuclear protein, lipin. Nat Genet. 2001;27:121-124
27. Finck BN, Gropler MC, Chen Z. et al. Lipin 1 is an inducible amplifier of the hepatic PGC-1[alpha]/PPAR[alpha] regulatory pathway. Cell Metab. 2006;4:199-210
28. Enoch HG, Catalá A, Strittmatter P. Mechanism of rat liver microsomal stearyl-CoA desaturase. Studies of the substrate specificity, enzyme-substrate interactions, and the function of lipid. J Biol Chem. 1976;251:5095-5103
29. Prasad MR, Joshi VC. Purification and properties of hen liver microsomal terminal enzyme involved in stearoyl coenzyme A desaturation and its quantitation in neonatal chicks. J Biol Chem. 1979;254:6362-6368
30. Hulver MW, Berggren JR, Carper MJ. et al. Elevated stearoyl-CoA desaturase-1 expression in skeletal muscle contributes to abnormal fatty acid partitioning in obese humans. Cell Metab. 2005;2:251-261
31. Dobrzyn P, Dobrzyn A, Miyazaki M. et al. Stearoyl-CoA desaturase 1 deficiency increases fatty acid oxidation by activating AMP-activated protein kinase in liver. PNAS. 2004;101:6409-6414
32. Mashek DG, Coleman RA. Cellular fatty acid uptake: the contribution of metabolism. Curr Opin Lipidol. 2006;17:274-278
Author contact
![]() Corresponding author: Email: qyjiangedu.cn (Qingyan Jiang); yuanliedu.cn (Li Yuan). Tel & Fax: +86-20-85284901.
Corresponding author: Email: qyjiangedu.cn (Qingyan Jiang); yuanliedu.cn (Li Yuan). Tel & Fax: +86-20-85284901.

 Global reach, higher impact