Impact Factor ISSN: 1449-2288

 Global reach, higher impact
Int J Biol Sci 2013; 9(4):343-349. doi:10.7150/ijbs.5501 This issue Cite
Research Paper
Endosulfan-Induced Biomarkers in Japanese Rice Fish (Oryzias latipes) Analyzed by SELDI-TOF-MS
Sung-Eun Lee1,*, Choi Young-Woong2,*, Hyoung-ho Mo2, Jino Son2, Kyeonghun Park3, Kijong Cho2, ![]()
1. School of Applied Biosciences, Kyungpook National University, Daegu 702-701, South Korea;
2. Division of Environmental Sciences and Ecological Engineering, College of Life Sciences and Biotechnology, Korea University, Seoul 136-701, Korea;
3. Division of Pesticide Safety Evaluation, Department of Crop Life Safety, National Academy of Agriculture Science, Suwon 441-707, South Korea.
* Authors equally contributed to this work.
Received 2012-11-7; Accepted 2013-3-15; Published 2013-4-13
Abstract
The objective of this study was to find and validate estrogen-related biomarkers from plasma proteins in Oryzias latipes after exposure to an estrogen disrupting compound, α-endosulfan. The acute toxicity of α-endosulfan on O. latipes after 96 h of exposure was 13.72, 16.18, and 22.18 μg L-1 for the LC10, LC20, and LC50 values, respectively. To confirm estrogenic disturbance by α-endosulfan, the expression level of vitellogenin in the liver of male fishes was measured at the LC10 value, and it was found to be significantly different from the reference group, confirming the estrogenic effect of endosulfan in this concentration range. Proteinchip® array techniques using a weak cation exchange (CM10) and a strong anion exchange proteinchip (Q10) in conjunction with surface-enhanced laser desorption/ionization time of flight mass spectrometry (SELDI-TOF-MS) were used to determine plasma proteins of O. latipes differently expressed in response to endosulfan exposure at LC10 and LC20 concentrations. Analysis of protein profiling of the male fish exposed to α-endosulfan detected 48 significantly different protein peaks and the proteins at m/z 2819, 8462, 8860, and 9462 were significantly different (p<0.05). The protein peaks at m/z 2819, 8860, and 9462 were up-regulated and the peak at m/z 8462 was down-regulated. Therefore, these four differentially expressed proteins could be used as biomarkers to rapidly determine a possible risk of endosulfan on aquatic ecosystems, although these are not necessarily produced as a result of endocrine disruption.
Keywords: Oryzias latipes, α-endosulfan, SELDI-TOF-MS, vitellogenin, biomarkers.
Introduction
Organochlorine insecticides have strong insecticidal properties and broad applications due to their low cost of large scale production. However, some organochlorine pesticides have been banned due to their persistent residual characteristics and unexpected toxicities to non-target organisms in the environment [1-3]. While much less persistent than other organochlorines, endosulfan is known to be neurotoxic and highly toxic to fish [4-5]. In addition, this compound at the concentration of 1 μg L-1 has been shown to be genotoxic to fish, affecting reproduction [6]. Endosulfan is one of 123 pesticides that have been listed as potential endocrine disruptors [7].
Even though endosulfan is highly toxic to aquatic life, it is still being used in many countries. In Korea, endosulfan has been excluded from the list of insecticide for food crops, except for the control of insect pests for mulberry tree and tobacco. This may increase the chances that Korean soils will be contaminated by endosulfan [8]. Interestingly, several reports have examined the occurrence of runoff of endosulfan into aquatic ecosystem [9]. Therefore, methods for the fast and low cost assessment of the adverse effects of endosulfan in aquatic ecosystems need to be developed.
Endosulfan can be detected and quantified by analytical methods using a gas chromatography-electron capture detector (GC-ECD) and an enzyme linked immune sorbent assay (ELISA) [10-11]. These analytical methods directly determine the amount of endosulfan in the environment or living organisms. However, its adverse effects occur in living organisms and therefore must be biologically determined, which will require the identification of biomarkers using omics techniques.
SELDI-TOF-MS has been widely used for disease biomarker discovery. Sample loss is lower than the MALDI method because protein samples can be directly loaded on a Protein Chip, and the SELDI method can be used to analyze proteins, which does not require a 2-DE procedure. A comparison of protein expression in two groups can be used to detect differences in expression levels [12]. SELDI-TOF-MS utilizes chemically derivatized arrays to chromatographically bind a subset of proteins from a biological matrix of interest, and TOF-MS to profile the bound peptides/proteins in a semi-quantitative manner [13]. SELDI has been used as a proteomic profiling method, in particular, by researchers conducting clinical/pre-clinical studies in which large number of samples are analyzed and more standard proteomic approaches (such as 2-DE or LC MS/MS) are not suitable due to their lower throughput [14]. Recently, proteomic profiling using SELDI-TOF MS has been used for the rapid determination of intact biomarker candidates in fish, especially estrogen disrupting compounds [12,15].
Herein, we examined estrogen-responsive peaks present in plasma proteins of male Orizias latipes in relation to endosulfan exposure and biomarkers were identified for determining the impact of endosulfan on Korean aquatic ecosystems at the levels of LC10 and LC20, which have been shown to cause endocrine disrupting effect. For the purpose of this study vitellogenin levels in the male fish after exposure to endosulfan were also examined by ELISA.
Materials and methods
Chemicals
Endosulfan (technical grade, 93.6% purity) used in these experiments was obtained from the Department of Agro-food safety, National Academy of Agricultural Science, Suwon, South Korea. Acetone (99.8% purity) was purchased from Merck (Whitehouse, NJ, USA). All other chemicals were used as technical grade.
Animals
The adult fish species used in this study was Oryzias latipes. Fish were obtained from the Department of Agro-food safety, National Academy of Agricultural Science, Suwon, South Korea. Fish were allowed to acclimate to dechlorinated tap water at 25±1°C, pH 7.7±0.3, and a light:dark cycle of 16:8 hours. Fish were fed daily with brine shrimp bred in the laboratory, and were starved during the experiment period.
Acute Toxicity Test
The ninety six hour fish acute toxicity test was based on the guidelines stated by the Rural Development Administration (RDA, Suwon, Korea) for standards and methods of pesticide registration and the organization for economic co-operation and development (OECD) guideline 203 for testing of chemicals [16-17]. The experiments were conducted in 6 L glass tank with 5 L of filtered water. Fish were exposed to endosulfan at nominal concentrations of 10, 15, 22.5, 33.75, 50.63 μg L-1 for 96 h under static conditions with triplicates. Solvent treated acetone control and non-treatment control were used as a reference control in this experiment. Ten (female:male, 5:5) adult fish were used for each concentration and were not fed for 96 h. Mortality and toxicity symptoms were recorded at 4, 24, 48, 72, and 96 h, respectively, and 10%, 20% and 50% lethal concentrations (LC10, LC20 and LC50) were calculated by probit analysis using POLO-PC.[18-19] The temperature, pH and photo-period were kept at 25±1°C, pH 7.7±0.3, and a light:dark cycle of 16:8 hours, respectively. The average length and weight of fish were 29.4±2.6 mm and 280±50 mg.
Biochemical analysis of endosulfan toxicity
Ten adult fish were exposed to nominal concentrations of 13.72 and 16.18 μg L-1, which corresponds to LC10 and LC20 values, respectively, per 6 L glass tank with 5 L of filtered water for 96 h under static conditions. Treatment at each concentration, including the control and solvent control, was conducted by triplicate. A total of forty male fish for each group was used. Thirty of the forty fish were used for SELDI analysis, which was performed in triplicate, and the remaining ten fish were used for the ELISA test. The temperature, pH, and photo-period were kept at 25±1°C, pH 7.7±0.3, and a light:dark cycle of 16:8 hours, respectively. The average length and weight of fish were 31.5±2.9 mm and 270±70 mg.
Determination of vitellogenin (VTG) content using ELISA
This study was conducted to examine the change of VTG concentration in fish liver. The male fish were separated and dissected to obtain livers. The Medaka VTG ELISA kit was purchased from Biosense Laboratories (Belgen, Norway). The lyophilized O. latipes VTG standard was calibrated against purified medaka VTG, quantified using amino acid analysis [20-21]. The male fish exposed to 13.72 μg L-1 of endosulfan were compared to the control. All samples were processed according to the manufacturer's instructions. The regression equation was determined to be y=0.1057 x + 0.3201 when the absorbance measurements of the VTG standard at concentrations of 0.05, 0.1, 0.2, 0.4, 0.8, 1.6, 3.2, 6.3, 12.5, and 25 ng mL-1 were used. The R square of the regression was 0.9113. Relative levels of VTG in plasma are given as mean of VTG concentration mean±S.E.M. ANOVA was used to evaluate statistical significance using SAS proc GLM [22].
SELDI-TOF MS analysis
Protein extraction
Six male fish samples were randomly collected among 30 fishes in each group. The sampling was performed in duplicate for each group. The samples were transferred into a micro tube (MCT-200-C, Axygen, USA) containing 0.5 mL phosphate buffer saline (PBS, PH 7.4; 10mM phosphate buffer, 0.8% NaCl). Then, the samples were smashed using a homogenizer (PRO 200, PRO Scientific Inc, Oxford, CT USA). The mixed samples were centrifuged at 12,000 x g for 10 min at 4°C using a high speed refrigerated centrifuge (Smart R17, Hanil, Korea). Supernatants were stored at -80°C until biochemical analysis was conducted.
Protein quantification
The total protein concentration was determined by Bradford assay [23]. Bovine serum albumin (BSA, Thermo scientific, USA) was used as a standard reference. The concentration of BSA was diluted with PBS up to 0, 0.304, 0.456, 0.608, 0.760, and 0.912 μg mL-1. Supernatants after centrifugation were diluted with PBS to make a protein sample with a 1:10 ratio (1-Supernatant, 10-PBS). Protein samples were mixed with 200 μL of the Bio-Rad protein assay reagent (Bio-Rad, Richmond, CA, USA) in a 96-well plate in triplicate. After incubation for 5 min at room temperature, the absorbance was measured at 595 nm on a micro-plate reader, PowerWaveXS manufactured by Bio-Tek (Winooski, VT, USA). The regression equation for the BSA standards was y=0.8917 x +0.3198. Protein quantity analysis was performed on samples using 50 μg of protein, which was determined based on the above regression equation.
ProteinChip arrays using SELDI-TOF analysis
Before analysis by SELDI-TOF MS, spectra calibration was conducted using the All-In-One peptide standard (Bio-Rad) (Table 1). ProteinChips of strong anion exchange (Q10) and weak cation exchange (CM10) were used for the analyses. The mass spectra of the low mass proteins and high mass proteins were measured from all groups. Normalization using the total ion current (TIC) was conducted for the amplitudes of all the peaks between 0 and 25,000 Da for the low mass proteins and between 0 and 200,000 Da for the high mass proteins using Proteinchip data manager software (Bio-Rad). The Software settings were determined using the cluster wizard. Peak detection was set at auto-detect peaks to cluster. The first pass of the signal-to-noise ratio (S/N) and valley depth was set at 3. The cluster mass window was set at 1 peak width. The second pass of the S/N and valley depth was set at 2. In the statistical analysis, the Kruskal-Wallis test of the non-parametric method was performed to compare the data of all groups. A principal component analysis (PCA) was used for log transformed data and variance-covariance matrix.
Composition of the all-in-one peptide standard for SELDI-TOF MS
| Peptide | Average MW |
|---|---|
| Vasopressin | 1,084.25 |
| Somatostatin | 1,637.90 |
| Dynorphin (porcine) | 2,147.50 |
| ACTH (1-24) (human) | 2,933.50 |
| Bovine insulin β-chain | 3,495.94 |
| Human insulin | 5,807.65 |
| Hirudin, recombinant | 6,963.52 |
Results and discussion
Acute toxicity
Results of the acute toxicity test for endosulfan on O. latipes are presented in Table 2. The LC50 value after 96 h of exposure was 22.18 μg L-1, which was the same value observed after 48 h of exposure. This value is classified as very high toxicity. In the control and solvent control groups, no mortality was observed during the test period. To profile the plasma proteins, ten fish for the LC10 group and LC20 group were exposed to 13.72 and 16.18 μg L-1 of endosulfan for 96 h in triplicate. In the control group, solvent control group, and endosulfan treatment groups, no fish had died during the test.
Median lethal concentrations (LC50) of endosulfan in Oryzias latipes after exposure for 96 hours.
| Concentration (μg L-1) | Mortality (%) | LC50 (96 hr, μg L-1) |
|---|---|---|
| 10 | 0 | 22.18 (17.66~27.76) |
| 15 | 0 | |
| 22.5 | 40 (36-44) | |
| 33.75 | 80 (74-86) | |
| 50.63 | 100 |
*Confidence Interval.
Our findings showed that endosulfan was highly toxic to O. latipes, which has also been observed for other fish species [24]. In contrast, the acute oral LD50 values for rat (Rattus norvegicus) and Mallard duck (Anas platyrhynchos) were 10 and 28 mg kg-1, respectively [5]. These values are classified as highly toxic. Also, the WHO classified endosulfan as Class II 'Moderately Hazardous' based on a rat LD50 of 80 mg kg-1[25]. Based on the combined findings of multiple studies, our study re-examined endosulfan toxicity to fish with high similarity to the results previously reported.
Since the goal of our study was to find sensitive biomarker candidates from freshwater fish, it was very important to identify an adequate concentration of endosulfan in regard to toxicity to O. latipes. To determine the appropriate treatment concentration, the following two different aspects were considered in this study; (1) Runoff concentration of endosulfan are likely not higher than LC50 and (2) the concentrations that the fish is exposed to should induce estrogenic disturbance in endosulfan-treated fishes.
Based on these considerations, the endosulfan concentrations used to identify biomarker proteins in O. latipes were LC10 and LC20, which were higher than predicted environmental concentration (PEC) (Data not shown). The fishes exposed to these two concentrations did not die within the test period. The other two groups, including the solvent-treated group and non-treated control group, showed no mortality within the test period. These findings are very similar to a previous study, which reported that the no observed effect concentration (NOEC) value of acetone for O. latipes was 14,300,000 μg L-1 at 48 h [26]. In this study, the concentration of acetone was about 100 times lower than the NOEC value (161,500 μg L-1).
Determination of estrogenicity of endosulfan by the determination of vitellogenin (VTG) protein amount
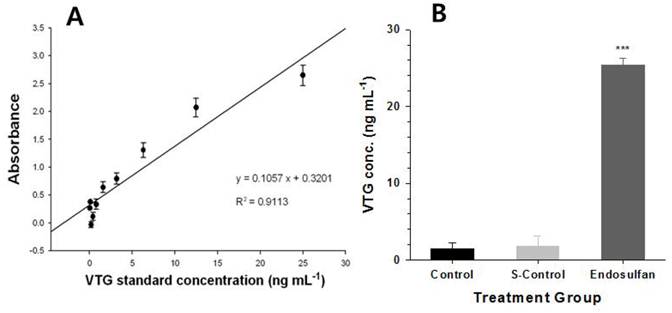
O. latipes male fish that were treated with endosulfan at a concentration of LC10 showed a significant increase in VTG proteins relative to the control and solvent-treated groups, as shown in Fig 1B. The standard curve of VTG is shown in Fig 1A as R2 = 0.9113. However, no significant differences were observed in the VTG concentration between the control and acetone-control groups (Fig. 1B). These results demonstrated that an endosulfan concentration of LC10 was sufficient to induce estrogenic disturbance.
Determination of vitellogenin (VTG) after exposing Oryzias latipes to endosulfan for 96 h. (A); Standard curve for VTG, (B); VTG levels in plasma samples of male O. latipes livers in each group: control, solvent control and endosulfan-treatment. Values are expressed as mean±S.E.M (n=4). There were significant differences (p<0.001).
VTG in oviparous vertebrates including fish, amphibians, reptiles, and birds functions as an egg yolk precursor protein, which is produced by the liver under the control of the endocrine system. The hypothalamus in the brain is stimulated by external factors, such as temperature and photo-period. These stimulants were results in the secretion of the gonadotropin-releasing hormone (GnRH), which stimulates the pituitary gland to secrete two gonad tropic hormones (GTH 1 and 2). GTH 1 and 2 cause the gonads to release 17β-estradiol (E2) and activate the synthesis of the VTG protein in the liver [27]. Endosulfan has been reported to act as a weak endocrine disruptor by interacting with the estrogen and androgen receptors and interfering with sex steroid metabolism [28]. Based on these previous findings, endosulfan likely functions as an endocrine disruptor by inducing VTG protein expression, which causes the gonads to release E2, and by interfering the estrogen-receptor interaction.
Protein profiling analyses usingSELDI - TOF - MS
As shown in Table 3 and 4, the protein peak profiling significantly varied within the two controls, as non-treated and acetone-treated control. In this study the concentration of acetone was about 1/100 of the NOEC. Therefore, the non-treated control was excluded from the comparative controls in the results.
Differentially expressed proteins in male Oryzias latipes exposed to endosulfan and solvent control using the CM10 Protein Chip.
| m/z | Intensities | p-value | ||
|---|---|---|---|---|
| Solvent Control (S.D)* | Endosulfan LC10 (S.D) | Endosulfan LC20 (S.D) | ||
| 2343 | 2.8 (0.2) | 69.7 (39.7) | 89.6 (108.1) | < 0.10 |
| 3124 | 11.6 (2.5) | 59.3 (16.1) | 51.4 (47.7) | < 0.15 |
| 3187 | 12.5 (12.2) | 185.9 (44.5) | 205.0 (193.4) | < 0.10 |
| 3318 | 28.5 (17.9) | 261.3 (106.3) | 148.5 (77.7) | < 0.10 |
| 3655 | 18.2 (10.7) | 58.6 (8.4) | 72.7 (54.7) | < 0.15 |
| 4017 | 29.7 (29.7) | 124.6 (67.3) | 98.4 (43.0) | < 0.10 |
| 4362 | 33.1 (25.0) | 32.3 (12.9) | 75.9 (40.4) | < 0.15 |
| 4767 | 9.9 (6.9) | 37.2 (16.4) | 28.8 (18.2) | < 0.10 |
| 5871 | 70.3 (14.4) | 90.2 (11.0) | 102.6 (19.3) | < 0.15 |
| 5966 | 31.1 (9.6) | 56.6 (28.7) | 50.0 (5.1) | < 0.10 |
| 6034 | 77.8 (61.8) | 221.8 (14.6) | 187.1 (58.3) | < 0.10 |
| 6086 | 34.2 (26.4) | 153.4 (43.0) | 152.0 (95.0) | < 0.10 |
| 6765 | 17.6 (12.8) | 62.2 (13.8) | 60.9 (20.0) | < 0.10 |
| 6923 | 21.6 (24.2) | 44.9 (6.3) | 81.4 (30.8) | < 0.10 |
| 7174 | 10.4 (1.0) | 12.1 (3.4) | 28.7 (18.0) | < 0.10 |
| 9083 | 10.5 (7.9) | 43.3 (6.9) | 38.2 (24.4) | < 0.15 |
| 9554 | 9.5 (2.8) | 25.2 (10.7) | 25.2 (9.6) | < 0.10 |
*Standard Deviation.
Differentially expressed proteins in male Oryzias latipes exposed to endosulfan and solvent control using the Q10 Protein Chip.
| m/z | Intensities | p-value | ||
|---|---|---|---|---|
| Solvent Control (S.D)* | Endosulfan LC10 (S.D) | Endosulfan LC20 (S.D) | ||
| 1554 | 91.9 (49.0) | 64.0 (24.7) | 131.2 (33.8) | < 0.15 |
| 1568 | 172.4 (99.8) | 126.3 (40.9) | 241.6 (32.2) | < 0.15 |
| 1875 | 32.7 (28.3) | 49.2 (33.7) | 92.2 (16.2) | < 0.15 |
| 2291 | 75.8 (48.1) | 67.4 (82.3) | 181.8 (43.3) | < 0.15 |
| 2413 | 19.1 (8.8) | 24.5 (25.4) | 71.6 (18.2) | < 0.15 |
| 2596 | 101.9 (91.4) | 114.9 (143.4) | 276.7 (61.5) | < 0.15 |
| 2819 | 65.3 (66.2) | 602.3 (182.0) | 1094.8 (115.1) | < 0.05 |
| 3024 | 21.6 (16.9) | 58.2 (30.1) | 88.0 (11.4) | < 0.10 |
| 3377 | 96.4 (81.2) | 109.4 (6.1) | 176.2 (47.1) | < 0.15 |
| 3720 | 23.3 (15.4) | 83.6 (27.6) | 96.3 (17.1) | < 0.10 |
| 3848 | 25.5 (21.9) | 102.3 (47.9) | 115.2 (28.3) | < 0.10 |
| 4234 | 60.3 (9.7) | 86.0 (34.1) | 105.1 (27.2) | < 0.15 |
| 4342 | 54.2 (7.3) | 105.9 (66.0) | 80.4 (22.8) | < 0.15 |
| 5238 | 48.8 (34.9) | 120.6 (54.0) | 144.2 (21.9) | < 0.15 |
| 5766 | 98.0 (100.8) | 166.3 (133.3) | 261.0 (68.9) | < 0.15 |
| 8462 | 93.6 (81.4) | 24.7 (2.7) | 33.6 (4.4) | < 0.05 |
| 8837 | 18.6 (4.0) | 18.3 (2.7) | 31.3 (8.7) | < 0.10 |
| 8860 | 12.1 (2.8) | 14.8 (1.3) | 33.3 (14.8) | < 0.05 |
| 8882 | 35.4 (16.8) | 43.9 (14.2) | 74.4 (12.4) | < 0.10 |
| 8948 | 30.9 (5.5) | 35.8 (15.3) | 51.5 (14.20 | < 0.15 |
| 9088 | 14.4 (3.6) | 29.3 (7.3) | 33.0 (5.4) | < 0.10 |
| 9215 | 3.0 (1.9) | 16.5 (5.7) | 19.6 (5.2) | < 0.10 |
| 9420 | 5.5 (4.1) | 14.9 (1.3) | 19.5 (7.1) | < 0.10 |
| 9462 | 1.9 (0.9) | 23.7 (8.5) | 31.9 (6.4) | < 0.05 |
| 9539 | 6.5 (3.0) | 118.4 (65.1) | 103.5 (75.6) | < 0.10 |
| 9708 | 11.6 (0.8) | 51.6 (30.3) | 41.4 (6.6) | < 0.10 |
| 10991 | 8.3 (5.2) | 9.5 (6.5) | 17.8 (5.1) | < 0.15 |
| 11823 | 4.3 (3.0) | 18.5 (8.6) | 13.6 (3.2) | < 0.10 |
| 11952 | 2.8 (1.3) | 10.6 (3.8) | 9.5 (3.0) | < 0.10 |
| 17659 | 0.7 (0.2) | 2.4 (1.4) | 3.6 (1.1) | < 0.10 |
| 24459 | 2.5 (1.9) | 0.9 (0.4) | 1.7 (0.4) | < 0.15 |
*Standard Deviation.
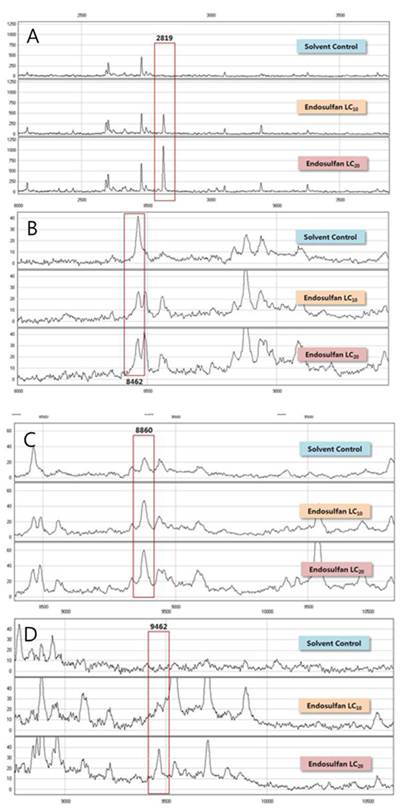
In this study, we used two different types of proteinchips, CM10 (a weak cation exchange proteinchip) and Q10 (a strong anion exchange proteinchip). Using CM10 proteinchips, 17 different protein peaks relative to endosulfan exposure were detected in the male medaka fishes and 31 peaks were observed when the Q10 proteinchip was used. All 48 different peaks had intensities with coefficient of variations (CVs) less than 30% and are summarized in Tables 3 and 4. There were 4 protein peaks that were significantly different (p<0.05) and they were at m/z 2819, 8462, 8860, and 9462 (Fig. 2) of male medaka protein peaks were identified using Q10 proteinchip. Three protein peaks at m/z 2819 (Fig. 2A), 8860 (Fig. 2C), and 9462 (Fig. 2D) were up-regulated after exposure to endosulfan exposure at concentrations of LC10 and LC20. The peak at m/z 8462 (Fig. 2B) was down-regulated in the male medaka. However, no significantly different peaks (p<0.05) were detected using the CM10 proteinchip. Thus, the Q10 proteinchip was useful for selectively profiling estrogen-responsive peaks in the medaka fishes.
SELDI-TOF Mass spectra of significantly different proteins of male Oryzias latipes exposed to endosulfan using the Q10 Protein Chip (p<0.05). A; m/z 2819, B; m/z 8462, C; m/z 8860, D; m/z 9462.
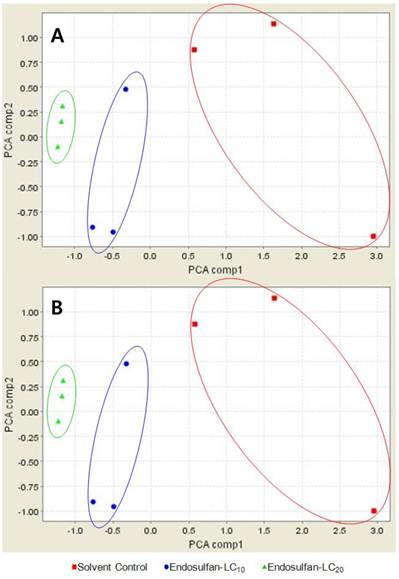
By principal component analysis (PCA), the CM10 proteinchip separated endosulfan-treated male fishes from acetone-treated male fishes (Fig. 3A). However, CM10 proteinchip failed to separate the protein peaks observed after treatment with LC20 from the peaks observed after treatment with LC10 (Fig. 3A). On the other hand, Q10 proteinchip successfully separated all three treated groups as shown in Fig. 3B. 26 protein peaks from 31 protein peaks detected by Q10 increased with an increase in the endosulfan concentration. Therefore, Q10 proteinchip was determined to be more effective proteinship in profiling medaka plasma proteins than CM10.
PCA-plot of Oryzias latipes exposed to endosulfan and solvent control using the (A) CM10 Protein Chip and (B) Q10 Protein Chip. red square; solvent control, blue circle; endosulfan at the level of LC10, green triangle; endosulfan at the level of LC20.
For biomarkers applications, candidate protein peaks must first be identified by analytical tools. A potent biomarker, which had a mass-to-charge ratio of 3025.5, was determined by the proteomics technique using SELDI-TOF MS and a weak cation exchange proteinchip (CM10) separation against 17β-estradiol, methoxychlor, bisphenol-A, 4-tert-pentylphenol, endosulfan, and chlorpyrifos in the adult male sheepshead minnows (Cyprinodon variegates) [12]. This potent biomarker was determined to be a zona radiata protein (ZRP), fragment 2 [12]. In Atlantic cod (Gadus morhua), the same proteomic technique was used to identify 2 peaks, which were determined to be fragments of vitellogenin protein and ZRP [15]. Those proteins significantly increased in the male liver of Salmo salar to nonylphenol, a well-known estrogen-disrupting compound [29].
However, the identification of the candidate protein peaks was conducted after purification of the candidate proteins by conventional chromatographic techniques. Thus, one of the major disadvantages of SELDI-TOF MS is the lack of direct identification of the discriminatory peaks discovered. Recently, direct identification after proteinchip elution was demonstrated [15]. This technique was used to identify a biomarker candidate in the plasma of Atlantic cod (G. morhua) using a combination of SELDI-TOF MS and on-chip elution, which involved a highly sensitive LC-MS/MS system. For further studies on the identification of the candidate protein peaks determined by Q10 proteinchip in the medaka fishes, conventional chromatographic methods or the recently introduced on-chip elution will need to be used.
In conclusion, four novel biomarker candidate proteins for the detection of endosulfan induced estrogenic disruption in aquatic ecosystems at the LC10 and LC20 were identified using O. latipes, which showed a significant induction of vitellogenin in male livers. SELDI-TOF MS analysis for detecting differential expression was shown to be more effective with the Q10 proteinchip separation in fish.
Acknowledgements
This research was supported by Basic Science Research Program through the National Research Foundation of Korea (NRF) funded by the Ministry of Education, Science and Technology (2011-0027429).
Competing Interests
The authors have declared that no competing interest exists.
References
1. Jonsson CM, Toledo MCF. Bioaccumulation and elimination of endosulfan in the Fish Yellow Tetra (Hyphessobrycon-Bifasciatus). Bulletin of Environmental Contamination and Toxicology. 1993;50:572-577
2. Brunelli E, Bernabo I, Berg C, Lundstedt-Enkel K, Bonacci A, Tripepi S. Environmentally relevant concentrations of endosulfan impair development, metamorphosis and behavior in Bufo bufo tadpoles. Aquatic Toxicology. 2009;91:135-142
3. Sharma A, Mishra M, Ram KR, Kumar R, Abdin MZ, Chowdhuri DK. Transcriptome analysis provides insights for understanding the adverse effects of endosulfan in Drosophila melanogaster. Chemosphere. 2011;82:370-376
4. Neuparth T, Bickham JW, Theodorakis CW, Costa FO, Costa MH. Endosulfan-induced genotoxicity detected in the Gilthead seabream, Sparusaurata L, by means of flow cytometry and micronuclei assays. Bulletins of Environmental Contamination and Toxicology. 2006;76:242-248
5. USEPA (US Environmental Protection Agency). Reregistration eligibility decision for Endosulfan, EPA 738-R-02-013. US: USEPA. 2002
6. Dutta HM, Misquitta D, Khan S. The effects of endosulfan on the testes of bluegill fish, Lepomismacrochirus: a histopathological study. Archives of Environmental Contamination and Toxicology. 2006;51:149-156
7. Mckinlay R, Plant JA, Bell JNB, Voulvoulis N. Endocrine disrupting pesticides: implications for risk assessment. Environment International. 2008;34:168-183
8. KCPA (Korea Crop Protection Association). Agrochemicals Use Guide Book. Republic of Korea: KCPA. 2010
9. Zhou M, Li Y, Nkedi-Kizza P, O`Hair SK. Endosulfan losses through runoff and leaching from calcareous gravelly or marl soils. Vadose Zone Journal. 2003;2:231-238
10. Lee SE, Kim JS, Kennedy IR, Park JW, Kwon KS, Koh SC, Kim JE. Biotransformation of an organochlorine insecticide, endosulfan, by Anabaena species. Journal of Agricultural and Food Chemistry. 2003;51:1336-1340
11. Lee N, Kennedy IR. Environmental monitoring of pesticides by immunoanalytical techniques: validation, current status, and future perspectives. Journal of AOAC International. 2001;84:1393-1406
12. Walker CC, Salinas KA, Harris PS, Wilkinson SS, Watts JD, Hemmer MJ. A proteomic (SELDI-TOF-MS) approach to estrogen agonist screening. Toxicological Sciences. 2007;95:74-81
13. Tang N, Tornatore P, Weinberger SR. Current developments in SELDI affinity technology. Mass Spectrometry Reviews. 2004;23:34-44
14. Collins BC, Sposny A, McCarthy D, Brandenburg A, Woodbury R, Pennington SR, Gautier J, Hewitt P, Gallagher WM. Use of SELDI MS to discover and identify potential biomarkers of toxicity in InnoMed PredTox: A multi-site, multi-compound study. Proteomics. 2010;10:1592-1608
15. Nilson MM, Meier S, Larsen BK, Anderson KO, Hjelle A. An estrogen-responsive plasma protein expression signature in Atlantic cod (Gadus morhua) revealed by SELDI-TOF MS. Ecotoxicology and Environmental Safety. 2011;74:2175-2181
16. RDA (Rural Development Administration). Guideline for standards and methods of pesticide registration. Republic of Korea: RDA. 2009
17. OECD (Organisation for Economic Co-operation and Development). OECD guidelines for the testing of chemicals No. 203 Fish, Acute Toxicity Test. Paris: OECD. 1992
18. Finney DJ. Probit Analysis. Cambridge, England: Cambridge University Press. 1952
19. Russel RM, Robertson JL, Savin NE. POLO PC: a new computer program for probit analysis. Bulletin of the Entomological Society of America. 1977;23:209-213
20. Brion F, Nilsen BM, Eidem JK, GoksØyr A, Porcher JM. Development and validation of an enzyme-linked immunosorbent assay to measure vitellogenin in the zebrafish (Daniorerio). Environmental Toxicology and Chemistry. 2002;28:1699-1708
21. Nilsen BM, Berg K, Eidem JK, Kristiansen SI, Brion F, Porcher JM, GoksØyr A. Devlopment of quantitative vitellogenin-ELISAs for fish test species used in endocrine disruptor screening. Analytical and Bioanalytical Chemistry. 2004;378:621-633
22. SAS Institute. SAS User's guide, 4th Edition. Cary, NC: SAS Institute. 1990
23. Bradford MM. A rapid and sensitive method for the quantitation of microgram quantities of protein utilizing the principle of protein-dye binding. Analytical Biochemistry. 1976;72:248-254
24. Carriger JF, Hoang TC, Rand GM, Gardinali PR, Castro J. Acute Toxicity and Effects Analysis of Endosulfan Sulfate to freshwater fish species. Archives of Environmental Contamination and Toxicology. 2011;60:281-289
25. WHO (World Health Organization). The WHO Recommended Classification of Pesticides by Hazard. WHO. 2005
26. Slooff W, Canton JH, Hermens JLM. Comparison of the susceptibility of 22 freshwater species to 15 chemical compounds. I. (Sub)acute toxicity tests. Aquatic Toxicology. 1983;4:113-128
27. Yamani S. Zebrafish (Danio rerio) and Japanese medaka (Oryzias latipes) as model species for evaluation of endocrine disrupting chemicals. Sweden: International MSc Thesis, Faculty of Veterinary Medicine, Swedish University of Agricultural Sciences. 2004
28. Andersen HR, Andersson AM, Arnold SF. et al. Comparison of short-term estrogenicity tests for identification of hormone-disrupting chemicals. Environmental Health Perspectives. 1999;107(Suppl 1):89-108
29. Arukwe A, Roe K. Molecular and cellular detection of vitellogenin and zona radiate protein in liver and skin on juvenile salmon (Salmo salar) exposed to nonylphenol. Cell and Tissue Research. 2008;331:701-712
Author contact
![]() Corresponding author: Prof. Cho Kijong Division of Environmental Sciences and Ecological Engineering, College of Life Sciences and Biotechnology, Korea University, Seoul 136-701, Korea.
Corresponding author: Prof. Cho Kijong Division of Environmental Sciences and Ecological Engineering, College of Life Sciences and Biotechnology, Korea University, Seoul 136-701, Korea.