Impact Factor ISSN: 1449-2288
- Issue 12; 2026
- Issue 11; 2026
- Issue 10; 2026
- Issue 9; 2026
- Issue 8; 2026
- Volume 22; 2026
- Past Issues
- Advance Articles
- Editorial Board
- Cover Images
- Index & Coverage
- Cover Suggestion
- Special Issues
Introduction
Results and Discussion
Conclusion
Materials and Methods
Supplementary Material
Acknowledgements
References

 Global reach, higher impact
Int J Biol Sci 2013; 9(6):550-556. doi:10.7150/ijbs.6257 This issue Cite
Short Research Communication
Deep Sequencing of the Transcriptome Reveals Inflammatory Features of Porcine Visceral Adipose Tissue
Tao Wang*, Anan Jiang*, Yanqin Guo, Ya Tan, Guoqing Tang, Miaomiao Mai, Haifeng Liu, Jian Xiao, Mingzhou Li ![]() , Xuewei Li
, Xuewei Li ![]()
Institute of Animal Genetics & Breeding, College of Animal Science & Technology, Sichuan Agricultural University, Ya'an, Sichuan, China.
* These authors contributed equally to this work.
Received 2013-4-28; Accepted 2013-5-14; Published 2013-6-9
Abstract
Functional differences in the different types of adipose tissue and the impact of their dysfunction on metabolism are associated with the regional distribution of adipose depots. Here we show a genome-wide comparison between the transcriptomes of one source of subcutaneous and two sources of visceral adipose tissue in the pig using an RNA-seq approach. We obtained ~32.3 million unique mapped reads which covered ~80.2% of the current annotated transcripts across these three sources of adipose tissue. We identified various genes differentially expressed between subcutaneous and visceral adipose tissue, which are potentially associated with the inflammatory features of visceral adipose tissue. These results are of benefit for understanding the phenotypic, metabolic and functional differences between different types of adipose tissue that are deposited in different body sites.
Keywords: subcutaneous adipose tissue, visceral adipose tissue, RNA-seq, inflammatory, fatty acid metabolism, pig.
Introduction
It is well documented that the metabolic risk factors of obesity development are more strongly associated with the distribution of adipose tissue in the body than with the total body adipose mass [1]. In mammals, the adipose tissue can be divided into two major types according to the different locations; visceral adipose tissue (VAT) that is found around the internal organs, and subcutaneous adipose tissue (SAT) that is located beneath the skin [2].
VAT has been recognized as biochemically distinct from SAT, and has been found to be associated with various obesity-induced diseases, such as cardiovascular disease, type II diabetes mellitus and metabolic syndrome. The venous drainage of VAT is via the portal system, directly providing free fatty acid (FFAs) as a substrate for hepatic lipoprotein metabolism and glucose production [3]. Compared with SAT, VAT is more cellular, vascular, innervated and contains a larger number of inflammatory and immune cells, has a lesser preadipocyte differentiating capacity and a greater percentage of large adipocytes [4]. There are more glucocorticoid and androgen receptors in VAT than in SAT [5]. VAT adipocytes are more metabolically active, more sensitive to lipolysis and more insulin-resistant than SAT adipocytes [6]. VAT has a greater capacity to generate FFAs and to take up glucose than SAT and is more sensitive to adrenergic stimulation, while SAT is more active in absorption of circulating FFAs and triglycerides [4].
To better understand the distinct features of VAT and SAT, we used an RNA-seq approach to measure differences in the mRNA transcriptome between one SAT, namely the hypodermal layer of backfat (HLB), and two representative sites of VAT, being the greater omentums (GOM) and mesenteric adipose tissue (MAD), in pig. Various genes involved in the inflammatory response and fatty acid metabolism were shown to be differentially expressed, which may be useful to better understand the phenotypic and functional differences of fatty acid composition and inflammatory characters between SAT and VAT.
Results and Discussion
Differences in morphology and fatty acid composition
Coinciding with our previous reports in the pig [7], SAT and VAT showed obvious variations in adipocyte phenotype (Supplementary Material: Fig. S1A and B) and fatty acid composition (Supplementary Material: Table S1); both of these factors imply intrinsic differences between their transcriptomes. Subcutaneous HLB had a higher adipocyte volume than visceral GOM (Tukey's test, P < 0.05) and MAD (P < 0.05), while there was no significant difference between GOM and MAD (P > 0.05) (Supplementary Material: Fig. S1B). Compared with GOM and MAD, HLB contained a higher content of MUFA and PUFA, and lower content of SFA, as well as a higher ratio of PUFA/SFA (Supplementary Material: Table S1). In addition, HLB exhibited a higher desaturation index (DI) and lower elongation index (EI) than that of either GOM and MAD, which reflected the proportion of MUFA product generated from the SFA precursor occupying a greater proportion in SAT than in VAT (Supplementary Material: Table S1).
Summary and validation of RNA-seq
Using the Illumina paired-end RNA-seq approach, we sequenced the transcriptome of porcine HLB, GOM and MAD, generating a total of 263 million paired-end reads of 75 bp length. This yielded 19.7 gigabases (Gb) of sequence, representing approximately seven times the size of the pig genome (~2.5 Gb). Of 60.2-61.0% reads which were aligned (< 2 mismatches) to the UCSC pig reference genome (Sscrofa9.2) using the Tophat package [8], 35.9-37.3% reads had a unique genomic location (Table 1). Cufflinks [9] was then used to de novo assemble the porcine adipose transcriptome, 22,015 transcripts were assembled, which covered 80.2% (22,015 of 27,444) of the annotated transcripts in UCSC pig genome database. Individual transcript with FPKM (the number of fragments per kilobase of exon per million fragments mapped) value > 0.05 [9] and expressed in at least one of the 3 adipose tissues was termed as expressed transcript and used for subsequent analysis. Consequently, we identified 15,003 out of the 22,015 (68.2%) expressed transcripts, with 13,325 (88.8%), 13,120 (87.4%) and 13,484 (89.9%) transcripts which were expressed in HLB, GOM and MAD, respectively (Table 1).
Summary of RNA-seq alignment.
| Group | HLB | GOM | MAD |
|---|---|---|---|
| Total sequenced reads | 88,112,940 | 90,112,694 | 85,114,208 |
| Total aligned reads | 52,768,153 | 54,290,677 | 51,924,219 |
| Uniquely aligned reads | 32,834,432 | 33,479,707 | 30,532,913 |
| Multiple aligned reads | 19,933,721 | 20,810,970 | 21,391,306 |
| Unmapped reads | 35,344,787 | 35,822,017 | 33,189,989 |
| Expressed transcripts | 13,325 | 13,120 | 13,484 |
The transcript populations of the three adipose tissues were dominated by a small number of highly expressed genes (Supplementary Material: Fig. S2). The ten transcripts with the highest abundance contributed approximately 32% of the total transcripts (Supplementary Material: Fig. S2). These may be genes which play cellular housekeeping roles or which are vital regulatory transcripts involved in adipogenesis. One such example is fatty acid binding protein 3 (FABP3), which plays a key role as a transport vehicle of long-chain fatty acids throughout the cytoplasm [10].
Comparison of transcription events
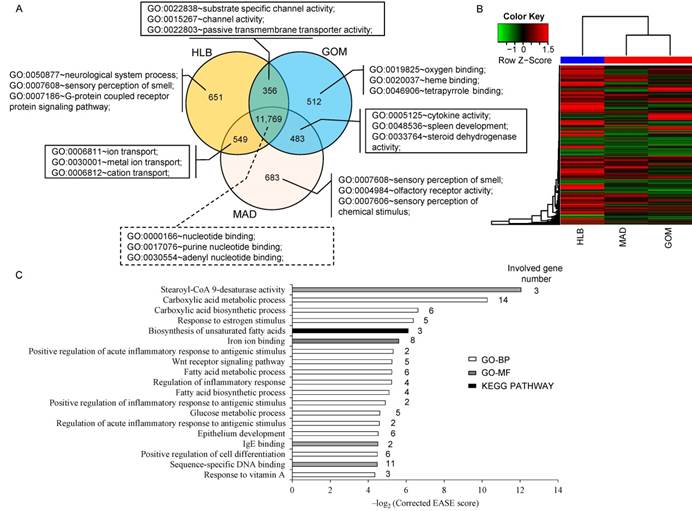
A total of 11,769 transcripts were co-expressed in the three adipose tissues, (Fig. 1A), and these were primarily enriched in the categories of 'nucleotide binding' (1,239 transcripts, P = 1.89E-24), 'purine nucleotide binding' (1,059 transcripts, P = 1.01E-20) and 'adenyl nucleotide binding' (888 transcripts, P = 1.91E-20). Notably, transcripts that were co-expressed in GOM and MAD were primarily enriched in the categories of 'cytokine activity' (13 transcripts, P = 4.66E-05), 'spleen development' (5 transcripts, P = 1.29E-04) and 'steroid dehydrogenase activity' (5 transcripts, P = 7.13E-04), which is consistent with the particular immune character of GOM and MAD (Fig. 2A). In addition, unsupervised clustering of the three adipose tissues showed that MAD and GOM are closer to each other than to HLB, which also highlights the different transcriptome features of SAT compared with VAT (Fig. 1B).
Comparison of the transcriptomes of three adipose tissues. (A) Comparison of expressed transcripts. (B) Hierarchical clustering using all expressed transcripts. (C) GO (Gene Ontology) and pathway categories enriched for DE transcripts.
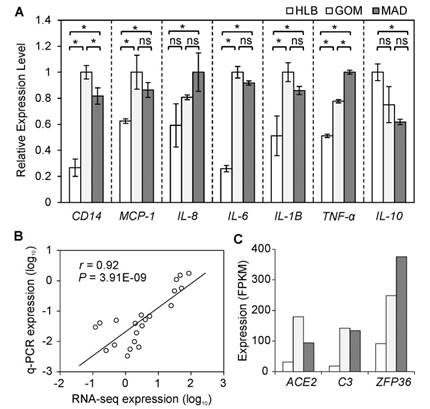
Inflammatory gene expression patterns in three adipose tissues. (A) Seven inflammatory indicators were measured using q-PCR. Data are expressed as mean ± SD, and statistical significance was assessed using one-way ANOVA and the Tukey multiple range test. * indicates P < 0.05; ns: not significant. (B) Correlation between gene expressions as measured using q-PCR and RNA-seq methods. (C) Expression of DE genes involved in inflammation.
Because of the higher similarity between GOM and MAD based on the clustering evidence, we combined GOM and MAD as a single VAT group, which we then compared with SAT (in this case HLB), and obtained 183 differentially expressed (DE) genes between VAT and SAT (Supplementary Material: Table S2), these DE genes differentially expressed in GOM / HLB and MAD / HLB group, but have no difference between GOM and MAD. Functional enrichment analysis analysis indicated that they were primarily enriched in categories related to fatty acid metabolism (e.g., fatty acid biosynthetic process, fatty acid metabolic process, stearoyl-CoA 9-desaturase activity) and the inflammatory response (e.g., regulation of inflammatory response, positive regulation of inflammatory response to antigenic stimulus) (Fig. 1C), which reflects their distinct metabolic and inflammatory features.
Genes involved in inflammation and immune response
To highlight the inflammatory and immune features of VAT, we further examined the mRNA expression levels of seven representative indicators related to a pro-inflammatory response using a q-PCR approach. Five inflammatory indicators (MCP-1, TNF-α, IL-6, IL-8, and IL-1B) were more highly expressed in VAT than in SAT. Notably, CD14, a macrophage marker [11], was highly expressed in VAT compared with SAT. This is evidence of a greater number of macrophages infiltrating VAT, which may contribute to enhancement of the 'low-grade' chronic inflammation associated with obesity [12]. In contrast, IL-10, an anti-inflammatory cytokine, was more highly expressed in HLB (Fig. 2A) than in VAT, which also supports the presence of distinct inflammatory characteristics between VAT and SAT. In addition, the expression changes of these seven indicator genes as assessed by q-PCR exhibited a significant positive correlation (average Pearson's r = 0.92, P = 3.91E-09; Fig. 2B) with the results obtained using RNA-seq, which suggests that results from the RNA-seq approach can be viewed with confidence (other six genes were also validated by q-PCR, Supplementary Material: Fig. S3).
Three inflammatory response genes (ACE2, C3 and ZFP36) were more highly expressed in VAT than in SAT (Fig. 2C). C3, as a protein of the immune system, plays a central role in the complement system and contributes to innate immunity, and is related to insulin resistance in humans [13]. ACE2, as a newly-identified component of the renin-angiotensin system (RAS), has been described as a mono-carboxypeptidase homolog of angiotensin I-converting enzyme (ACE) [14]. ZFP36 can bind to AU-rich elements (AREs) in the 3'-untranslated regions (UTRs) of cytokines, which can thus be enhanced by macrophage-derived inflammatory stimuli (such as TNF-α, IL-6 and IL-8) [15].
Genes that impact on fatty acid composition
Fatty acids (FA) are a type of energy-rich molecule, which not only play an important role in metabolism, but also represent a diverse class of molecules known to regulate inflammatory pathways. We found that various genes differentially expressed between VAT and SAT are involved in 'the regulation of FA metabolism' (6 genes, P = 0.03). For example, SCD1, as a key enzyme in converting SFA to MUFA, is involved in the biosynthesis of oleate (18:1) and palmitoleate (16:1). This was more highly expressed in SAT (Fig. 3) than in VAT, which may result in the higher component of SFA in VAT (50.4%) than in SAT (37.4%, Student's t-test, P = 8.14E-04) (Supplementary Material: Table S1). Previous reports have demonstrated that SFA may stimulate inflammation in adipose tissue [19, 20]. In contrast, SCD5, a newly identified isoform of the stearoyl-CoA desaturase (SCD) family, is preferentially expressed in VAT (Fig. 3), which suggests distinct roles for SCD1 and SCD5 in fatty acid metabolism. FADS2, also known as ∆6 FA desaturase [21], may catalyze the initial, rate-limiting desaturation of linoleic acid (LA; ω6-18:2 9,12 ) to γ-linolenic acid (GLA; 18:3 6,9,12 ), and of α-linolenic acid (ALA; ω3-18:3 9,12,15 ) to stearidonic acid (SA; 18:4 6,9,12,15 ). LA and ALA are two essential fatty acids (EFA) which are obtained through the diet and then deposited in the adipose tissue. FADS2 was more highly expressed in VAT than in SAT, which is consistent with the observation that LA (SAT: 16.0%, VAT: 10.45%, P = 1.39E-03) and ALA (SAT: 0.76%, VAT: 0.52%, P = 0.66E-03) had a lower content in VAT (Supplementary Material: Table S1).
Genes involved in fatty acid desaturation and elongation. The sites of action of ∆9, ∆6, and ∆5 desaturases, and of elongation (e), are shown. The ∆6 and ∆5 desaturase enzymes are encoded by FADS2 and FADS1, respectively. * Denotes alternative pathways via ∆8 desaturase which have been demonstrated in mammals by Park et al 2009 [16]. The dotted boxes illustrate that AA, EPA and DHA are precursors of eicosanoids and similar mediators (e.g., docosanoids) and hence influence inflammatory processes as previously reported [17, 18]. Fatty acids or desaturases elevated in VAT (compared with SAT) in this study are shown in red, and those in blue are lower in VAT compared with SAT.

Furthermore, the EFA, LA and ALA serve as substrates for other important FAs, especially the eicosanoids, which are the key linkers between PUFAs and inflammatory processes. Consistent with the higher FASD2 expression and EI in VAT, VAT exhibited a lower proportion of LA and higher proportions of eicosadienoic acid (EDA, 20:2n-6) and GLA. In addition, we found similar expression levels of FASD1 (a member of the fatty acid desaturase (FADS) gene family) in VAT and SAT (Fig. 3). We tentatively deduce that VAT contains a higher content of dihomo-γ-linolenic acid (DGLA, 20:3n-6) and arachidonic acid (AA, 20:4n-6), both of which have direct pro-inflammatory effects [18]. Furthermore, compared with SAT, VAT has lower content of two members of the ω-3 family, namely EPA (SAT: 0.017%, VAT: 0.014%, P = 2.65E-03) and DHA (SAT: 0.055%, VAT: 0.046%, P = 0.07) (Supplementary Material: Table S1), which play vital anti-inflammatory roles [22].
Conclusion
In this study, we have described a genome-wide comparison between porcine transcriptomes derived from one source of SAT and two sources of VAT. We have identified various genes differentially expressed between SAT and VAT, which are potentially associated with the inflammatory features of VAT. We have also identified various DE genes with well-characterized roles in fatty acid metabolism, which may be responsible for the higher content of SFA and ω-6 PUFA in VAT compared with SAT, which highlights the pro-inflammatory characteristics of VAT.
Materials and Methods
Animal materials
Three female Landrace pigs (a white, Western breed) at 210-days-old were used to harvest tissues. Adipose tissues were rapidly separated from subcutaneous depots (hypodermal layer of backfat) and two visceral depots (greater omentum and mesenteric) from each cleaved pig, immediately frozen in liquid nitrogen, and stored at -80°C until RNA extraction.
Adipose measurements
After sacrificed, all adipose tissues were fixed in 10% neutral buffered formalin solution, embedded in paraffin, sliced at a thickness of 6 μm using RM2135 rotary microtome (Leica, Germany) and stained with hematoxylin and eosin (H&E). The mean adipocyte cell volumes were measured for each sample using Image Pro-Plus 6.0 software (Media-Cybernetics, USA).
mRNA library construction and sequencing
Total RNA was extracted using Trizol reagent (Invitrogen, CA, USA) following the manufacturer's procedure. The total RNA quantity and purity were analysis of Bioanalyzer 2100 and RNA 6000 Nano LabChip Kit (Agilent, CA, USA) with RIN number > 6.0 (8.0). For minimize the effect of transcriptome unevenness among individuals, equal quantities (10 µg) of total RNA isolated from three female pigs were pooled. Approximately 30 µg of total RNA representing a specific adipose type was subjected to isolate Poly (A) mRNA with poly-T oligo-attached magnetic beads (Invitrogen). Following purification, the mRNA is fragmented into small pieces using divalent cations under elevated temperature. Then the cleaved RNA fragments were reverse-transcribed to create the final cDNA library in accordance with the protocol for the mRNA-Seq sample preparation kit (Illumina, San Diego, USA), the average insert size for the paired-end libraries was 200 bp (±20 bp). And then we performed the paired-end sequencing (75 bp) on a Genome Analyzer II at the LC Science (Houston, TX) following the vendor's recommended protocol.
RNA-Seq Data analysis
For each sample, sequenced reads were aligned to pig reference genome (susScr2) downloaded from UCSC Genome Browser. Alignment was performed by using Tophat (v1.1.4) with default parameters except: -a 5 -r 200 --mate-std-dev 100 -m 1 -I 1000000 -F 0.05 --segment-mismatches 2. Ensemble and N-SCAN gene annotation files in GTF file format downloaded from UCSC Genome Browser were provided to Tophat. Tophat will look for the junctions in the annotation file and novo junctions. After alignment, Cufflinks (v0.9.1) was used to de novo assemble the transcriptome for each sample separately with default parameters except: -F 0.50 -f 0.15 -j 0.50 --min-frags-per-transfrag 50 -r pig_genome.fa.
Functional enrichment analysis
Assembled transcripts were converted to human orthologous genes, and the lists were submitted to DAVID [23] web server (http://david.abcc.ncifcrf.gov/) for enrichment analysis of the significant overrepresentation of GO biological processes (GO-BP), molecular function (GO-MF) terminologies, and KEGG-pathway category. In all tests, the completely known genes were appointed as the background, and P-values (i.e. EASE score), indicating significance of the overlap between various gene sets, were calculated using Benjamini-corrected modified Fisher's exact test. Only GO-BP, GO-MF or KEGG-pathway terms with a P-value less than 0.05 were considered as significant and listed.
Quantitative RT-PCR
Quantitative RT-PCR (q-PCR) was used to measure the mRNA expression levels of seven representative indicators. The q-PCR was performed on a CF96 Real-Time PCR Detection System (Bio-Rad) using SYBR® Green Real-time PCR Master Mix (TaKaRa, China). The PCR primer sequences are shown in Supplementary Material: Table S3. Porcine ACTB, TBP and TOP2B were simultaneously used as endogenous control genes. The 2-ΔΔCt method was used to determine the relative mRNA abundance for the surveyed samples.
Data availability
The full data sets have been submitted to NCBI Sequence Read Archive (SRA) under Accession SRP018856, Bioproject: PRJNA190624.
Supplementary Material
Table S1-S3 and Fig.S1-S3.
Acknowledgements
This work was supported by grants from the Specialized Research Fund of Ministry of Agriculture of China (NYCYTX-009), the Project of Provincial Twelfth Five Years' Animal Breeding of Sichuan Province (2011YZGG15) and the National Special Foundation for Transgenic Species of China (2011ZX08006-003) to X.L., the National High Technology Research and Development Program of China (863 Program) (2013AA102502) to M.L..
Competing Interests
The authors have declared that no competing interest exists.
References
1. Wronska A, Kmiec Z. Structural and biochemical characteristics of various white adipose tissue depots. Acta Physiologica. 2012;205:194-208
2. Camhi SM, Bray GA, Bouchard C. et al. The relationship of waist circumference and BMI to visceral, subcutaneous, and total body fat: sex and race differences. Obesity. 2011;19:402-8
3. Saltiel AR, Kahn CR. Insulin signalling and the regulation of glucose and lipid metabolism. Nature. 2001;414:799-806
4. Ibrahim MM. Subcutaneous and visceral adipose tissue: structural and functional differences. Obesity reviews. 2009;11:11-8
5. Kershaw EE, Flier JS. Adipose tissue as an endocrine organ. Journal of Clinical Endocrinology & Metabolism. 2004;89:2548-56
6. Jensen MD. Role of body fat distribution and the metabolic complications of obesity. Journal of Clinical Endocrinology & Metabolism. 2008;93:s57-s63
7. Li M, Wu H, Luo Z. et al. An atlas of DNA methylomes in porcine adipose and muscle tissues. Nat Commun. 2012;3:850
8. Trapnell C, Pachter L, Salzberg SL. TopHat: discovering splice junctions with RNA-Seq. Bioinformatics. 2009;25:1105-11
9. Trapnell C, Williams BA, Pertea G. et al. Transcript assembly and quantification by RNA-Seq reveals unannotated transcripts and isoform switching during cell differentiation. Nat Biotechnol. 2010;28:511-5
10. Shin HD, Kim LH, Park BL. et al. Polymorphisms in fatty acid-binding protein-3 (FABP3) - putative association with type 2 diabetes mellitus. Human mutation. 2003;22:180
11. Khazen W, M'Bika J P, Tomkiewicz C. et al. Expression of macrophage-selective markers in human and rodent adipocytes. FEBS letters. 2005;579:5631-4
12. Wellen KE, Hotamisligil GS. Obesity-induced inflammatory changes in adipose tissue. The Journal of clinical investigation. 2003;112:1785-8
13. Samaras K, Botelho NK, Chisholm DJ. et al. Subcutaneous and visceral adipose tissue gene expression of serum adipokines that predict type 2 diabetes. Obesity. 2012;18:884-9
14. Burrell LM, Johnston CI, Tikellis C. et al. ACE2, a new regulator of the renin-angiotensin system. Trends in endocrinology and metabolism: TEM. 2004;15:166-9
15. Brahma PK, Zhang H, Murray BS. et al. The mRNA-Binding Protein Zfp36 Is Upregulated by β-Adrenergic Stimulation and Represses IL-6 Production in 3T3-L1 Adipocytes. Obesity. 2012;20:40-7
16. Park WJ, Kothapalli KSD, Lawrence P. et al. An alternate pathway to long-chain polyunsaturates: the FADS2 gene product Δ8-desaturates 20: 2n-6 and 20: 3n-3. Journal of lipid research. 2009;50:1195-202
17. Glaser C, Heinrich J, Koletzko B. Role of FADS1 and FADS2 polymorphisms in polyunsaturated fatty acid metabolism. Metabolism: clinical and experimental. 2010;59:993
18. Calder PC. Polyunsaturated fatty acids and inflammatory processes: new twists in an old tale. Biochimie. 2009;91:791-5
19. Chait A, Kim F. Saturated fatty acids and inflammation: who pays the toll? Arteriosclerosis, thrombosis, and vascular biology. 2010;30:692-3
20. Yeop Han C, Kargi AY, Omer M. et al. Differential effect of saturated and unsaturated free fatty acids on the generation of monocyte adhesion and chemotactic factors by adipocytes: dissociation of adipocyte hypertrophy from inflammation. Diabetes. 2010;59:386-96
21. Cho HP, Nakamura M, Clarke SD. Cloning, expression, and fatty acid regulation of the human delta-5 desaturase. The Journal of biological chemistry. 1999;274:37335-9
22. Itariu BK, Zeyda M, Hochbrugger EE. et al. Long-chain n-3 PUFAs reduce adipose tissue and systemic inflammation in severely obese nondiabetic patients: a randomized controlled trial. The American journal of clinical nutrition. 2012;96:1137-49
23. Da Wei Huang, Brad TS, Lempicki RA. Systematic and integrative analysis of large gene lists using DAVID bioinformatics resources. Nature protocols. 2008;4:44-57
Author contact
![]() Corresponding author: M.Z.L (E-mail: mingzhou.licom) or X.W.L (E-mail: xuewei.liedu.cn).
Corresponding author: M.Z.L (E-mail: mingzhou.licom) or X.W.L (E-mail: xuewei.liedu.cn).