Impact Factor ISSN: 1449-2288
- Issue 12; 2026
- Issue 11; 2026
- Issue 10; 2026
- Issue 9; 2026
- Issue 8; 2026
- Volume 22; 2026
- Past Issues
- Advance Articles
- Editorial Board
- Cover Images
- Index & Coverage
- Cover Suggestion
- Special Issues
Introduction
Materials and methods
Results
Discussion
Supplementary Material
Acknowledgements
References

 Global reach, higher impact
Int J Biol Sci 2014; 10(8):834-845. doi:10.7150/ijbs.9406 This issue Cite
Research Paper
Establishment and Characterization of a Highly Tumorigenic African American Prostate Cancer Cell Line, E006AA-hT
Shahriar Koochekpour1, 2 ![]() , Stacey S. Willard1, Mojgan Shourideh1, Shafat Ali1, Chunhong Liu1, Gissou Azabdaftari3, Mohammad Saleem4, Kristopher Attwood5
, Stacey S. Willard1, Mojgan Shourideh1, Shafat Ali1, Chunhong Liu1, Gissou Azabdaftari3, Mohammad Saleem4, Kristopher Attwood5
1. Department of Cancer Genetics, Center for Genetics and Pharmacology, Roswell Park Cancer Institute, New York, United States of America;
2. Department of Urology, Center for Genetics and Pharmacology, Roswell Park Cancer Institute, New York, United States of America;
3. Department of Pathology, Center for Genetics and Pharmacology, Roswell Park Cancer Institute, New York, United States of America;
4. Molecular Chemoprevention and Therapeutics, The Hormel Institute, University of Minnesota, Austin, Minnesota, United States of America;
5. Department of Biostatistics, University of Buffalo, New York, United States of America.
Received 2014-4-15; Accepted 2014-6-25; Published 2014-7-26
Abstract
Genuine racial differences in prostate cancer (PCa) biology have been considered among the potential reasons to explain PCa disparities. There is no animal model to represent all aspects of human PCa and, more specifically, to be used for PCa disparity research. The lack of a spontaneously transformed in vitro cell-based model system has been a significant impediment to investigating and understanding potential molecular mechanisms, and the hormonal, genetic, and epigenetic factors underlying the biological and clinical aggressiveness of PCa in African American (AA) men.
In this study, we established and characterized the E006AA-hT cell line as a highly tumorigenic subline of the previously characterized primary AA-PCa cell line, E006AA. Extensive characterization of the E006AA-hT cell line was accomplished using cytodifferentiation and prostate-specific markers, spectral karyotyping, cell line authentication assays, cell proliferation and migration assays, and in vitro tumorigenesis assays.
Spectral karyotyping of E006AA-hT showed a hypertriploid chromosome complement and shared cytogenetic changes similar to its parental cells such as diploid X, absence of Y-chromosomes, numerical gains in chromosomes 5,6,8,10,17,20,21, and marker chromosomes of unknown origin. In addition, E006AA-hT also presented numerous clonal and structural aberrations such as insertion, deletion, duplication, and translocations in chromosomes 1-5, 8, 9, 11, 13, 14, 17, and 18. The E006AA-hT cell line was shown to be highly tumorigenic and produced tumors at an accelerated growth rate in both athymic nude and triple-deficient SCID mice.
Silencing the mutated androgen receptor (AR-599 Ser>Gly) did not affect proliferation (loss-of-function), but decreased migration (gain-of-function) in E006AA-hT and its parental cell type. These data support that AR-point mutations may lead simultaneously to different “loss-of-function” and “gain-of-function” phenotypes in PCa cells. E006AA-Par and its subline as the only available spontaneously transformed low- and highly-tumorigenic primary AA-PCa cell lines could be used for basic and translational research aimed in supporting prostate cancer disparity research.
Keywords: Prostate Cancer, African American, Androgen Receptor, E006AA, tumorigenic.
Introduction
The largest U.S. cancer health disparity exists in prostate cancer (PCa), with African American (AA) men having the highest incidence and mortality rates [1-4]. PCa is the second leading cause of cancer-related death in AA men [4, 5]. The U.S. is not the only geographical location with a higher PCa incidence, earlier onset, and increased aggressiveness in men of African ancestry. Rather, research in the United Kingdom, South America, Caribbean, and Central and West African nations (e.g., Nigeria, Senegal, Cameroon, and Kenya) have also found an excessive disease burden compared with other population groups [6-14]. PCa accounted for 37% of all cancers in AA men in 2013 [4]. AA men have a two-thirds higher PCa incidence rate and two times greater mortality rate than Caucasian Americans (CAs) [2]. In addition, they are more frequently diagnosed with higher Gleason grades, advanced tumor stage, higher PSA levels, higher tumor volume, poorer prognosis, and worse overall survival rate than CA men [15-19].
The causes of PCa disparities are complex and multifaceted. Three potential reasons are frequently proposed to explain the racial disparity in PCa, including: 1) AAs present more often with advanced incurable PCa due to more limited access to health care resulting in decreased participation in early detection programs [16-19]; 2) AAs are less likely to participate in clinical trials offering detection and effective treatment for early stage disease [20, 21]; 3) PCa is biologically more aggressive in AAs than CAs. Among men treated by radical prostatectomy, race alone was found prognostically important when age, Gleason grade, and clinical stage were controlled in multivariate analysis [22].
There is no animal model to represent all aspects of human PCa and more specifically to be used for PCa disparity research. Researchers have invested a significant amount of their effort into developing cell-based model systems that can recapitulate primary or metastatic PCa cells. These efforts led to the establishment and characterization of approximately 200 cell lines and their clonal derivatives (derived from Caucasians) to address biological characteristics of PCa such as AR mutation, expression, and signaling, tumor heterogeneity, growth rate, metastatic colonization to bone, androgen-dependence, androgen-independent transition or castrate-resistant progression, genetic and epigenetic alterations, or changes in molecular markers of diagnosis or disease progression such as PSA and TMPRSS2-ERG (TE)-gene fusion [23, 24].
To establish stable PCa cell lines or their isogenic sublines, various methods have been used including chemical mutagenesis (e.g., N-Nitrosomethyl urea, Cadmium), viral transformation (e.g., SV40, HPV-16E6/E7, HPV-18, v-Ki-ras), molecular alterations (e.g., hTERT: Telomerase-immortalization), or genetic changes induced by castration of host mice bearing tumor xenografts (e.g., LNCaP, C4-2) [25-33]. Such modifications affect a variety of biological and genetic characteristics and do not truly reflect the endogenous phenotypes of PCa cells [34, 35]. Currently, there are only two viral-transformed or -immortalized PCa and normal cell lines established from normal prostate epithelial cells obtained from an AA man. The RC-77T/E PCa cell line established by HPV-16E6/E7 transformation and the RC165N generated by telomerase (hTERT) immortalization [25, 26], (Table 1). To the best of our knowledge, there are only two spontaneously transformed AA-derived PCa cell lines; MDA-PCa2a/2b and E006AA [36, 37]. MDA PCa 2a and 2b cell lines were derived from a single bone metastasis in an AA patient with castrate-resistant PCa. This cell line is tumorigenic, AR+/PSA+, and represents the advanced stage of the disease. The E006AA-Parental (Par) cell line was established in our laboratory several years ago as the only available primary AA-PCa cell line derived from an organ-confined Gleason 6 tumor [36, 38]. The E006AA cell line expresses AR and was repeatedly reported to be non-tumorigenic in nude mice [36, 38].
DNA profile analysis of E006AA-Par and E006AA-hT cell lines for intra-species identification.
| Target Loci | E006AA-Par | E006AA-hT | Alleles Match | ||||
|---|---|---|---|---|---|---|---|
| Allele 1 | Allele 2 | Alleles | Allele 1 | Allele 2 | Alleles | ||
| Amelogenin | X | X | X,X | X | X | X,X | 100% |
| CSF1PO | 10 | 10 | 10,10 | 10 | 10 | 10,10 | |
| FGA | 24 | 24 | 24,24 | 24 | 24 | 24,24 | |
| Penta-D | 9 | 12 | 9,12 | 9 | 12 | 9,12 | |
| Penta-E | 7 | 16 | 7,16 | 7 | 16 | 7,16 | |
| TPOX | 8 | 11 | 8,11 | 8 | 11 | 8,11 | |
| vWA | 15 | 17 | 15,17 | 15 | 17 | 15,17 | |
| D13S317 | 8 | 8 | 8,8 | 8 | 8 | 8,8 | |
| TH01 | 6 | 9.3 | 6,9.3 | 6 | 9.3 | 6,9.3 | |
| D16S539 | 12 | 12 | 12,12 | 12 | 12 | 12,12 | |
| D18S51 | 13 | 14 | 13,14 | 13 | 14 | 13,14 | |
| D21S51 | 29 | 30 | 29,30 | 29 | 30 | 29,30 | |
| D3S1358 | 16 | 16 | 16,16 | 16 | 16 | 16,16 | |
| D5S818 | 9 | 9 | 9,9 | 9 | 9 | 9,9 | |
| D7S820 | 11 | 11 | 11,11 | 11 | 11 | 11,11 | |
| D8S1179 | 13 | 13 | 13,13 | 13 | 13 | 13,13 | |
A recent study showed that the E006AA cell line forms continuously growing tumor in NOG-SCID triple-deficient mice (i.e., NOG-SCID mice not having NK, B, and T-cells). Early passage of tumorigenic E006AA cells show a ~70% tumor take rate and form a ~1.0 cm3 tumor in a period of 12 weeks [38]. Due to a significant deficiency for an in vitro cell-based model system to investigate biological and molecular mechanisms underlying inter-racial PCa disparity and the limited tumorigenicity in mice, we sought the possibility of generating a subline of parental E006AA cells with tumor-forming ability both in athymic nude mice and NOG-SCID mice.
We now report the establishment of a highly tumorigenic subline of the E006AA cell line capable of accelerated tumor growth in nude and SCID mice. Silencing the mutated androgen receptor (AR-599 Ser>Gly) did not affect proliferation (loss-of-function) but decreased migration (gain-of-function) in E006AA-hT and its parental cell type. Taken together we provide evidence supporting that AR-point mutations may lead simultaneously to different “loss-of-function” and “gain-of-function” phenotypes in PCa cells. E006AA-Par and its isogenic highly-tumorigenic subline provide a unique in vitro model system and resource for PCa disparity research.
Materials and methods
Cell lines
Androgen-independent (PC-3 and DU-145), androgen-stimulated (LNCaP) PCa cell lines were purchased from the American Type Culture Collection (Manassas, VA) and maintained in their defined medium [39]. Primary cultures of normal human prostate stromal (Pr.St) cells were purchased from Lonza (BioWhittaker, Walkersville, MD) maintained in their defined medium (SCGM) as recommended. E006AA cells were cultured in DMEM supplemented with 10% FBS.
Ethical considerations
All animal studies were performed according to the animal protocol approved by the Roswell Park Cancer Institute Animal Care and Use Committee.
Derivation and culture conditions of E006AA-hT
Since E006AA-Par cell line is not tumorigenic in nude mice (36, 38) and has a relatively slow tumor growth rate in SCID mice (38), we decided to establish an isogenic line with extended tumor growth rate and ability in both nude and SCID mice. In order to enhance our ability to isolate a pure culture of E006AA from xenografted tumors, we stably transfected E006AA-Par cell line with pcDNA3.1-NeoR vector and propagated the entire pool of G418-resistant cells. Using these cells in in vivo tumorigenesis assays, we found a rapidly growing tumor in one of the NOG-SCID mice three weeks after tumor cells inoculation. After sacrificing the mouse, without enzymatic digestion, to isolate E006AA cancer cells and exclude the contaminating fibroblasts and stromal cells, tumor tissue was minced into 1-2 mm3 and incubated in DMEM-10% FBS supplemented with G418 (1.0 mg/ml) at 37oC in 5% CO2. After two weeks, a pure epithelial cell line designated as the E006AA-hT cell line was established. The E006AA-hT cell line can be maintained continuously by routine passaging with trypsin in DMEM supplemented with 1 to 10% FBS. An early passage of the E006AA-hT cell line was used for testing its tumorigenic potential in a cohort of athymic nude mice (n=9) and triple-deficient NOG-SCID mice (n=9), cell line authentication, chromosomal karyotyping, and characterization of cytodifferentiation and prostate-specific markers.
Tumorigenicity of E006AA-hT in athymic nude mice and NOG-SCID mice
Athymic nude mice and triple-deficient NOG-SCID mice (Jackson Laboratories) were housed in laminar flow cabinets under specific pathogen-free conditions and used at 6-8 weeks of age. The E006AA-hT cell line was injected subcutaneously (S.Q.) at 200 μl per mouse (2 × 10⁶ cells mixed with Matrigel as 1:1 v/v) into the right flank. Tumors were measured twice weekly using a digital caliper, and the volumes were calculated by the following formula: Length x Length x height x 0.5236. Results were expressed as mean tumor volume, as a function of time. Mice were monitored closely for tumor formation for a period of up to eight weeks before reaching critical tumor volume (~1.2 cm3).
Histology
Formalin fixed and paraffin embedded tissue were cut into 5 micron thick sections and then deparaffinized and hydrated in xylene and ethanol, respectively. Hematoxylin and eosin staining was also performed as a standard regressive staining procedure. Histological examination of the tissue sections was performed by a board-certified Genitourinary pathologist and cytopathologist (Dr. Gissou Azabdaftari).
E006AA-Par and E006AA-hT cell lines authentication
DNA profile analysis was performed for E006AA-Par and E006AA-hT cell lines using Applied Biosystems Gene Mapper 4.0 and PCR-based powerplex 16 short-tandem repeat (STR) primers of D5S818, D13S317, D7S820, D16S539, vWA, TH01, TPOX, CSF1PO, D18S51, D21S11, D3S1358, D8S1179, FGA, Penta-D, Penta-E, and Amelogenin (Promega, Madison, WI). The genotyping and separation of the STR products were performed on capillary electrophoresis accompanied with reference sequenced ladders. In addition, we used RT-PCR and specific primers for human and mouse β-actin and human GAPDH, to verify human origin of E006AA-hT cell lines (Additional File 1: Supplementary Table 1 and Figure 1).
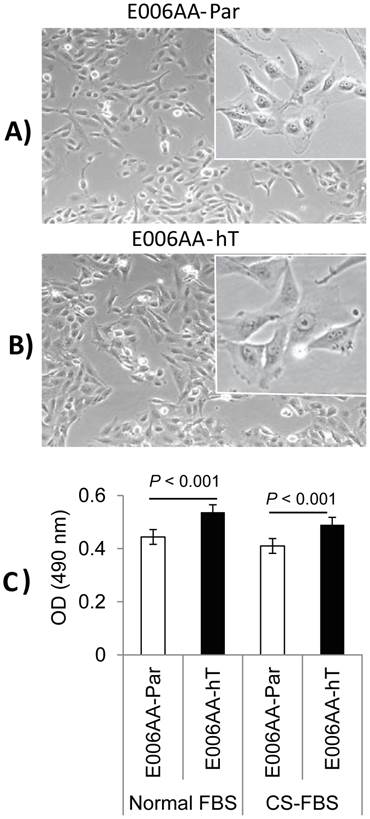
Phase contrast photomicrograph and growth of E006AA-Par and E006AA-hT cell lines. (A) E006AA-Par (40 x). (B) E006AA-hT (40 x). Incets (100 x). (C) Growth of E006AA-Par and E006AA-hT in culture medium containing normal-FBS or CS-FBS. Cells were seeded at 1.0 x 10³ per well in 96-well plates and cell proliferation was measured by MTS assay. Each data point is the average of three independent experiments; bars, Means ± SEM. Comparisons between groups were performed using Tukey-Kramer adjusted t-test. Significant differences were observed between the two cell lines cultured under normal-FBS or CS-FBS (p < 0.001).
Test for mycoplasma contamination
The absence of mycoplasma contamination was confirmed independently by using MycoTOOL PCR Mycoplasma Detection Kit according to the manufacturer's instructions (Roche Applied Science, IN).
Molecular characterization of E006AA-hT cell line
Cells were cultured in their complete media up to 75% confluency and harvested protein samples (5 μg for GAPDH and 15 or 20 μg for others) were subjected to SDS-PAGE and immunoblotting, as previously described [39]. Membranes were probed with mouse anti-human antibodies against p53, PTEN, desmin, CK-5, CK-8, CK-18, c-Met, HGF, α-SM, AR, PSA, NKx3.1, or PSMA (1:200; Santa Cruz, CA). Rabbit antibody against human TMPRSS2-ERG (Cat# EPR3864, Epitomics, Abcam, MA) fusion protein was used at 1:1000 dilution. Anti-GAPDH (Santa Cruz; 1:5000) was used as control loading. Signals were detected by ECL detection system (GE Healthcare, London, UK). Western blotting on whole cell lysate extracted from E006AA-hT cells was used to verify the epithelial origin of the cells and to exclude stromal derivation.
Cytogenetic analysis and spectral karyotyping
Analysis of chromosomal structure and aberrations was performed by spectral karyotyping (SKY) and G-banding on 20 metaphase chromosome spreads at the RPCI SKY core facility (http://www.roswellpark.edu/shared-resources/sky/fish-resource).
Cell proliferation assay
To evaluate growth rate, cells were seeded at 1.0 × 10³ per well in a 96-well plate in complete medium. After three days, the cell number was measured by an MTS assay using a CellTiter 96 AQueous One Solution Cell Proliferation Assay Kit according to manufacturer's instructions (Promega, Madison, WA). Briefly, 20 μl MTS solution was added to each well for 1 h incubation, and the absorbance at 490 nm was determined. We used 20-30 replicates for each cell line, and the experiment was repeated three times independently.
Transient transfection assays
E006AA-Par and E006AA-hT cells were seeded in 6-well plates overnight and transfected with 50 pmol of human AR-siRNA oligo (sc-29204) or control siRNA (sc-37007; Santa Cruz Biotechnology, Santa Cruz, CA) and 5 μl Lipofectamine RNAiMAX for 8 h. The transfected cells were cultured in complete medium for 24 h before harvesting the cells and performing cell proliferation and migration assays or harvesting cell lysates for AR protein expression detection by immunoblotting.
In vitro migration and invasion assays
The effect of AR silencing on cell migration was performed using 8-μm transwell filters (Costar, Corning, NY) with modification as described previously [39]. For the invasion assay, the upper compartment was coated with 50 μg Matrigel (BD Biosciences, San Jose, CA) to form a matrix barrier. A suspension of cells (20 × 104 per filter for migration and 40 x 104 per filter for invasion) in medium containing 1% FBS and 0.1% BSA was added to the upper compartment. The lower compartment was filled with 400 μl basal medium containing 10% FBS as chemoattractant. After 24 h for migration or 48 h for invasion, the non-migratory cells on the upper surface were removed by a cotton swab and the cells on the lower surface were fixed and stained with the Diff-Quick solution (Dade Behring, Deerfield, Illinois). Migrated or invaded cells in each transwell filter were counted from ten randomly chosen fields. The experiment was performed in quadruplicate and repeated three times independently.
Statistical analysis
All analyses were conducted in SAS v.9.3 (Cary, NC) at a significance level of 0.05. Cell proliferation is reported by type of serum (Normal vs. Charcoa-stripped (CS)-FBS) and cell line (E006AA-Par vs. E006AA-hT) using the mean and standard error; and displayed graphically using a mean plot. The between group comparisons of cell proliferation are evaluated using Tukey-Kramer adjusted t-tests, presented with corresponding 95% confidence intervals for the mean difference.
The tumor size was reported by mouse strain (athymic nude vs. NOG-SCID mice) and time (in weeks) using the mean and standard error; and displayed graphically using a time-series plot. Using a linear mixed model, the log-tumor-size is modeled as a function of mouse strain, time, their interaction, and a random mouse effect. All model assumptions are verified graphically using QQ- and residual-plots. The tumor growth rate comparison between mouse types is evaluated by testing the interaction term - which determines if the tumor-time relationship depends on mouse type. For each mouse strain, the overall association between tumor size and time is evaluated using F-tests, and the between time comparisons are evaluated using the appropriate least-square means t-tests. The Tukey-Kramer method is used to control the family-wise error rate.
The siRNA expression is reported by type (control vs. AR-siRNA) and cell line (E006AA-Par vs. E006AA-hT) using the mean and standard error and displayed graphically using a mean plot. The between group comparisons of cell proliferation and migration are evaluated using Tukey-Kramer adjusted t-tests, presented with corresponding 95% confidence intervals for the mean difference.
Results
In vitro growth and morphological comparison of E006AA-Par and E006AA-hT
After establishing the E006AA-hT cell line in culture from a fast-growing tumor in NOG-SCID mouse, we performed its systematic characterization and comparison with its parental cell line, E006AA. PCR-based mycoplasma detection assays detected no mycoplasma contamination in the E006AA-hT cell line. As shown in Figure 1, they have a large fibroblastic morphology with long processes and at confluence form stream of cells (Figures 1A and B). The E006AA-hT cell line grows slightly faster than the E006AA-Par cells (Figure 1C). The population doubling time was found to be approximately 18 hr, slightly less than the parental E006AA (data not shown). Like its isogenic parental cells, the E006AA-hT subline not only proliferated in serum-free medium, but also thrived in growth media with low serum concentration (1% FBS) or under an androgen-depleted culture condition in charcoal-stripped FBS and at low cell density (500 cells/cm2; data not shown) (Figure 1C). The E006AA-hT cells can routinely grow in RPMI-1640 or DMEM supplemented with 0.5% or higher FBS. E006AA-hT cell line had very good recovery and viability when cultured from the cryopreserved state and was stable in a long-term culture beyond passage 40.
DNA profile analysis of the E006AA-hT cell line
To prove the derivation of the E006AA-hT cell line, PCR-based powerplex DNA profiling was performed to amplify 16 STR loci (D5S818, D13S317, D7S820, D16S539, vWA, TH01, TPOX, CSF1PO, D18S51, D21S11, D3S1358, D8S1179, FGA, Penta-D, Penta-E, and Amelogenin), as shown in Table 1. This genomic DNA profile analysis, which examines highly polymorphic STR DNA loci, uniquely discriminates and identifies unrelated human cell lines. Amelogenin is used for gender identification. Both cell lines were compared against the most commonly used PCa cell lines including LNCaP, C4-2, C4-2B, PC-3, DU145, VCaP, 22RV1, 22Rv1, and MDA-PCa2b. There were 100% matches for allele 1 and 2 at the indicated DNA-loci between the E006AA-Par and E006AA-hT cell lines. RT-PCR analysis with species-specific β-actin and GAPDH primers verified the human-derivation of E006AA-hT cell line (Additional File 1: Supplementary Table 1 and Figure 1).
Spectral karyotyping and G-banding
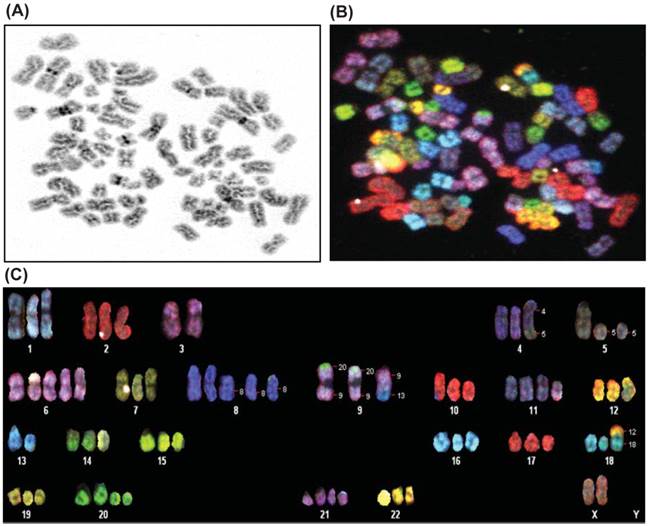
Karyotype analysis was performed on E006AA-hT cell line at passage 5 and 20 by using SKY and a conventional G-banding technique. The modal number of chromosomes per cell was 70, and the range was 60-80 chromosomes. The chromosomal distribution number/number of cells was found to be 60/2, 61/1, 63/1, 64/1, 65/2,66/2, 67/1, 68/1, 69/2, 70/3, 72/2, 74/1, and 80/1. A representative karyotype of the E006AA-hT cell line with 73 chromosomes is shown in Figure 2. In addition to the abnormal chromosome numbers, there were also a number of structural abnormalities as well. The most frequent of these were the following:70XX, der(4)t(4;5), del(5), del(8), der(9)t(9;20, a derivative of chr 9 with a small portion of chr 20 attached to the ends of both arms), der(9)t(9;13, a derivative of chr 9 containing a small portion of chromosome 13), der(11)t(2;11, a derivative of chr 11 containing a small portion of chromosome 2), der(18)t(12;18, a derivative of chr 18 containing a small portion of chr 12), and del(20). In summary, the cells are hypertriploid with additional numerical gains in chromosomes 1, 2, 4-12, 14-22, and X. Marker chromosomes of unknown origin were detected in 2 out of 20 metaphases. In addition, the E006AA-hT cell line presented with structural abnormalities such as insertion, deletion, duplication, and translocation in chromosomes 1-5, 8, 9, 11, 13, 14, 17, and 18. As in E006AA-Par cells, the Y chromosome was missing in this routine karyotype and in all other metaphases in the E006AA-hT cell line.
Spectral karyotyping of E006AA-hT cell line. A representative metaphase spread is analyzed from twenty cells and shown as an inverted DAPI-banded image at passage 5 (A), in SKY chromosome-specific classification colors (B), and after chromosomal classification (C). Note the loss of chromosome Y, duplication of the X-chromosome, trisomy of chromosomes 1, 2, 4, 7, 9, 10, 12, 14-19, and 22, and the other additional numerical gains and aberrant chromosomes.
Expression of cytodifferentiation and prostate-specific or -associated markers
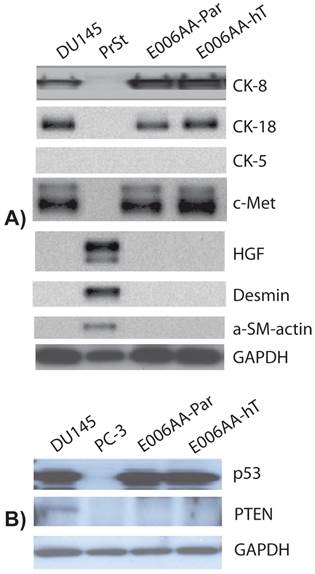
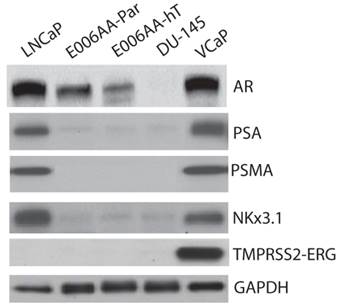
We used a comprehensive panel of markers to confirm epithelial (e.g., cytokeratin-8 (CK-8), c-Met), stromal (e.g., α-smooth muscle, desmin), and prostatic origin (e.g., PSA, PSMA, AR, Nkx3.1, TMPRSS2-ERG fusion protein) of the established, E006AA-hT cell line. As in DU145 cells, E006AA-hT cells expressed epithelial markers CK-8, CK-18, and c-Met proteins, but not the stromal markers HGF, desmin, and α-smooth muscle actin (α-SM-actin) (Figure 3A). Both cell lines did not express basal cell marker, CK-5. In addition, we demonstrated that both E006AA-Par and E006AA-hT cell lines were positive for p53, but negative for PTEN (Figure 3B). The expression of prostate-associated markers AR, PSA, PSMA, NKx3.1, and TMPRSS2-ERG were also determined by immunoblotting on whole cell lysates. VCaP cell line was used as a positive control for TMPRSS2-ERG expression. Like VCaP cell line, LNCaP cells were used as positive control for expression of other prostate-associated proteins (Figure 4). The DU145 cell line served as negative control for AR-regulated prostate-associated proteins. As expected TMPRSS2-ERG fusion protein was only detected in the VCaP cell line. Like the parental E006AA cell line, the E006AA-hT subline did not express PSA, PSMA, NKx3.1, or TMPRSS2-ERG proteins. AR expression levels in the E006AA-hT cell line were slightly less than its parental cell type.
Expression of cytodifferentiation markers. Western analysis was performed on whole cell lysate using antibodies against basal cell (cytokeratin 5), epithelial (cytokeratin-8, -18, and c-Met), and stromal (desmin, HGF, and α-SM-actin) markers. DU145 used as a positive and negative control for epithelial and stromal markers, respectively. PC-3 cell line was used as negative control for p53 and PTEN expression. PrSt, normal prostate stromal cells. GAPDH was used as protein loading control.
Expression of prostatic markers. Western analysis was performed on whole cell lysate as described in “Materials and Methods.” LNCaP and VCaP cell lines were used as positive controls and DU145 as negative control for PSA, AR, PSMA, and Nkx3.1. GAPDH was used as protein loading control.
E006AA-hT cell line is highly tumorigenic in intact NUDE and NOG-SCID mice
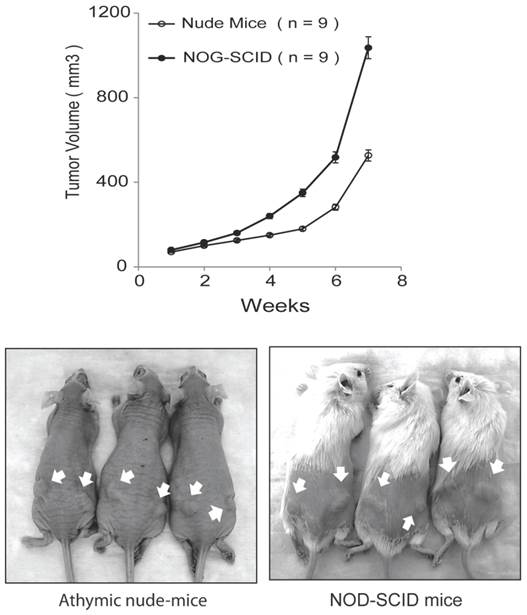
In our original studies, E006AA cells were found to be non-tumorigenic in intact male athymic nude mice [36]. Later, it was reported that subcutaneous inoculations of E006AA cells in NOG/SCID/cc mice deficient in NK, B, and T-cells led to tumor formation at an accelerated rate without regression [38]. Subcutaneous inoculation of the highly tumorigenic E006AA-hT cell line led to continuously growing tumors in all the nude and SCID mice. However, there was a significant difference in tumor growth rate in nude mice vs. NOG-SCID (P < 0.001) (Figure 5). E006AA-hT growth rate in nude mice was less than NOG-SCID mice at any time point. After four weeks of tumor inoculation, there was approximately 50% difference in tumor volume in nude mice vs. NOG-SCID mice.
E006AA-hT cells are tumorigenic in athymic nude mice and NOG-SCID mice. Subcutaneous injection of E006AA-hT cells led to continuously growing tumors in male nude (n = 9) and NOG-SCID (n = 9) mice. E006AA-hT cells were highly tumorigenic in NOG-SCID mice as compared with nude mice. Live photographs represent E006AA-hT tumor formation in athymic and NOG-SCID mice. There was significant difference in tumor growth rate between nude and NOG-SCID mice (P < 0.001). The overall association between tumor size and time was evaluated using a linear mixed model. For each mouse strain, the overall association between tumor volume and time is evaluated using F-tests, and between times comparisons are evaluated using the appropriate least-square means t-tests. Bars, Mean ± SEM.
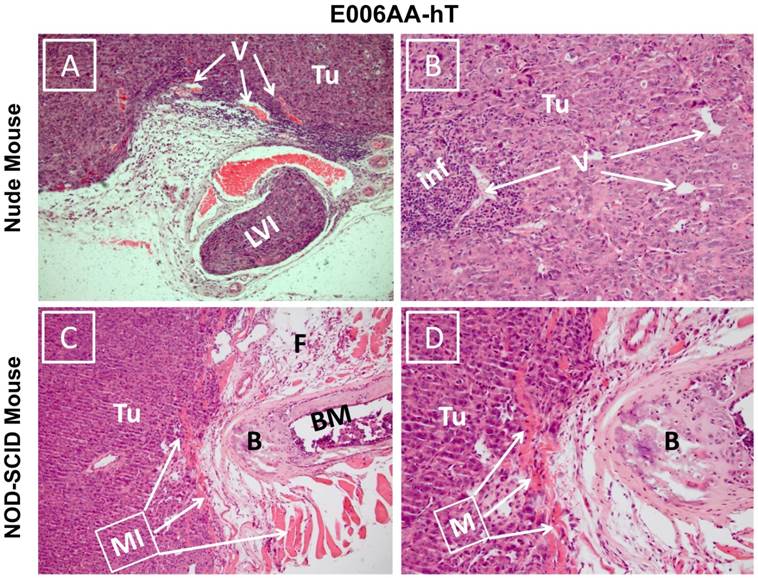
Hematoxylin and eosin stained sections showed diffuse sheets of poorly differentiated and vascularized tumors with high nuclear/cytoplasmic ratio in both nude and SCID mice (Figure 6). Desmoplastic reactions to the tumors were detected in several locations (Figure 6A). Inflammatory reaction to the tumor cells surrounding small vessels was also noticed in E006AA-hT tumor in nude mice (Figure 6B). Overall, these tumors appeared to be histologically aggressive, with invasion into lymphovascular channels (Figure 6C) and adjacent adipose tissues, skeletal muscles, bone, and cartilage (Figure 6D).
Photomicrograph of E006AA-hT tumor xenografts in athymic nude and NOD-SCID mice. Hematoxylin and eosin staining was performed on formalin-fixed and paraffin embedded tissues sections. (A and B) Diffuse sheets of poorly differentiated carcinoma with cells showing high nucleus/cytoplasmic ratio and hyperchromatic and prominent nucleoli. There is inflammatory reaction to the tumor cells around small size vessels.(C and D) Diffuse sheets of poorly differentiated carcinoma approaching the bone and invading adipose tissue and skeletal muscle. (A and C) (100 x). (B and D) (200 x). Tu, tumor cells; V, vessels; LVI, lymphovascular invasion; Inf, inflammatory cells; MI, muscle invasion; B, bone; BM, bone marrow.
Effect of AR-silencing on E006AA-Par and E006AA-hT growth, migration, and invasion
To determine whether AR is required for E006AA-hT cells growth, we decreased AR expression by transient transfection of a pool of siRNA-oligos. Parental E006AA was used for comparison. Immunoblotting confirmed about 90% reduction in AR expression in E006AA-Par and E006AA-hT cell lines (Figure 7A). Transient silencing of AR did not affect the proliferation of both cell lines (Figure 7B). This data was in agreement with a previous study that demonstrated the growth of the E006AA-Par cell line was not dependent on AR-signaling [38].
Effect of AR-silencing on growth, migration, and invasion of E006AA-Par and E006AA-hT cell lines. (A) Androgen receptor expression in cells transiently transfected with scrambled or AR-siRNA oligos. (B) Growth of transiently-transfected E006AA-Par and E006AA-hT cells. Twenty-four hours after transfection, cells were seeded at 1.0 x 10³ per well in 96-well plates and after three days proliferation were measured by MTS assay. Significant differences were only observed between the two cell lines (p < 0.001). Each data point is the average of three independent experiments; bars, Means ± SEM. Comparisons between groups were performed using Tukey-Kramer adjusted t-test. (C) In vitro migration and invasion assay. Transfected cells were subjected to migration and invasion assays as described in “Materials and Methods”. A representative photomicrograph from control- and AR-siRNA transfected cells is presented at 100× magnification using a phase-contrast microscope. (D) Cells migrated or invaded were counted from ten random fields. Each bar represented the mean ± SEM of three independent experiments, each performed in quadruplicate. The between group comparison of cell migration and invasion was evaluated using Tukey-Kramer adjusted t-tests. There was a significant difference between control- and AR-siRNA in E006AA-Par and E006AA-hT cell lines. There was also a significant difference between the two cell lines for control-siRNA and AR-siRNA.
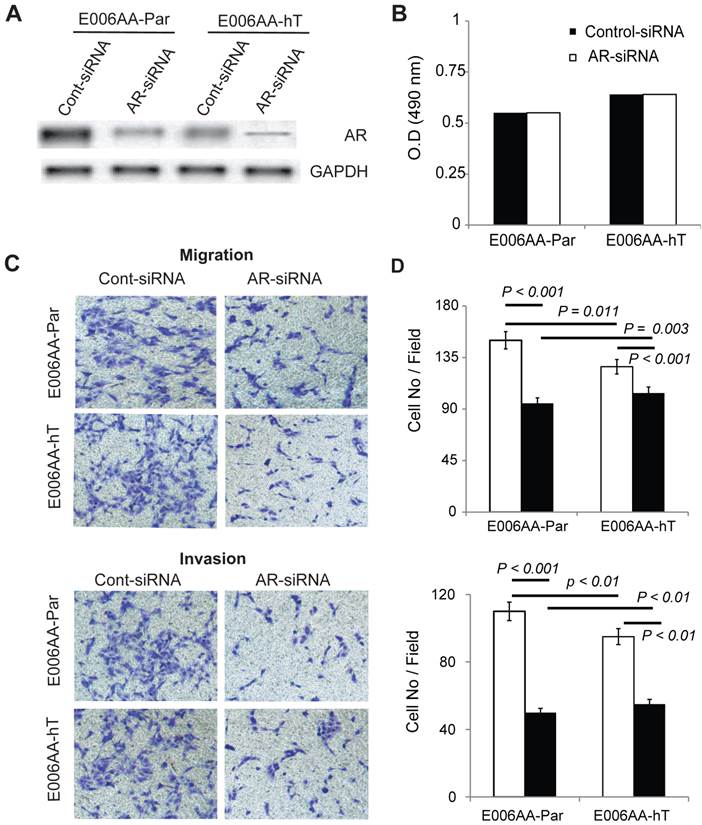
As reported before, AR is both mutated and amplified in E006AA cells [38]. Our current data and previous report demonstrated that proliferation of E006AA-Par and E006AA-hT cells is AR-independent. The relationship between AR genotype and phenotype in PCa is remains largely unknown. To test whether the mutated-AR may affect migratory ability of the cells independent of their growth characteristics, we used an in vitro migration and invasion assay. This experiment showed that AR-down regulation decreased migration by 53% in E006AA and by 20% in E006AA-hT cells. AR-silencing also decreased invasion by 55% in E006AA and by 43% in E006AA-hT cells (Figure 6C and D).
Discussion
Within the last several years, pathological, biochemical, genetic, and omic-based high-throughput investigations on PCa tissues, genomic materials, and other biospecimens have demonstrated molecular alterations that may be associated with or be considered as contributing factors for inter-racial disparities in PCa. Analyzing androgen biosynthetic and metabolic pathways has revealed differential expression levels for certain genetic variants of SRD5A2, CYP17A1, and CYP3A4 in AA men with PCa [40-44]. The TA-repeat allele of SRD5A2 was reported to be present only in high-risk AA-PCa patients, but not in CAs or Asians [40]. Inter-racial differences have also been reported in expression pattern for certain anti-apoptotic factors (e.g., Bcl-2, MDM2), chromosomal aberrations (e.g., Chromosome 8p loss in AAs), or copy number changes (e.g., changes in 11 chromosomal regions in AAs) [45, 46]. Racial disparity in tumor AR expression in men with localized PCa has also been reported [47, 48]. Immunohistochemical staining also showed that the expression of AR protein is 22% higher in the normal prostate and 81% higher in PCa in AAs than in CAs [47].
To date, almost all the data on PCa racial disparities has been collected from patients' samples, which represent a snapshot of time in the natural history of the disease with the distinct drawback of not allowing for any manipulation of the system. Therefore, the establishment and characterization of an in vitro cell-based model system in which each parameter can be varied in a logical manner would be a significant contribution to PCa racial disparity research.
In this study, we report the establishment and characterization of E006AA-hT cells as a highly tumorigenic subline of E006AA-Par. The E006AA-hT cells were morphologically similar to the E006AA-Par cell line. PCR-based powerplex DNA profiling showed that there were 100% matched for alleles 1 and 2 at the indicated 16 STR loci between the E006AA-Par and E006AA-hT cell lines. This data verified that E006AA-hT cell line is an isogenic subline of E006AA-Par cells. E006AA-hT cell proliferation was higher than the E006AA-Par cells. As it was expected due to the mutated-AR (599 Ser>Gly), proliferation of both cell lines was not affected by culturing them under androgen-deprived condition. The epithelial origin of the E006AA-hT cell line was confirmed by cytokeratin-8, -18, c-Met protooncogene receptor expression and the lack of expression of HGF, desmin, and α-SM-actin. We did not detect expression of CK-5, a basal cell marker in any of the cell lines investigated. In addition, both E006AA-Par and E006AA-hT cell lines expressed high levels of p53. However, they did not express PTEN. As with their parental cell counterpart, the E006AA-hT cell line expressed AR protein, but not other prostate-specific or -associated markers such as PSA, PSMA, Nk3x.1, and TMPRSS2-ERG fusion proteins. The early passage of the E006AA-hT cell line found to be highly tumorigenic with a 100% tumor take rate when injected with matrigel in nude and NOG-SCID mice. The E006AA-hT cell line produced tumors approximately twice as large in NOG-SCID mice as in nude mice. Contrary to a previous report, the newly established E006AA-hT cell line showed continuously growing tumor in nude mice reaching ~0.5 cm3 volume within seven weeks. In addition, E006AA-hT cells formed tumors of ~1.0 cm3 in SCID mice in just seven weeks, which was approximately twice as high as in the recently reported study [38]. Histopathological examination of the E006AA-hT tumor xenografts in both nude and SCID mice revealed cellular pleomorphisms reflecting a poorly differentiated carcinoma with high nucleus/cytoplasmic ratio, hyperchromatic nuclei, and prominent nucleoli. Biological aggressiveness of the E006AA-hT tumors was evident as demonstrated by tumor cell invasion into lymphovascular channels and infiltrating adjacent adipose tissue, skeletal muscles, bone, and cartilage. To find an explanation for the highly tumorigenic characteristics of E006AA-hT cells, we performed SKY and conventional karyotyping in the cells. We found that there was abnormal karyotyping that did not existed in the E006AA-Par cells and, as originally reported in the E006AA cell line [36, 38]. These observations led us to believe the possibility that the E006AA-hT cells have developed additional cytogenetics changes in their evolution to malignant transformation adopted for a highly tumorigenic variant both in nude and SCID mice. These cytogenetic changes and chromosomal aberrations enabled the E006AA-hT cells to form rapidly growing tumors not only in NOG-SCID triple-deficient mice, but also to survive and maintain their accelerated growth rate in nude mice that have unusually elevated levels of activated NK- and T-cells and increased immune response to xenografted tumor cells.
As described in previous studies, the AR in the E006AA cell line is mutated and genomically amplified [38]. This study also showed that after androgenic stimulation, the mutated-AR (Ser599Gly) in the E006AA cell line is able to translocate to the nucleus and binds to putative androgen-response elements (DNA-binding sites), but fails to stimulate AR-target genes expression [38]. Although the growth of E006AA-hT cells was faster than the parental cell type, it was not affected by culturing them under androgen-deprived conditions or transiently silencing the mutated-AR. This data was also in agreement with the previous study demonstrating that E006AA cell proliferation is AR-independent [38]. Overall, these studies cumulatively confirmed that serine-to-glycine AR point mutation confers a dominant-negative loss-of-function phenotype seriously disrupting certain AR-dependent signaling pathways.
The relationship between the AR genotype and phenotype in PCa is complicated and remains largely unknown. It has been reported that same AR mutations can be associated with both a “gain-of-function” in one individual and a “loss-of-function” phenotype in another individual [49]. Interestingly, transient silencing of AR significantly decreased cell migration and invasion not only in the E006AA-hT cell line, but also in its isogenic parental cell type. These data highlight the potential significance of AR mutations with “gain-of-function” phenotype that might contribute or intensify migratory abilities independent of growth characteristics in PCa. In addition, site-specific genetic alterations of AR in PCa may contribute at the same time to “loss-of-function” for a distinct phenotype (e.g., growth) and “gain-of-function” for other phenotypes (e.g., migration). Overall, these data may also support the contribution of non-genomic or post-translational events which might alter the functional consequences of AR mutations. In addition, the presence of multiple AR mutations and inter-focal heterogeneity in AR expression will further complicate the net-effect or outcome of “gain-of-function” or “loss-of-function” mutations in PCa biology and clinical outcome.
Alternative splicing of the AR gene leads to the synthesis of C-terminal truncated AR-splice variants which lack the AR ligand-binding domain. This has been shown to be as an important mechanism for the development of resistance to anti-androgens or androgen-deprivation therapy in castrate-resistant or recurrent PCa (50). Our real-time PCR analyses for the most important or commonly occurring AR variants (e.g., AR-V1, AR-V4, AR-V7/AR3, AR v567es) did not show any detectable expression in E006AA-Par and E006AA-hT cell lines.
Availability of the well-characterized AA-derived low-tumorigenic E006AA-Par cell line and its isogenic and highly tumorigenic and aggressive subline will serve as a unique in vitro cell-based model system and resources for basic and translational research in the context of racial health disparities.
Supplementary Material
Additional File 1Supplementary Figure 1 and Supplementary Table 1.
Acknowledgements
This work was supported by the National Institute of Minority Health and Health Disparity grants (R01MD005824 and R21CA183892 to S.K.) and National Cancer Institute grant (P30 CA016056 to Roswell Park Cancer Institute). The content is solely the responsibility of the authors and does not necessarily represent the official views of the National Institutes of Health, National Cancer Institute, or National Institute for Minority Health and Health Disparities. We thank Ms. Paula Jones for editorial assistance.
Competing Interests
The authors have declared that no competing interest exists.
References
1. Jemal A, Bray F, Center MM. et al. D. Global cancer statistics. CA Cancer J Clin. 2011;61:69-90
2. Siegel R, Ma J, Zou Z. et al. Cancer statistics, 2014. CA Cancer J Clin. 2014;64:9-29
3. Siegel R, DeSantis C, Virgo K. et al. Cancer treatment and survivorship statistics. CA Cancer J Clin. 2012;62:220-241
4. DeSantis C, Naishadham D, Jemal A. Cancer statistics for African Americans. CA Cancer J Clin. 2013;63:151-66
5. Karami S, Young HA, Henson DE. Earlier age at diagnosis: another dimension in cancer disparity? Cancer Detect Prev. 1997;31:29-34
6. Bunker CH. Prostate cancer risk is three-fold higher among men, aged 50-64, of African descent compared with men of Asian-Indian descent in Trinidad and Tobago. Ethn. Dis. 2002;12(S3):30-33
7. Bouchardy C, Mirra AP, Khlat M. et al. Ethnicity and cancer risk in Sao Paulo, Brazil. Cancer Epidemiol. Biomarkers Prev. 1991;1:21-27
8. Odedina FT, Akinremi TO, Chinegwundoh F. et al. Prostate cancer disparities in Black men of African descent: a comparative literature review of prostate cancer burden among Black men in the United States, Caribbean, United Kingdom, and West Africa. Infect Agent Cancer. 2009;4(suppl. 1):S2
9. Ben Shlomo Y, Evans S, Ibrahim F. et al. The risk of prostate cancer amongst Black Men in the United Kingdom: the PROCESS cohort study. Eur Urol. 2007;53:99-105
10. Bunker CH, Patrick AL, Konety BR. et al. High prevalence of screening-detected prostate cancer among Afro-Caribbeans: the Tobago Prostate Cancer Survey. Cancer Epidemiol. Biomarkers Prev. 2002;11:726-729
11. Osegbe DN. Prostate cancer in Nigerians: facts and nonfacts. J Urol. 1997;157:1340-1343
12. Gueye SM, Zeigler-Johnson CM, Friebel T. et al. Clinical characteristics of prostate cancer in African Americans, American whites, and Senegalese men. Urology. 2003;61:987-992
13. Angwafo FF 3rd, Zaher A, Befidi-Mengue R. et al. National health survey team for the national epidemiology board of Cameroon. Angwafo FF, III. High-grade intra-epithelial neoplasia and prostate cancer in Dibombari, Cameroon. Prostate Cancer Prostatic Dis. 2003;6:34-38
14. Wasike RW, Magoha GA. Descriptive case series of patients presenting with cancer of the prostate and their management at Kenyatta National Hospital, Nairobi. East Afr Med J. 2007;84:S31-S35
15. Hoffman RM, Gilliland FD, Eley JW. et al. Racial and ethnic differences in advanced-stage prostate cancer: the Prostate Cancer Outcomes Study. J Natl Cancer Inst. 2001;93:388-395
16. Evans S, Metcalfe C, Patel B. et al. Clinical presentation and initial management of black men and white men with prostate cancer in the United Kingdom: the PROCESS cohort study. Br J Cancer. 2010;102:249-354
17. Clegg LX, Reichman ME, Miller BA. et al. Impact of socioeconomic status on cancer incidence and stage at diagnosis: selected findings from the surveillance, epidemiology, and end results: National Longitudinal Mortality Study. Cancer Causes Control. 2009;20:417-435
18. Chu KC, Miller BA, Springfield SA. Measures of racial/ethnic health disparities in cancer mortality rates and the influence of socioeconomic status. J Natl Med Assoc. 2007;99:1092-1100
19. Spencer BA, Miller DC, Litwin MS. et al. Variations in quality of care for men with early-stage prostate cancer. J Clin Oncol. 2008;26:3735-3742
20. Drake BF, Lathan CS, Okechukwu CA. et al. Racial differences in prostate cancer screening by family history. Ann Epidemiol. 2008;18:579-583
21. Gross CP, Smith BD, Wolf E. et al. Racial disparities in cancer therapy: did the gap narrow between 1992 and 2002? Cancer. 2008;112:900-908
22. Freeman VL, Leszczak J, Cooper RS. Race and the histologic grade of prostate cancer. Prostate. 1997;30:79-84
23. Sobel RE, Sadar MD. Cell lines used in prostate cancer research: a compendium of old and new lines--part 1 and 2. J Urol. 2005;173:342-372 Review
24. Webber MM, Bello D, Quader S. Immortalized and tumorigenic adult human prostatic epithelial cell lines: characteristics and applications. Part I. Cell markers and immortalized nontumorigenic cell lines. Prostate. 1996;29:386-394 Review
25. Theodore S, Sharp S, Zhou J. et al. Establishment and characterization of a pair of non-malignant and malignant tumor derived cell lines from an African American prostate cancer patient. Int J Oncol. 2010;37:1477-1482
26. Gu Y, Li H, Miki J. et al. Phenotypic characterization of telomerase-immortalized primary non-malignant and malignant tumor-derived human prostate epithelial cell lines. Exp Cell Res. 2006;312:831-843
27. Weijerman PC, König JJ, Wong ST. et al. Lipofection-mediated immortalization of human prostatic epithelial cells of normal and malignant origin using human papillomavirus type 18 DNA. Cancer Res. 1994;54:5579-5583
28. Rhim JS, Webber MM, Bello D. et al. Immortalization and transformation of adult human prostate epithelial cells by a combination of HPV-18 and v-Ki-ras. Proc Natl Acad Sci U S A. 1994;91:11874-11878
29. Bright RK, Vocke CD, Emmert-Buck MR. et al. Generation and genetic characterization of immortal human prostate epithelial cell lines derived from primary cancer specimens. Cancer Res. 1997;57:995-1002
30. Iype PT, Iype LE, Verma M. et al. Establishment and characterization of immortalized human cell lines from prostatic carcinoma and benign prostatic hyperplasia. Int J Oncol. 1998;12:257-263
31. Choo CK, Ling MT, Chan KW. et al. Immortalization of human prostate epithelial cells by HPV 16 E6/E7 open reading frames. Prostate. 1999;40:150-158
32. Yasunaga Y, Nakamura K, Ewing CM. et al. A novel human cell culture model for the study of familial prostate cancer. Cancer Res. 2001;61:5969-5973
33. Nakamura K, Yasunaga Y, Ko D. et al. Cadmium-induced neoplastic transformation of human prostate epithelial cells. Int J Oncol. 2002;20:543-547
34. Cheung PY, Deng W, Man C. et al. Genetic alterations in a telomerase-immortalized human esophageal epithelial cell line: implications for carcinogenesis. Cancer Lett. 2010;293:41-51
35. Caccamo AE, Scaltriti M, Caporali A. et al. Nuclear translocation of a clusterin isoform is associated with induction of anoikis in SV40-immortalized human prostate epithelial cells. Ann N Y Acad Sci. 2003;1010:514-519
36. Koochekpour S, Maresh GA, Katner A. et al. Establishment and characterization of a primary androgen-responsive African-American prostate cancer cell line, E006AA. Prostate. 2004;60:141-152
37. Navone NM, Olive M, Ozen M. et al. Establishment of two human prostate cancer cell lines derived from a single bone metastasis. Clin Cancer Res. 1997;3:2493-2500
38. D'Antonio JM, Vander Griend DJ, Antony L. et al. Loss of androgen receptor-dependent growth suppression by prostate cancer cells can occur independently from acquiring oncogenic addiction to androgen receptor signaling. PLoS One. 2010;5:e11475
39. Hu S, Delorme N, Liu Z. et al. Prosaposin down-modulation decreases metastatic prostate cancer cell adhesion, migration, and invasion. Mol Cancer. 2010;9:30
40. Makridakis NM, Ross RK, Pike MC. et al. Association of mis-sense substitution in SRD5A2 gene with prostate cancer in African-American and Hispanic men in Los Angeles, USA. Lancet. 1999;354:975-978
41. Ntais C, Polycarpou A, Ioannidis JP. Association of the CYP17 gene polymorphism with the risk of prostate cancer: a meta-analysis. Cancer Epidemiol Biomarkers Prev. 2003;12:120-126
42. Rebbeck TR, Jaffe JM, Walker AH. et al. Modification of clinical presentation of prostate tumors by a novel genetic variant in CYP3A4. J Natl Cancer Inst. 1998;90:1225-1229
43. Paris PL, Kupelian PA, Hall JM. et al. Association between a CYP3A4 genetic variant and clinical presentation in African-American prostate cancer patients. Cancer Epidemiol Biomarkers Prev. 1999;8:901-905
44. Walker AH, Jaffe JM, Gunasegaram S. et al. Characterization of an allelic variant in the nifedipine-specific element of CYP3A4: ethnic distribution and implications for prostate cancer risk. Mutations in brief no. 191. Online. Hum Mutat. 1998;12(4):289
45. deVere White RW, Deitch AD, Jackson AG. et al. Racial differences in clinically localized prostate cancers of black and white men. J Urol. 1998;159:1979-1982
46. Jean-Gilles J, Satagopan J, Zhou Q. et al. Different chromosomal alterations correlate with gene expression in African American (AA) versus Caucasian American (CA) prostate cancer (PC) patients. Journal of Clinical Oncology; ASCO Annual Meeting Proceedings Part I. 2007;25:5000
47. Gaston KE, Kim D, Singh S. et al. Racial differences in androgen receptor protein expression in men with clinically localized prostate cancer. J Urol. 2003;170:990-993
48. Mohler JL, Gaston KE, Moore DT. et al. Racial differences in prostate androgen levels in men with clinically localized prostate cancer. J Urol. 2004;171:2277-2280
49. Gottlieb B, Beitel LK, Nadarajah A. et al. The androgen receptor gene mutations database: 2012 update. Human Mutation. 2012;33:887-894
50. Sun S, Sprenger CC, Vessella RL. et al. Castration resistance in human prostate cancer is conferred by a frequently occurring androgen receptor splice variant. J Clin Invest. 2010;120:2715-2730
Author contact
![]() Corresponding author: Dr. Shahriar Koochekpour, Departments of Cancer Genetics and Urology, Center for Genetics and Pharmacology, Roswell Park Cancer Institute, Elm and Carlton Streets, Buffalo, New York, United States of America. Tel: 716-845-3345; Fax: 716-845-1698; Email: Shahriar.Koochekpourorg.
Corresponding author: Dr. Shahriar Koochekpour, Departments of Cancer Genetics and Urology, Center for Genetics and Pharmacology, Roswell Park Cancer Institute, Elm and Carlton Streets, Buffalo, New York, United States of America. Tel: 716-845-3345; Fax: 716-845-1698; Email: Shahriar.Koochekpourorg.