Impact Factor ISSN: 1449-2288

 Global reach, higher impact
Int J Biol Sci 2015; 11(5):559-568. doi:10.7150/ijbs.10690 This issue Cite
Research Paper
ER Stress and Autophagy Dysfunction Contribute to Fatty Liver in Diabetic Mice
Quan Zhang1,4, Yan Li2, ![]() , Tingting Liang1,4, Xuemian Lu3, Chi Zhang3, Xingkai Liu4,5, Xin Jiang5, Robert C. Martin2, Mingliang Cheng1,
, Tingting Liang1,4, Xuemian Lu3, Chi Zhang3, Xingkai Liu4,5, Xin Jiang5, Robert C. Martin2, Mingliang Cheng1, ![]() , Lu Cai3,4
, Lu Cai3,4
1. Department of Infectious Diseases, Affiliated Hospital of Guiyang Medical College, Guiyang, Guizhou, China, 550004
2. Department of Surgery, School of Medicine, University of Louisville School of Medicine, Louisville, KY 40202, USA
3. Chinese-American Research Institute for Diabetic Complications RuiAn Center, the Department of Endocrinology, The Third Affiliated Hospital of Wenzhou Medical University, Ruian, Zhejiang, China, 325200
4. Kosair Children's Hospital Research Institute, the Department of Pediatrics of the University of Louisville, Louisville, KY 40202, USA
5. The First Hospital of Jilin University, Changchun, China 130021
Received 2014-10-1; Accepted 2015-1-15; Published 2015-4-2
Abstract

Diabetes mellitus and nonalcoholic fatty liver disease (NAFLD) are often identified in patients simultaneously. Recent evidence suggests that endoplasmic reticulum (ER) stress and autophagy dysfunction play an important role in hepatocytes injury and hepatic lipid metabolism, however the mechanistic interaction between diabetes and NAFLD is largely unknown. In this study, we used a diabetic mouse model to study the interplay between ER stress and autophagy during the pathogenic transformation of NAFLD. The coexist of inflammatory hepatic injury and hepatic accumulation of triglycerides (TGs) stored in lipid droplets indicated development of steatohepatitis in the diabetic mice. The alterations of components for ER stress signaling including ATF6, GRP78, CHOP and caspase12 indicated increased ER stress in liver tissues in early stage but blunted in the later stage during the development of diabetes. Likewise, autophagy functioned well in the early stage but suppressed in the later stage. The inactivation of unfolded protein response and suppression of autophagy were positively related to the development of steatohepatitis, which linked to metabolic abnormalities in the compromised hepatic tissues in diabetic condition. We conclude that the adaption of ER stress and impairment of autophagy play an important role to exacerbate lipid metabolic disorder contributing to steatohepatitis in diabetes.
Keywords: Autophagic dysfunction, ER stress, Diabetes, Diabetic liver toxicity
Introduction
Recent data increasingly support a complex interplay between the metabolic condition of diabetes mellitus and nonalcoholic fatty liver disease (NAFLD). Abnormal lipid metabolism and the over-accumulation of triglycerides (TGs) stored in lipid droplets characterize the NAFLD [1;2]. In diabetic patients, increase of free fatty acids (FFAs) in the liver accelerates the progression of fatty liver to steatohepatitis, which is characterized by steatosis, inflammation, apoptosis and fibrosis, and end-stage liver disease [3]. Although the role of metabolic disorder is under extensive investigation, the exact mechanism for the pathogenesis of diabetes compromised liver disease is largely unknown. Currently, established functions for both endoplasmic reticulum (ER) stress and autophagy in hepatic lipid metabolism and cellular injury suggest a potential mechanistic role for the interactions between diabetes and NAFLD.
ER stress is sensed by the unfolded protein response (UPR), a collection of conserved signaling pathways that lead to the adaption of the ER [4]. In eukaryotic cells, three ER resident proteins are known to sense ER stress: activating transcription factor 6 (ATF6), protein kinase RNA-like ER kinase (PERK), and inositol requiring protein 1 (IRE1) [4;5]. In unstressed cells, all three proteins are maintained in an inactive state via their association with the ER protein chaperone glucose-regulated protein 78/immuneglobulin-heavy-chain-binding protein (GRP78). Upon ER stress, GRP78 is released and sequestered on unfolded proteins, allowing activation of PERK, IRE1α, and ATF6 [6]. The signaling pathway activated by hepatic ER stress has been linked to insulin action, lipid metabolism, inflammation, and cell death in both diabetes and NAFLD [7].
Autophagy is a lysosomal degradation pathway that can degrade bulk cytoplasm and superfluous or damaged organelles to maintain cellular homeostasis. Three types of autophagy include macroautophagy, chaperone-mediated autophagy and microautophagy [8]. Autophagy can be induced by ER stresses [9] and play important roles in liver physiology and pathology [10;11]. Recent evidence indicates that autophagy selectively degrades lipid droplets, which is a process termed lipophagy[12]. Lipophagy has now been added to the mechanisms to control the hepatic lipid droplets under stresses. It has been shown that inhibition of autophagy increases TG contents in hepatocytes [12]. Treatment with rapamycin, an mTOR inhibitor/autophagy inducer, increases co-localization of lipid droplets with autophagosomes, autolysosomes and lysosomes, thereby decreases the oleic acid-induced TG levels [12;13]. Therefore, the autophagy that occurs with cellular lipid accumulation has an important impact on pathogenesis of NAFLD.
In this study, we used a diabetic mouse model to study the interplay between ER stress and autophagy contributing to the pathogenic transformation of NAFLD in a diabetic circumstance. A time course study was performed in the OVE26 mice, which generally developed severe hyperglycemia at week 2- week 3 after birth and developed continually metabolic abnormalities [14]. The aim of this study is to elucidate the potential mechanism underline the interaction between ER stress and autophagic dysfunction in term of the metabolic liver injury in the diabetic animals.
Materials and Methods
Animals
Eight-weeks-old OVE26 mice with FVB background were granted generously by Dr. Paul Epstein [15]. The OVE26 mouse was reported as a diabetic model, which exhibited severe hyperglycemia 2-3 weeks after birth due to β-cell-specific damage in response to overexpression of calmodulin transgene regulated by the insulin promoter [14]. The OVE26 strain was selected in the current study because metabolic syndrome associated increase of fatty acid synthesis and decrease of fatty acid oxidation in the OVE26 mice was reported previously [16]. The FVB mice same age as OVE26 mice were obtained from Jackson Laboratory (Bar Harbor, Maine) used as controls. The male littermates of either FVB or OVE26 mice were assigned randomly to each group. The animals were housed four per cage, given commercial chow and tap water, and maintained at 22°C and on a 12-hour light/dark cycle. For the time-course study, seven mice in each group were sacrificed at month 1, month 3, month 5 and month 8, respectively. Serum plasma and hepatic tissues were harvested for further analysis. The animal procedures were approved by the Institutional Animal Care and Use Committee of University of Louisville, which is certified by the American Association for Accreditation of Laboratory Animal Care.
Biochemical analysis
To analyze the liver injury and metabolic abnormalities in the liver, serum plasma alanine aminotransferase (ALT), serum glucose, serum insulin, serum and liver triglyceride (TG) were determined. The serum ALT measured using an ALT infinity enzymatic assay kit (Thermo Fisher Scientific Inc., Waltham, MA), according to the instruction provided. Serum insulin was detected using an ultra sensitive mouse insulin ELISA kit (Crystal chemical incorporation, IL, USA), according to the instruction provided. Serum glucose assay was performed using a Sigma assay kit (Sigma-Aldrich Company, MI). TG assay was performed with TG assay kit (Cayman Chemical Company, CA).
Histopathology
The harvested liver tissues were fixed in 10% buffered formalin and then cut into 2-3 mm length segments to perform dehydration in graded alcohol series. The dehydrated tissues were cleared using xylene, embedded in paraffin, and sectioned at 5𝜇m slices. Hematoxylin and eosin (H&E) staining was performed in each animal to investigate the histopathological damage in the liver. The images were reviewed and analyzed under microscope at 20x magnification. A chloroacetate esterase staining kit (CAE; Sigma-Aldrich) was used to facilitate visualization of neutrophils as per manufacturer guidelines. Neutrophils numbers were counted in the 20x fields chosen randomly from different regions of tissue sections.
Oil Red O staining
Lipid accumulation in the diabetic liver tissues was further analyzed. Cryosections from OCT-embedded tissue samples of the liver (10 mm thick) were fixed in 4% buffered formalin for 5 minutes at room temperature, and stained with Oil Red O for 1 hour. The images were reviewed and analyzed under microscope at 20x magnification.
Western blot assay
The components in ER stress signaling and autophagy signaling were analyzed by Western blot as described previously [17]. Electrophoresis was performed on 12% SDS-PAGE gel and the proteins were transformed to nitrocellulose membrane. The membranes were incubated with different primary antibodies overnight at 4°C and with secondary antibody for 1 hour at room temperature. The antigen-antibody complexes were then visualized using ECL kit (Amersham, Piscataway, NJ, USA). The primary antibodies were used including the antibodies against TGFβ, TNFα, ICAM1, CTGF, GRP78, ATF6, CCAAT/enhancer-binding protein-homologous protein (CHOP) caspase-12, (Santa Cruz Biotechnology, Santa Cruz, CA), microtubule-associated protein 1 light-chain 3(LC3) BII, P62, p70 S6 Kinase (for total p70 S6 kinase protein detection), Phospho-p70 S6 Kinase, caspase-8, Bax and Bcl-2 (Cell Signaling Technology).
Immunofluorescent and immunohistochemical analysis
The LC3BII distribution in the liver was visualized by immunofluorescent staining in the frozen tissue sections. In brief, the tissue sections were incubated in 5% goat serum for 30 min to block non-specific reaction. Then the tissue sections were incubated with primary antibody against LC3BII (Cell Signaling Technology) at 1: 300 dilution overnight at 4°C. Cy3-coupled goat anti-rabbit IgG secondary antibody was used as antibody (1: 300 dilution in PBS) for 2 h in room temperature, and sections were then stained with DAPI at 1: 1000 dilution to localize the nucleus. LC3BII expression in the hepatic tissues was observed under the fluorescent microscope (Olympus 1×51) (Olympus, Pittsburgh, PA). Cell proliferation was determined by immunohistochemical analysis in the paraffin embedded liver tissue sections. Endogenous peroxidase was blocked with 3% hydrogen peroxide, and then incubated in 5% bovine serum for 30 min to block non-specific reaction. The tissue sections were incubated with primary antibody against proliferating cell nuclear antigen (PCNA) (Signaling Technology, Danvers, MA, USA) at 1: 300 dilution overnight at 4°C. Tissue sections were incubated with horseradish peroxidase-conjugated secondary antibody (1: 100 dilution in PBS) for 2 hours in room temperature. For the color development, sections were incubated with peroxidase substrate DAB kit (Vector Laboratories, Inc., Burlingame, CA, USA). The counterstaining was performed by using hematoxylin. All the images were reviewed and analyzed under microscope at 20x magnification. PCNA index was quantitatively analyzed by counting the percentage of PCNA positive cells in the sections from ten fields at 20X magnification.
Terminal deoxynucleotidyl transferase-mediated dUTP nick end labeling (TUNEL) assay
TUNEL staining was performed using an ApopTag Peroxidase In Situ Apoptosis Detection Kit (Chemicon, Billerica, CA). Briefly, each slide was deparaffinized, rehydrated, and treated with proteinase K (20 mg/L) for 15 min. The tissue sections were incubated with terminal deoxynucleotidyl transferase (TdT) and digoxigenin-11-dUTP for 1 hour at 37°C. Anti-digoxigenin antibody conjugation with horseradish peroxidase (HRP) along with the substrate (DAB-H2O2) was used to develop a brown color. Apoptotic cell death was quantitatively analyzed by counting the percentage of TUNEL positive cells in the sections from ten fields at 20X magnification.
Statistical analysis
Data were collected from repeated experiments and were presented as mean ± SD. One-way ANOVA was used to determine if difference exists. If so, a post hoc Turkey's test was used for analysis for the difference between groups, with Origin 7.5 laboratory data analysis and graphing software. Statistical significance was considered as p<0.05.
Results
Chronic liver injury in the diabetic mice
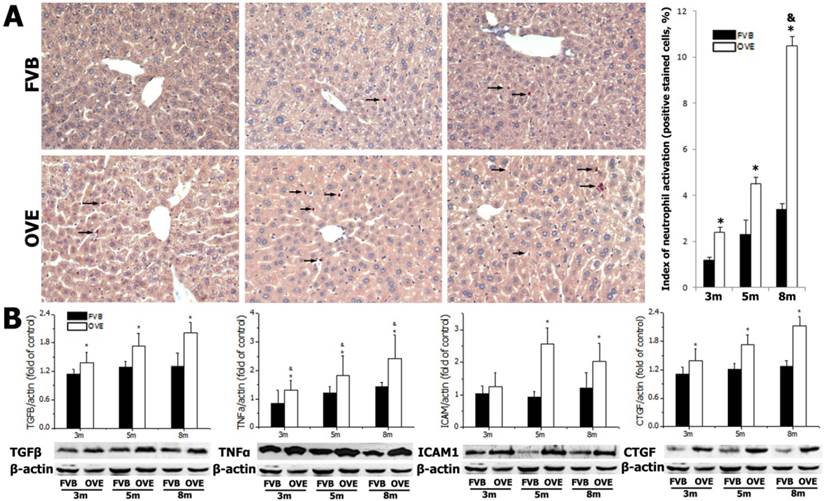
Diabetes causes damages in multiple organs, more common in the heart and kidney, because of the metabolic syndrome. However, the diabetes associated metabolic liver injury was received less attention previously. We evaluated the dynamic changes in term of liver injury in the diabetic OVE26 mice. The H&E results showed that there was no significantly morphological abnormality at month 1 and 3, but abnormal morphological at month 5 and more severe morphological abnormality at month 8 in the liver from OVE26 mice. The pathological study revealed that there were a multifocal distribution of irregular, lager volume and empty bubble-like lipid drops inside hepatocytes. Steatohepatitis was characterized by inflammatory infiltration and lipid drops in OVE26 mice compared to the FVB controls (Fig 1A). There was a slight increase of serum ALT level in the OVE26 mice aged month 1, however the levels of serum ALT were significantly increased in the OVE26 mice aged 3, 5 and 8 months (Fig 1B).The increased levels of serum ALT activity is consistent with the severity of steatohepatitis. Naphthol-AS D chloroacetate was used as the substrate to detect esterase presented in the activated neutrophils. Increased number of activated neutrophils was detected in the liver tissues from OVE26 mice at both month 5 and month 8, implying proinflammatory state in the liver tissues of OVE26 mice at later stages (Fig 2A). Interestingly, the neutrophils showed a pattern of aggregated distribution in the liver tissues of the OVE26 mice at month 8, consisting to the severe morphological abnormalities. Further analysis indicated that protein levels of proinflammatory cytokines (TGFβ, TNFα, ICAM1, and CTGF) by Western blot were also increased in the liver tissues of OVE26 mice in later stages (Fig 2B).
(A) The pathological changes by H&E staining. m: mouse age in months. OVE: OVE26. (B) Serum ALT levels in the OVE26 mice as well as the FVB controls. Data are presented as mean ± SD (n ≥ 7 mice at least in each group). * P<0.05 compared to FVB controls; & P <0.05 compared to OVE mice aged 1 month.

(A) detection of neutrophils by chloroacetate esterase staining in liver tissues. Arrow: positive stained neutrophils. m: mouse age in months. OVE: OVE26. (B) Western blot analysis of proinflammatory cytokines (TGFβ, TNFα, ICAM1, and CTGF) in the liver tissues from OVE26 mice as well as the FVB controls. Data are presented as mean ± SD. * P<0.05 compared to FVB controls; & P <0.05 compared to OVE mice aged 3 month.
Metabolic abnormalities in the diabetic mice
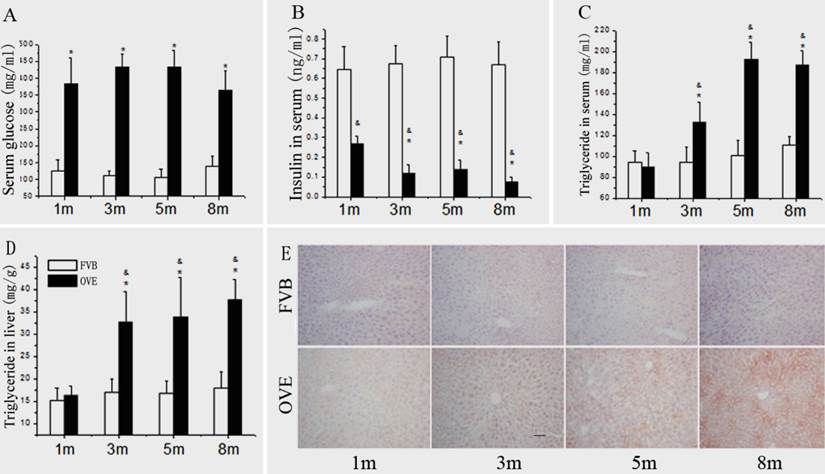
Because the metabolic disorder could be the central mechanism for diabetic liver injury and progression of steatohepatitis, blood glucose, insulin level, TG levels and hepatic lipid accumulation were further evaluated. Compared to FVB mice, blood glucose was significantly increased in the OVE26 mice. The blood glucose levels maintained at 375 - 425 mg/dL throughout entire experimental duration (Fig 3A). There was a significant decrease of serum insulin level in the OVE26 mice compared to the FVB controls (Fig 3B), which consisted to the previous reports [15;16]. The serum TG level was slightly decreased in the OVE26 mice at month 1, but significantly increased from month 3 to month 8 compared to that in the FVB controls (Fig 3C). The hepatic TG level in OVE26 mice was slightly increased started at month 1, but became significantly increased from month 3 to month 8 compared to the FVB controls (Fig 3D). The hepatic lipid accumulation status was further evaluated in the liver tissues of OVE26 mice by Oil red O staining. As shown in Fig 3E, the positive staining was found in the OVE26 mice. The trend of lipid accumulating identified by Oil red O staining is consisted to liver TG level, which increased from month 3 to month 8.
(A) The serum glucose levels, (B) serum insulin levels, (C) serum TG levels and (D) hepatic TG levels in the OVE26 mice as well as the FVB controls. (E) Hepatic lipid accumulation by Oil Red O staining. Data are presented as mean ± SD. m: mouse age in months. OVE: OVE26. * P<0.05 compared to FVB controls; & P <0.05 compared to OVE26 mice aged 1 month.
ER stress in the liver of OVE26 mice
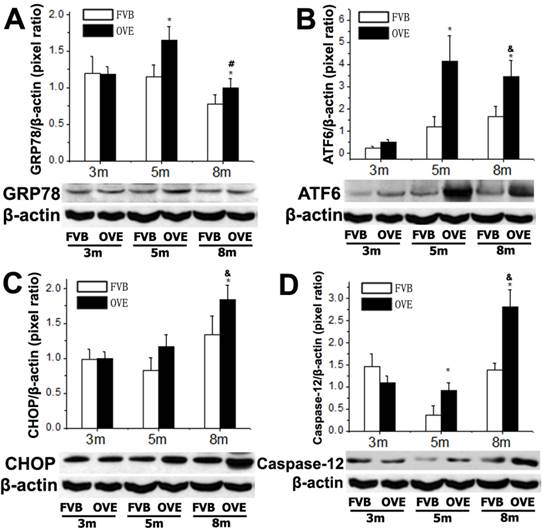
To investigate a putative link between the liver metabolic injury and hepatic ER stress, we firstly examined the expression of GRP78 and ATF6, which were crucial not only in ER stress but also lipid biogenesis [18;19]. The ER protein chaperone, GRP78 protein level was significantly increased at month 5 but significantly decreased at month 8 (Fig 4A), suggesting loss of the ability to active the ER stress sense proteins such as ATF6 at the later stage of diabetes. As expected, ATF6 protein level was significantly increased in OVE26 mice at month 5 but decreased at month 8, which is consisting to the expression pattern of GRP78 (Fig 4B). The deficiency of both ATF6 and GRP78 indicated that cells were unable to restore the unfolded proteins in the ER lumen in later stage of diabetes. As we know, excessive or adverse stress to the ER could trigger apoptosis in the cells, we further investigated two important apoptotic executioners, CHOP and caspase-12, which are closely related to ER stress. CHOP is a member of the C/EBP family of transcription factors. Under physiological conditions, the expression of CHOP is very low, but it will be significantly up-regulated in response to ER stress [20]. Caspase-12 located on ER and can be specifically activated by stimuli that elicit ER stress[21]. Importantly, CHOP and caspase-12 are critical executioners involved in the ER stress and mediated apoptosis. Our results indicated that the expression of CHOP (Fig 4C) was significantly increased at month 8, similarly, caspase-12 expression (Fig 4D) was also increased at month 8. These results indicated that the activation of the UPR following ER stress happened in early stage of diabetes in the OVE26 mice. However, the loss of the ability to restore the unfolded or misfolded proteins in the ER lumen happened in the later stag of diabetes, and trigged apoptotic mediators such as CHOP and caspase-12 to remove the abnormal cells. In this circumstance, the clearance mechanism such as autophagy to keep cellular homeostasis could be involved during progression of metabolic disorder in the diabetic liver.
(A-D) The expression of GRP78, ATF6, CHOP and caspase-12 were detected by Western blotting assay. Data are presented as mean ± SD. m: mouse age in months. OVE: OVE26. * P<0.05 compared to FVB controls. & P <0.05 compared to OVE26 mice aged 3 month. # P <0.05 compared to OVE mice aged 5 month.
Dysfunction of autophagy in the liver of OVE26 mice
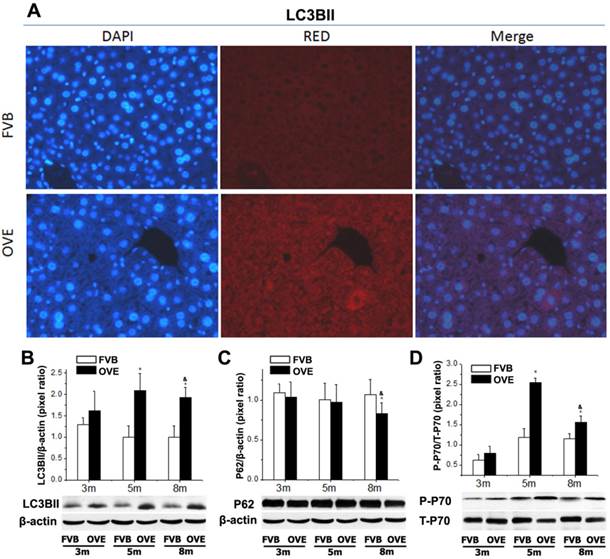
The clearance routes for the deleterious unfolded/misfolded proteins are not only endoplasmic reticulum-associated degradation (ERAD) but also ER stress-activated autophagy. If not timely removed, the unfolded/misfolded proteins can be toxic to cells to trigger cell death. Therefore, autophagy could play a very important role in keeping cellular homeostasis in the compromised liver caused by metabolic abnormalities of diabetes. The autophagy signaling components including LC3BII, P62, phospho-p70 S6 Kinase (P-p70) and total p70 S6 kinase (T-p70) were further evaluated. LC3BII, an important autophagy effector associate with lipid droplets movement, was reported being concentrated in autophagosome membranes during the autophagic process [22]. Therefore, we firstly investigated the cytoplasmic distribution of LC3BII in the hepatocytes by immunofluorescent staining. As shown in the Fig 4A, positive staining of LC3BII represented by red fluorescence extensively diffused in the hepatocytes of OVE26 mice, whereas no fluorescence signaling of LC3BII was detected in the same age FVB controls (Fig 5A). To study the dynamic changes, the protein levels of LC3BII were further quantified by Western blot. The hepatic LC3BII protein levels in the all OVE26 mice were higher than that in the same age FVB controls, which consisted to the result of fluorescence staining. Interestingly, the hepatic LC3BII level in the OVE26 mice was significantly increased at month 5 compared to that at month 3, but the increase was blunted at month 8 (Fig 5B), implying a compromised autophagy function. Since changes in LC3BII levels could be caused by either autophagosome formation or degradation in lysosomes, and this issue needed to be clarified. P62 is an important component in the autophagy signaling. It has been shown that the aggregating p62 and ubiquitinylated proteins serve as a nucleating scaffold for autophagosome biogenesis [23]. In addition, p62 can bind directly to LC3 proteins via a specific sequence motif, and acts as autophagy receptors for ubiquitinated proteins [24]. P62 is also required for the aggregation of ubiquitinylated proteins and delivers ubiquitinylated cargos to the proteasome [25]. Therefore, p62 was further evaluated by Western blot in the OVE26 mice and FVB controls. Our results showed decreased P62 expressions in the OVE26 mice at month 5 and month 8 compared to the same aged FVB controls (Fig 5C), which provided further evidence of autophagy dysfunction because of loss of autophagosome biogenesis. mTOR/p70S6K signaling pathway plays an important role in regulation of autophagy [26]. It has been shown that an mTOR independent p70S6K inhibitor prevents LC3-I conversion to LC3-II, a critical process in autophagosome formation, in the situation of massive autophagy [27]. Therefore, we next examined the mTOR substrates p70S6K levels in the hepatic tissues of OVE26 mice. The expressions of phospho-p70S6K and total p70S6K proteins were analyzed by Western blot and the ratio of phospho-p70S6K and total p70S6K was determined. The results showed that phospho-p70S6K protein level was up-regulated significantly at month 5 but the increase was blunted at month 8 in the liver tissues of OVE26 mice (Fig 5D), implying less autophagosomes formation in the liver at later stage of diabetes. All these results suggested suppression of hepatic autophagy in the later stage of OVE26 mice, and the dysfunction of autophagy was associated with the lipid metabolic abnormalities by diabetes.
(A) The images of immunofluorescent staining for detection of LC3BII expression. (B-D) The expressions of LC3BII, P62, T-p70 and P-P70 were detected by Western blotting assay. Data are presented as mean ± SD. m: mouse age in months. OVE: OVE26. P-p70: phospho-p70 S6 Kinase; T-p70: total p70 S6 kinase. * P<0.05 compared to FVB controls. & P <0.05 compared to OVE26 mice aged 3 month.
Increased proliferation and decreased apoptosis in the liver of OVE26 mice
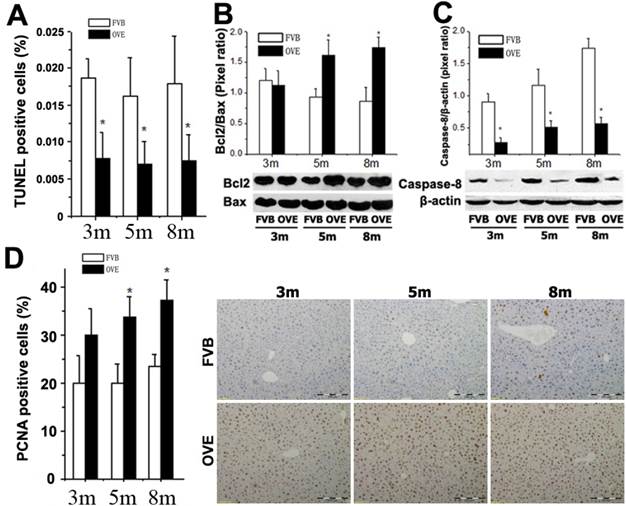
ER stress-activated autophagy could be associated with various signaling pathways regarding the hepatic damage and fatty liver progression. The above findings prompted us to further explore the events regarding metabolic liver injury underlying the ER stress and autophagy dysfunction. We sought to examine the caspase-dependent apoptotic cell death in the liver of OVE26 mice. Surprisingly, inhibition of apoptosis was fund in the OVE26 mice (Fig 6A). Interestingly, analysis of Bcl-2, Bax and caspase-8, as one of mitochondrial cell death pathway, disclosed a synergistic increase in the Bcl-2/Bax ratio (Fig 6B) and decrease of caspase-8 (Fig 6C) in the OVE26 mice aged from 3 months to 8 months. The exact mechanism for the suppression of apoptosis in the liver under diabetic circumstance needs to be further studied. However, our data suggested that the dysfunction of autophagy may, at least partly, keep the hepatocytes from autophagy-related apoptotic cell death in the later stage of diabetes in the OVE26 mice. In contrast, a significant increase of PCNA expression by immunohistochemical staining was observed in the liver tissues of OVE26 mice (Fig 6D). PCNA helps hold DNA polymerase epsilon to DNA [28]. Since DNA polymerase epsilon is involved in resynthesis of excised damaged DNA strands during DNA repair [29], increased PCNA levels suggesting repetitive hepatocytes damage and DNA repair happened during metabolic liver injury by diabetes.
(A) Quantitative analysis of apoptotic cell death in the liver tissues by TUNEL staining. (B and C) The expressions of Bax, Bcl-2, and caspase-8 were detected by Western blotting assay. (D) Quantitative analysis of hepatocytes proliferation and representative images of positive PCNA staining. m: mouse age in months. OVE: OVE26. Data are presented as mean ± SD (n = 7 in each group). * P<0.05 compared to FVB controls.
Discussion
In the present study, we, for the first time, revealed steatohepatitis consisting of alterations of morphology, lipid accumulation, and increased activated neutrophils and proinflammatory cytokines in the hepatic tissues of diabetic OVE26 mice. The finding of steatohepatitis in OVE26 mice led to further examination of the involvement of the signals of ER stress and autophagy during the pathological transformation.
A growing body of evidence suggests that ER stress plays an important role in hepatic lipogenesis. In the present study, we found that hepatic ER stress occurred in the diabetic liver associated with activation of UPR, which is a fundamental function to restore ER homeostasis. The UPR is an adaptive cellular process that when dysregulated can perpetuate endoplasmic reticulum stress. It was demonstrated that development and/or exacerbation of hepatic steatosis in the context of chronic diseases involve selective impairments to the UPR that reduce the ability of the UPR to resolve ER stress [30;31]. Thus, the presence of steatohepatitis in the later stage of diabetic mice implies that the ability to resolve ER stress and restore the cellular function has been compromised. In fact, the persistent elevation of CHOP in OVE26 mice, being highest at month 8, can be indicative of unresolved ER stress [32]. The UPR sensors themselves are also involved in the hepatic lipogenesis and lipid store. All three proximal UPR sensors—PERK, IRE1α, and ATF6α can regulate lipid stores in the liver [18]. In this study, although increased expressions of ATF6 and GRP78 are shown in OVE26 mice in earlier stage, the lower protein levels of ATF6 and GRP78 at month 8 were found compared to those at month 5. ATF6 is an ER-membrane bound transcription factor, which inhibits the transcriptional activity of sterol regulatory element-binding protein (SREBP) to reduce lipid stores in the liver [33], thus the decreased protein level of ATF6 in later stage of diabetic liver may not be adequate to function well, thereby cause lipid acculmation in the liver. This result is consistent to a recent observation, in which ATF6-deficient mice showed increased SREBP1c associated with a tendency for a higher degree of steatosis in the liver [34]. Simultaneously, decreased GRP78 protein is shown at month 8 in OVE26 mice. Because ATF6 targets GRP78 transcriptionally [35], the possible explanation of the decreased GRP78 protein could be reduction in transcription, translation and rapid degradation, and further studies are required to address this process in detail.
Beside the ER stress, recent evidence also strongly supports a role for autophagy in the regulation of lipid homeostasis in hepatocytes. Hepatocyte lipid accumulation is associated with decrease of hepatic autophagic function [12]. In the present study, the LC3BII protein levels were showed adaptive increases at month 3 and month 5, but decreased at month 8 in the OVE26 mice. LC3BII is one of the best characterized components of the autophagosomes which specifically localized to autophagic structures throughout the process from phagophore to lysosomal degradation [36]. The decreased protein level of LC3BII in later stage of diabetes could be associated with reduced autophagosome turnover, perhaps due to delayed trafficking to the lysosomes, and reduced fusion between compartments or impaired lysosomal proteolytic activity. Therefore, our result indicated an impairment of lipid droplets movement contributing to the accumulation of lipid in the hepatocytes. In addition, decreased level of P62, a cellular metabolic switch in autophagy, was found in the diabetic liver. Evidence suggested that p62 represses adiposity [37]. It is likely that p62 carries out additional roles on the hepatic adipogenesis. Because cells required p62 to activate mTORC1 [38], and the loss of p62 may increase adipogenesis whereby the mechanism that mTORC1 activates adipogenesis by regulating the expression of the key adipogenic transcriptional regulator SREBP. Furthermore, the mTOR/p70S6K signaling is a good gate-keeper of autophagy [39] because it mediates a series of substrates to regulate the level of autophagy. In our study, Phospho-p70S6K was significantly increased at month 5, but decreased at month 8, providing a further proof that the compromised autophagy was unable to degrade and clean the hepatocellular triglyceride which was accumulated in the liver of diabetic mice.
Given the importance of ER stress and autophagy in the hepatic lipid metabolism, it is also important to understand cellular homeostasis in the pathological state of steatohepatitis. In general, sustained or massive ER stress leads to apoptosis, however inhibition of apoptosis was found in the OVE26 liver. The antiapoptotic protein Bcl-2 was slightly increased at month 3, but significantly increased at month 5 and 8. In contrast, caspase-8 was significantly decreased at all three time points. As we know, Bcl-2 is localized on the ER membrane and regulates Ca2+ homeostasis. When faced with persistent ER stress, the adaptation starts to fail. Calcium release from the ER can activate calpains, which proteolytically activates caspase-12, an endoplastic reticulum resident caspase, to mediate apoptosis [40]. Interestingly, higher level of caspase-12 protein was observed, but very a few apoptotic cells were detected in later stage of diabetes. The explanation for this discrepancy could be the lack of the downstream apoptotic effectors such as caspase-8, which is crucial for triggering apoptosis by death receptors since its recruitment to and activation at the DISC is the decisive step to initiate the caspase cascade [41]. Loss of caspase-8 has been proposed as a possible mechanism of apoptosis resistance [42].
In conclusion, the diabetic condition induces ER stress in the liver. The adaption of ER stress and impairment of autophag play an important role to exacerbate lipid metabolic disorder contributing to steatohepatitis.
Acknowledgements
This work was supported by Natural Science foundation of Guizhou Educational Department No. 2011037, and partly by American Diabetes Association Basic Science Award, Grant # 1-13-BS-109.
Competing Interests
The authors have declared that no competing interest exists.
References
1. Cusi K. Role of insulin resistance and lipotoxicity in non-alcoholic steatohepatitis. Clin Liver Dis. 2009;13:545-63
2. Cheung O, Sanyal AJ. Abnormalities of lipid metabolism in nonalcoholic fatty liver disease. Semin. Liver Dis. 2008;28:351-59
3. Festi D, Colecchia A, Sacco T, Bondi M, Roda E, Marchesini G. Hepatic steatosis in obese patients: clinical aspects and prognostic significance. Obes Rev. 2004;5:27-42
4. Walter P, Ron D. The unfolded protein response: from stress pathway to homeostatic regulation. Science. 2011;334:1081-86
5. Rutkowski DT, Kaufman RJ. A trip to the ER: coping with stress. Trends Cell Biol. 2004;14:20-8
6. Zhang K, Kaufman RJ. From endoplasmic-reticulum stress to the inflammatory response. Nature. 2008;454:455-62
7. Eizirik DL, Cardozo AK, Cnop M. The role for endoplasmic reticulum stress in diabetes mellitus. Endocr Rev. 2008;29:42-61
8. Mehrpour M, Esclatine A, Beau I, Codogno P. Autophagy in health and disease. 1. Regulation and significance of autophagy: an overview. Am. J. Physiol Cell Physiol. 2010;298:C776-85
9. Singh R, Cuervo AM. Autophagy in the cellular energetic balance. Cell Metab. 2011;13:495-504
10. Yin XM, Ding WX, Gao W. Autophagy in the liver. Hepatology. 2008;47:1773-85
11. Ding WX. Role of autophagy in liver physiology and pathophysiology. World J. Biol. Chem. 2010;1:3-12
12. Singh R, Kaushik S, Wang Y, Xiang Y, Novak I, Komatsu M. et al. Autophagy regulates lipid metabolism. Nature. 2009;458:1131-35
13. Mei S, Ni HM, Manley S, Bockus A, Kassel KM, Luyendyk JP. et al. Differential roles of unsaturated and saturated fatty acids on autophagy and apoptosis in hepatocytes. J. Pharmacol. Exp. Ther. 2011;339:487-98
14. Zheng S, Noonan WT, Metreveli NS, Coventry S, Kralik PM, Carlson EC. et al. Development of late-stage diabetic nephropathy in OVE26 diabetic mice. Diabetes. 2004;53:3248-57
15. Epstein PN, Overbeek PA, Means AR. Calmodulin-induced early-onset diabetes in transgenic mice. Cell. 1989;58:1067-1073
16. Proctor G, Jiang T, Iwahashi M, Wang Z, Li J, Levi M. Regulation of renal fatty acid and cholesterol metabolism, inflammation, and fibrosis in Akita and OVE26 mice with type 1 diabetes. Diabetes. 2006;55:2502-9
17. Jiang X, Zhang C, Xin Y, Huang Z, Tan Y, Huang Y. et al. Protective effect of FGF21 on type 1 diabetes-induced testicular apoptotic cell death probably via both mitochondrial- and endoplasmic reticulum stress-dependent pathways in the mouse model. Toxicol Lett. 2013;219:65-76
18. Pagliassotti MJ. Endoplasmic reticulum stress in nonalcoholic fatty liver disease. Annu. Rev. Nutr. 2012;32:17-33
19. Bakker W, Eringa EC, Sipkema P, van Hinsbergh VW. Endothelial dysfunction and diabetes: roles of hyperglycemia, impaired insulin signaling and obesity. Cell Tissue Res. 2009;335:165-89
20. Oyadomari S, Mori M. Roles of CHOP/GADD153 in endoplasmic reticulum stress. Cell Death. Differ. 2004;11:381-9
21. Nakagawa T, Zhu H, Morishima N, Li E, Xu J, Yankner BA. et al. Caspase-12 mediates endoplasmic-reticulum-specific apoptosis and cytotoxicity by amyloid-beta. Nature. 2000;403:98-103
22. Kabeya Y, Mizushima N, Ueno T, Yamamoto A, Kirisako T, Noda T. et al. LC3, a mammalian homologue of yeast Apg8p, is localized in autophagosome membranes after processing. EMBO J. 2000;19:5720-8
23. Fujita N, Morita E, Itoh T, Tanaka A, Nakaoka M, Osada Y. et al. Recruitment of the autophagic machinery to endosomes during infection is mediated by ubiquitin. J. Cell Biol. 2013;203:115-28
24. Lippai M, Low P. The role of the selective adaptor p62 and ubiquitin-like proteins in autophagy. Biomed Res Int. 2014; 2014:832704. doi: 10.1155/2014/832704. Epub. 2014Jun12:832704
25. Komatsu M, Waguri S, Koike M, Sou YS, Ueno T, Hara T. et al. Homeostatic levels of p62 control cytoplasmic inclusion body formation in autophagy-deficient mice. Cell. 2007;131:1149-63
26. Datan E, Shirazian A, Benjamin S, Matassov D, Tinari A, Malorni W. et al. mTOR/p70S6K signaling distinguishes routine, maintenance-level autophagy from autophagic cell death during influenza A infection. Virology. 2014;452-453:175-90
27. Marmy-Conus N, Hannan KM, Pearson RB. Ro 31-6045, the inactive analogue of the protein kinase C inhibitor Ro 31-8220, blocks in vivo activation of p70(s6k)/p85(s6k): implications for the analysis of S6K signalling. FEBS Lett. 2002;519:135-40
28. Shivji KK, Kenny MK, Wood RD. Proliferating cell nuclear antigen is required for DNA excision repair. Cell. 1992;69:367-74
29. Essers J, Theil AF, Baldeyron C, van Cappellen WA, Houtsmuller AB, Kanaar R. et al. Nuclear dynamics of PCNA in DNA replication and repair. Mol Cell Biol. 2005;25:9350-59
30. Sabio G, Cavanagh-Kyros J, Ko HJ, Jung DY, Gray S, Jun JY. et al. Prevention of steatosis by hepatic JNK1. Cell Metab. 2009;10:491-8
31. Rutkowski DT, Wu J, Back SH, Callaghan MU, Ferris SP, Iqbal J. et al. UPR pathways combine to prevent hepatic steatosis caused by ER stress-mediated suppression of transcriptional master regulators. Dev Cell. 2008;15:829-40
32. Rinella ME, Siddiqui MS, Gardikiotes K, Gottstein J, Elias M, Green RM. Dysregulation of the unfolded protein response in db/db mice with diet-induced steatohepatitis. Hepatology. 2011;54:1600-9
33. Zeng L, Lu M, Mori K, Luo S, Lee AS, Zhu Y. et al. ATF6 modulates SREBP2-mediated lipogenesis. EMBO J. 2004;23:950-58
34. Usui M, Yamaguchi S, Tanji Y, Tominaga R, Ishigaki Y, Fukumoto M. et al. Atf6alpha-null mice are glucose intolerant due to pancreatic beta-cell failure on a high-fat diet but partially resistant to diet-induced insulin resistance. Metabolism. 2012;61:1118-28
35. Yamamoto K, Yoshida H, Kokame K, Kaufman RJ, Mori K. Differential contributions of ATF6 and XBP1 to the activation of endoplasmic reticulum stress-responsive cis-acting elements ERSE, UPRE and ERSE-II. J Biochem. 2004;136:343-50
36. Yang Z, Klionsky DJ. Mammalian autophagy: core molecular machinery and signaling regulation. Curr Opin Cell Biol. 2010;22:124-31
37. Rodriguez A, Duran A, Selloum M, Champy MF, Diez-Guerra FJ, Flores JM. et al. Mature-onset obesity and insulin resistance in mice deficient in the signaling adapter p62. Cell Metab. 2006;3:211-22
38. Duran A, Amanchy R, Linares JF, Joshi J, Abu-Baker S, Porollo A. et al. p62 is a key regulator of nutrient sensing in the mTORC1 pathway. Mol Cell. 2011;44:134-46
39. Wang CW, Klionsky DJ. The molecular mechanism of autophagy. Mol Med. 2003;9:65-76
40. Yoneda T, Imaizumi K, Oono K, Yui D, Gomi F, Katayama T. et al. Activation of caspase-12, an endoplastic reticulum (ER) resident caspase, through tumor necrosis factor receptor-associated factor 2-dependent mechanism in response to the ER stress. J Biol Chem. 2001;276:13935-40
41. Kantari C, Walczak H. Caspase-8 and bid: caught in the act between death receptors and mitochondria. Biochim Biophys Acta. 2011;1813:558-63
42. Eggert A, Grotzer MA, Zuzak TJ, Wiewrodt BR, Ho R, Ikegaki N. et al. Resistance to tumor necrosis factor-related apoptosis-inducing ligand (TRAIL)-induced apoptosis in neuroblastoma cells correlates with a loss of caspase-8 expression. Cancer Res. 2001;61:1314-19
Author contact
![]() Corresponding author: Yan Li, MD, PhD, Department of Surgery, Division of Surgical Oncology, University of Louisville School of Medicine, 511 S Floyd ST MDR Bldg Rm326A, Louisville, KY 40202. Phone: 502-852-7107; E-mail: Yan.liedu or Mingliang Cheng, MD, Department of Infectious Diseases, Affiliated Hospital of Guiyang Medical College, Guiyang, Guizhou Province, China 550004. Phone: 86-851-6752795; E-mail: chengmlcom
Corresponding author: Yan Li, MD, PhD, Department of Surgery, Division of Surgical Oncology, University of Louisville School of Medicine, 511 S Floyd ST MDR Bldg Rm326A, Louisville, KY 40202. Phone: 502-852-7107; E-mail: Yan.liedu or Mingliang Cheng, MD, Department of Infectious Diseases, Affiliated Hospital of Guiyang Medical College, Guiyang, Guizhou Province, China 550004. Phone: 86-851-6752795; E-mail: chengmlcom