Impact Factor ISSN: 1449-2288
- Issue 12; 2026
- Issue 11; 2026
- Issue 10; 2026
- Issue 9; 2026
- Issue 8; 2026
- Volume 22; 2026
- Past Issues
- Advance Articles
- Editorial Board
- Cover Images
- Index & Coverage
- Cover Suggestion
- Special Issues
Introduction
Materials and Methods
Results
Discussion
Supplementary Material
Abbreviations
Acknowledgements
References

 Global reach, higher impact
Int J Biol Sci 2015; 11(7):726-736. doi:10.7150/ijbs.12009 This issue Cite
Research Paper
Ionizing Radiation Impairs T Cell Activation by Affecting Metabolic Reprogramming
Heng-Hong Li1, 2 ![]() , Yi-wen Wang1, Renxiang Chen1, 2, Bin Zhou3, Jonathan D. Ashwell4, Albert J. Fornace Jr.1,3,5
, Yi-wen Wang1, Renxiang Chen1, 2, Bin Zhou3, Jonathan D. Ashwell4, Albert J. Fornace Jr.1,3,5
1. Department of Biochemistry and Molecular & Cellular Biology, Georgetown University, Washington, DC 20057, USA
2. Institute of Radiation Medicine, Chinese Academy of Medical Sciences and Peking Union Medical College, Tianjin 300192, China
3. Department of Oncology, Georgetown University Medical Center, Washington, DC 20057, USA
4. Laboratory of Immune Cell Biology, Center for Cancer Research, National Cancer Institute, National Institutes of Health, Bethesda, MD 20892, USA
5. Center of Excellence in Genomic Medicine Research (CEGMR), King Abdulaziz University, Jeddah 22254, Saudi Arabia
Received 2015-2-27; Accepted 2015-5-10; Published 2015-5-15
Abstract

Ionizing radiation has a variety of acute and long-lasting adverse effects on the immune system. Whereas measureable effects of radiation on immune cell cytotoxicity and population change have been well studied in human and animal models, little is known about the functional alterations of the surviving immune cells after ionizing radiation. The objective of this study was to delineate the effects of radiation on T cell function by studying the alterations of T cell receptor activation and metabolic changes in activated T cells isolated from previously irradiated animals. Using a global metabolomics profiling approach, for the first time we demonstrate that ionizing radiation impairs metabolic reprogramming of T cell activation, which leads to substantial decreases in the efficiency of key metabolic processes required for activation, such as glucose uptake, glycolysis, and energy metabolism. In-depth understanding of how radiation impacts T cell function highlighting modulation of metabolism during activation is not only a novel approach to investigate the pivotal processes in the shift of T cell homeostasis after radiation, it also may lead to new targets for therapeutic manipulation in the combination of radiotherapy and immune therapy. Given that appreciable effects were observed with as low as 10 cGy, our results also have implications for low dose environmental exposures.
Keywords: metabolic reprogramming, metabolomics, mass spectrometry, UPLC-QTOF, ionizing radiation, TCR activation
Introduction
Upon antigen stimuli, T cell receptor (TCR) activation signal triggers T cells from a resting state to an activated state featured by rapid cell growth and boosted production of cytokines. The two-signal model of T cell activation, in which signal 1 is delivered by TCR engagement and signal 2 by costimulatory receptors, was originally proposed by Bretscher and Cohn [1]. Recently, costimulatory signaling has been closely connected to metabolic reprogramming, a process in which changes in metabolism in activated T cells allows them to meet requirements for adequate supplies of bioenergy and precursors for biomass synthesis [2]. In contrast to resting T cells, which generate ATP mainly through oxidative phosphorylation (OXPHOS) fueled by catabolic pathways, activated T cells increase anabolic processes, such as amino acid and fatty acid synthesis [3, 4]. Glucose uptake and consumption are markedly enhanced in activated T cells through transcriptional regulation by Myc [5]. One of the metabolic signatures of activated T cells is the accumulation of lactate from pyruvate, the product of glycolysis, in the presence of sufficient oxygen [6], which is also referred to as the Warburg effect. T cells with incompetent metabolic reprogramming may not complete the transition from quiescence to activation and are either removed or become unresponsive to mitogenic stimulation [7].
Extensive efforts have been made to elucidate the key role of metabolic reprogramming in T cell activation [8, 9] and differentiation [10, 11], and to determine the important molecules [12] involved in this process. State-of-art metabolomics technologies have recently been applied in T cell activation and function research. In the study by Wang et al. [5], metabolomic profiling provided direct and convincing evidence to support the key role for Myc in metabolic reprogramming upon T cell activation. Metabolomics is a rapidly evolving field that aims to identify and quantify the changes in concentration of all metabolites (i.e., the metabolome) in a biological sample. Global metabolic profiling of cells, or tissues, in relation to external stimuli is now sufficiently mature to join the ranks of the other -omics fields, and adds another dimension to dissect biological networks.
The objective of this study is to delineate the effects of ionizing radiation (IR) on T cell function by studying alterations on TCR-mediated activation in viable cells. Lymphocytes are among the cell types most sensitive to radiation-induced injury. It is well known that lethality of T cells occurs within hours after irradiation (interphase death) [13, 14], and IR causes long-term adverse effects on T cell immunity. Epidemiologic data from the A-bomb cohort found long-lasting immune dysfunction and perturbed T cell homeostasis [15-17]. Higher hepatitis B surface antigen positivity was associated with radiation exposure in A-bomb survivors, and HBV infection in this cohort tended to remain in an active state [18].
Although measureable effects of IR on T cell cytotoxicity and population change have been well studied in human and animal models [19-21], little is known about the functional alterations of the surviving immune cells after IR. We investigated how IR impacts T cell function with highlight on modulations of the mode of metabolism during activation in addition to traditional cellular immune endpoints. For the first time we determined how IR impacts metabolic reprogramming during T cell activation by applying a metabolomics approach.
Materials and Methods
Animals and irradiation
All animal protocols used in this study were approved by the Georgetown University Animal Care and Use Committee. Adult (10-12 weeks old) wild type (wt) C57BL/6 male mice purchased from the Jackson Laboratory (Bar Harbor, ME) were used in these studies. Mice were placed into a mouse pie cage for 0.1, 0.5, or 3 Gy total body irradiation (TBI) with a Cs-source research irradiator. The dose rate was 1.7Gy/min. Animals were euthanized at indicated time points after radiation.
Purification of T cells
Spleen and lymph nodes (inguinal/axillary/brachial lymph nodes) were collected from mice for T cell purification. Cells were isolated by using cell strainers and recovered in phenol red free RPMI1640 complete medium (1% L-Glutamine, 5% HEPES, 1% NEAA, 1% Sodium Pyruvate, 50 μM 2-ME and 0.1% Gentamycin) with 10% FBS. Spleen cells were suspended in lysis buffer to remove erythrocytes. The reaction was neutralized with RPMI1640 complete medium and washed with RPMI1640 complete medium twice. Cell pellets were re-suspended in RPMI1640 complete medium to ready for T cell purification. T cell purification using EasySepTM Mouse T cell Enrichment kit (Stemcell Technologies, Vancouver, Canada) was performed following the manufacturer's instruction. More than 95% of the purified cells were T cells as determined by CD3+ staining.
Phenotypic analysis of T cells by flow cytometry
Direct immunofluorescence cell staining was performed using the following cell surface marker antibodies: CD4-FITC, CD8-APC, CD44-APC/Cy7, and CD62L-PacificBlue (all BioLegend, San Diego, CA). Stained cells were analyzed using a FACSAria (Beckton-Dickinson, Mountain view, CA). FACS data were analyzed using FCS Express V3 (De Novo Software, Los Angeles, CA) software.
TCR stimulation and proliferation assay
T-cell proliferation assays were carried out in 96-wells tissue culture plates pre-coated with anti-CD3 mAb (5 μg/μl, overnight at 4°C). For CFSE staining assay, purified T lymphocytes (2x 10⁵ cells/well) were cultured in RPMI1640 complete medium containing 0.5% FBS with or without CFSE dye (carboxyfluorescein succinimidyl ester) in the presence of anti-CD28 mAb (1 μg/μl) at 37°C in 5% CO2 incubator. Cells were harvested at indicated time points (40, 48, 60, or 72 hours). CSFE staining was performed by using CellTraceTM CFSE Cell Proliferation Kit from Life Technologies (Carlsbad, CA). To quantitate the distribution of T cells in each division, markers were set in CFSE histogram for each generation, the cell number in defined division was obtained, and the percentage was calculated. For other assays, T cells were cultured in RPMI1640 complete medium containing 10% FBS with the addition of anti-CD28 mAb. After 48hr incubation, supernatants were collected for cytokine analysis. Cell viability was measured using a MTT Assay Kit (Cayman Chemical, Ann Arbor, MI) at 72hr after TCR stimulation.
Determination of INF-γ proteins
Levels of INF-γ in cell culture supernatant were measured by using ELISA kits from R&D Systems (Minneapolis, MN) following the manufacturer's instructions.
RNA isolation and qRT-PCR
RNA from harvested T cells was extracted using RNeasy Mini kit (Qiagen, Valencia, CA). A quantitative RT-PCR (qRT-PCR) assay was performed using iScript one-step RT-PCR kit for probes (Bio-Rad, Hercules, CA). The primers and probe mix of the Taqman gene expression assay for Glut1, and c-Myc were purchased from ABI (Foster city, CA). 18S rRNA was used as the internal control. Data were analyzed with the iCycler software. The amount of target genes' RNA was subsequently calculated and normalized to the standard curve and internal control.
Glucose uptake, Glycolysis and ATP assays
Glucose uptake, glycolysis, and intracellular ATP level were measured by using Glucose Uptake Cell-Based Assay Kit (Cayman Chemical, Ann Arber, MI), Glycolysis Cell-Based Assay Kit (Cayman Chemical, Ann Arber, MI), and ATP Colorimetric/Fluorometric Assay Kit (GeneTex Inc., San Antonio, TX), respectively, following manufacturers' instructions for the detail procedures.
Metabolomics profiling by UPLC-QTOF
Snap-frozen T cell pellets were suspended in 150 μl of H2O (HPLC grade) and sonicated for 10 seconds. The sonicated samples were kept on ice. Equal volume of chilled 100% acetonitrile spiked with 2 mM debrisoquine sulfate and 30 mM 4-nitrobenzoic acid (4-NBA), were then added to each sample and followed by 20 minutes of centrifugation at 13,000 rpm at 4°C. Supernatant was then transferred to a clean tube, and dried by a speed vacuum VacufugeTM (Eppendorf, New York). The pellet was resuspended in 200 μl of 5% acetonitrile for metabolomics profiling. For metabolomics profiling, 2 μl samples were injected onto a reverse-phase ACQUITY BEH C18 50 × 2.1mm 1.7μm column (Waters Corp, Milford, MA) using an ACQUITY UPLC system (Waters Corp, Milford, MA). The chromatographic and mass spectrometric parameters can be found in our previous study [22]. All chemicals were of the highest purity available and reagents used were of LC-MS grade and obtained from Sigma-Aldrich (St. Louis, MO).
Metabolomics data processing and statistical analysis
Raw mass spectrometric data were processed using MarkerLynx (Waters Corp, Milford, MA) or XCMS (The Scripps Center for Metabolomics, La Jolla, CA) to generate a data matrix that consisted of the retention time, m/z value, and the normalized peak area. Intensity data was normalized by cell number. Multivariate data analysis was applied to the matrix through the chemometric software SIMCA-P+ (Umetrics, Umea, Sweden). All centroid data were Pareto scaled to decrease noise and increase the importance of low-abundance ions in the followed Principal Component Analysis (PCA) analysis. Heatmap for the differential ions was generated using MetaboAnalyst (http://www.metaboanalyst.ca) [23]. The KEGG, HMDB, Lipid Maps, and BioCyc databases were utilized to find putative matches based on the accurate mass. Metabolic pathway information from KEGG as well as BioCyc was further utilized for creating pathway hit histograms and enrichment significance graphs [24]. Identities of selected ions were confirmed by comparison of retention time and MS/MS fragmentation pattern with authentic standards.
Statistical analysis
Experimental values are presented as mean ± SD. Statistical analysis was performed using GraphPad Prism (San Diego, CA). The significance of metabolite intensities and mRNA levels was determined using two-tailed student t-test.
Results
T cells from irradiated animals have low proliferative capacity and cytokine production upon TCR-mediated stimulation
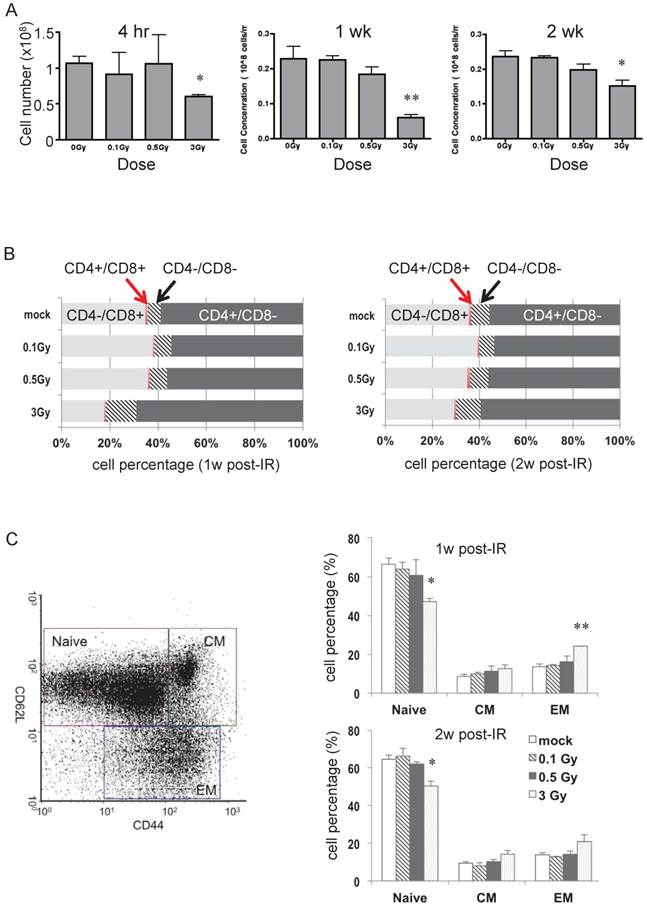
Wild type C57BL/6 (B6) male mice were irradiated with 0.1, 0.5, or 3 Gy, and spleen and lymph nodes were collected 4 hr, 1 week, and 2 weeks later. Fig. 1A shows the change in numbers of splenocytes after radiation. At all three times, only 3 Gy caused a statistically significant decrease in the number of splenocytes, with the greatest loss at 1 week after IR. To assess possible changes in T cell subpopulations, cell surface markers were examined using flow cytometry. The distribution of CD4+ and CD8+ cells in isolated T cells was not affected in response to 0.1 or 0.5 Gy, whereas 3 Gy caused notable differences at 1- and 2-weeks post radiation (Fig. 1B). The percentage of CD4+CD8- (Th) cells increased and that of CD4-/CD8+ (Tc) cells declined, consistent with the understanding that Tc are more sensitive than Th to radiation damage [21]. The percentage of the CD4-/CD8- (DN) subpopulation increased after 3 Gy of IR (Fig. 1B). This is consistent with the previous findings that gamma/delta T cells are more resistant than alpha/beta T cells to IR-induced acute cytotoxicity [25, 26]. Naïve, central memory (CM), and effector memory (EM) T cell subpopulations determined by CD44 and CD62L double-staining (Fig. 1C) showed that the percentage of naïve cells in the total T cell pool dropped after 3 Gy of radiation and memory T cells had a slight increase at the 1 and 2 week time points.
Dose effects at various time points after irradiation on splenocytes and T cells. (A) Total number of splenocytes in mice after radiation at indicated doses and time points (n = 4 mice/group). (B) Distribution of various subgroups in isolated T cells based on CD4 and CD8 cell surface marker staining (n = 4 mice/group). (C) Distribution of naïve and memory cells in isolated T cells. The left panel depicts a representative flow-cytometric analysis of CD62L and CD44 cell surface marker staining. “CM” stands for central memory T cells and “EM” stands for effector memory T cells. The right panel is the percentage of each T cell subgroup determined after radiation (n = 4 mice/group). * P value < 0.05, ** P value < 0.01.
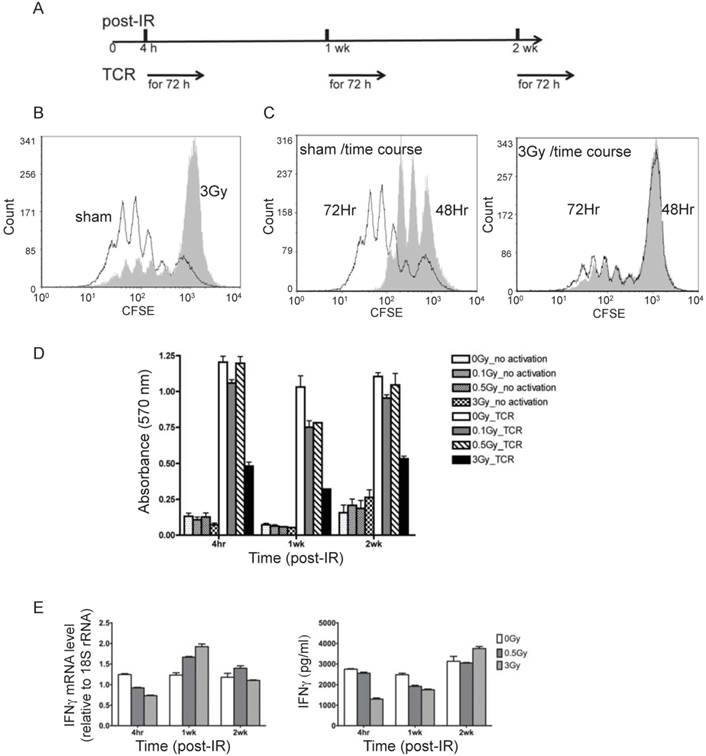
To examine the physiological process of T cell activation, direct TCR cross-linking was used. As outlined in Fig. 2A, T cells isolated from spleen and lymph nodes at various times after irradiation were subjected to in vitro TCR-mediated stimulation for 72 hr. It should be noted that dead cells are efficiently cleared in vivo prior to collection of T cells, and very little if any necrotic or apoptotic cells remain at the times of the analyses, which was confirmed by trypan blue staining (data not shown). Proliferation as measured by CFSE dilution (Fig. 2B and 2C), cell viability by MTT (Fig. 2D), and measurements of cytokine production (Fig. 2E) were carried out to assess the immunocompetency of T cells isolated from irradiated mice. CFSE staining is used to monitor lymphocyte proliferation, both in vitro and in vivo, due to the progressive halving of CFSE dye within daughter cells following each cell division. As shown in Fig. 2B and 2C, 4 hr after irradiation the 3 Gy dose caused a remarkable decline in subsequent T cell proliferation in response to TCR stimulation in vitro, whereas 0.1 and 0.5 Gy did not result in significant inhibition (overlay of CFSE staining of sham-treated and radiated cells (0.1, 0.5, and 3 Gy) is shown in Supplementary Figure 1). CFSE staining showed that only a very small portion of T cells from 3 Gy-irradiated mice proliferated after TCR stimulation, and the majority of T cells in the irradiated group remained unresponsive (Fig. 2C). The distribution of T cell divisions is shown in Table 1. The results indicate that less than 30% of T cells proliferated in the 3 Gy group compared to over 85% in the sham control by 72 hr after TCR stimulation. The CFSE staining data in Fig. 2 and Table 1 were obtained with T cells collected 4 hr after radiation. The proliferation assay performed on T cells harvested at two weeks post-radiation showed the similar pattern (data not shown).
T cells from irradiated animals show lower proliferation and cytokine production upon TCR stimulation. (A) Experimental plan for TCR activation assay. (B) Overlay of CFSE histograms of TCR stimulated T cells from sham control (open histogram) and 3Gy radiated mice (grey filled histogram). The cells were harvested at 72 hours after TCR-mediated stimulation. (C) Overlay of CFSE histograms of TCR stimulated T cells at two time points, 48 hours (open histogram) and 72 hours (grey filled histogram) after TCR-mediated stimulation. The left and right panels display the overlaid histograms of T cells from sham control and 3Gy radiated mice respectively. (D) Cell viability measured by MTT assay at 72 hr after TCR stimulation. (E) Gene expression (left panel) and excreted protein levels (right panel) of the representative cytokines, IFNγ, measured by qRT-PCR in T cells and ELISA in culture supernatant respectively.
In vitro proliferation results of T cells isolated from irradiated mice at 4 hours post-IR. T cells were harvested at 72 hours after TCR stimulation, CFSE histograms were obtained by flow cytometry and analyzed with FCS software.
| 4 hr post-IR | Distribution of T cells with respect to the number of divisions they have undergone (%) | |||||
|---|---|---|---|---|---|---|
| Dose | 0 | 1 | 2 | 3 | 4 | 5 |
| 0Gy | 11.3 | 6.4 | 12.0 | 21.7 | 24.7 | 20.7 |
| 0.1Gy | 12.9 | 6.6 | 12.8 | 17.8 | 21.7 | 23.0 |
| 0.5Gy | 19.3 | 6.1 | 11.1 | 16.4 | 20.4 | 22.2 |
| 3Gy | 70.1 | 5.9 | 6.3 | 7.3 | 5.4 | 3.6 |
The MTT assay measures the activity of NAD(P)H-dependent oxidoreductase and the NAD(P)H flux in cells. In addition to decreased proliferation, these activities were substantially decreased after TCR stimulation in the previously irradiated cells (3Gy in Fig. 2D). Mild decrease was also observed for lower doses (0.1 and 0.5Gy in Fig.2D). Expression of IFN-γ gene and the level of IFN-γ protein in the culture medium were determined by qRT-PCR and ELISA respectively at 48 hours after TCR stimulation (Fig. 2E). In the absence of TCR, IR did not cause any detectable change of the level of IFN-γ protein (Supplementary Figure 2).
Characterization of global metabolomic changes in activated T cells using a LC-MS approach
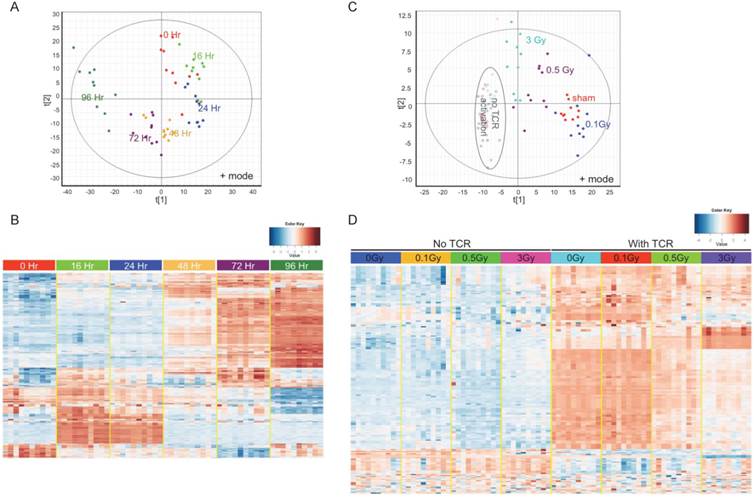
To answer the question whether IR impairs T cell activation by disturbing metabolic reprogramming following TCR stimulation, an UPLC-QTOF metabolomic profiling method was set up to delineate the metabolomic changes in activated T cells. Isolated T cells were subjected to in vitro TCR-mediated activation and harvested for metabolomic profiling at different times. TCR-mediated stimulation induced striking changes in the T cell metabolome, and these changes had a strong time-dependent pattern (Fig. 3). Fig. 3A is a Principle Components Analysis (PCA) score plot of ESI positive mode data, which showed T cells that were activated for different durations longer than 16 hr separate distinctly from control (0 Hr). Fig. 3B is a heatmap of statistically different metabolites. Fully activated T cells (72 Hr and 96 Hr) showed extensive differences versus unstimulated and the early time points (16 Hr and 24 Hr), which suggests a metabolic transition between early and late stages of TCR-mediated activation. The change in levels of several representative ions that have been validated by MS/MS are shown in Supplementary Figure 3. As the metabolic profiles were markedly different at 72 hr after TCR-mediated stimulation, this time point was used in the following metabolomics study to investigate the effect of IR.
Metabolomics profiling reflects metabolic reprogramming by TCR activation, which is perturbed by radiation. (A) & (B), Multivariate data analysis of the metabolomic profiles of TCR stimulated mouse T cells: (A) Principle components analysis (PCA) unsupervised clustering plots of TCR activation for control (0Hr) and five time points as indicated. Data for positive mode are shown. (B) Heatmap of metabolites with significantly differing abundance between control and any of the five time points studied. (C) & (D) Multivariate data analysis of the metabolomic profiles of T cells from sham control and irradiated mice: (C) PCA plot of T cells without (open circles) or with (solid spots) TCR activation. (D) Heatmap of the metabolites with significantly different abundance between control and irradiated cells either with or without TCR activation. In (C) & (D), activated T cells were harvested at 72 hr post TCR stimulation.
TCR activation induced metabolomic changes are remarkably altered in a dose-dependent manner after IR
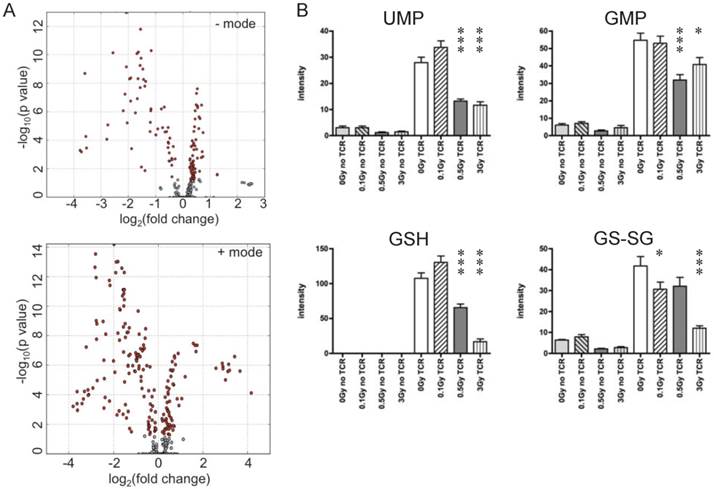
T cells were isolated from irradiated and sham-irradiated control mice at 4 hr following radiation. Cells subjected to TCR-mediated activation were harvested after 72 hr for metabolomics profiling. PCA of ESI positive mode data (Fig. 3C) and the heatmap of differential metabolites (Fig. 3D) are shown. In both plots, unstimulated experimental groups that were exposed to radiation showed little difference compared to the unstimulated control (empty circles in Fig. 3C representing “no TCR activation”). However, the metabolomics profile of activated T cells showed dramatic differences after radiation exposure, especially at the doses of 0.5 and 3 Gy. It is noteworthy that there were no statistically significant changes in collected splenocyte cell numbers observed at any time point measured for exposures of 0.1 or 0.5 Gy (Fig. 1A), which indicates that cell death was not the major cause of the effects of low dose radiation on lymphoid tissues. The volcano plots of both negative and positive modes are shown in Fig. 4A, which displayed significance, i.e. -log(p-value), of the paired analysis of 3 Gy and sham control versus its fold-change. These volcano plots showed that many metabolites had a strong and highly significant decrease in the 3 Gy group compared to sham control. Initial identification of the metabolites was conducted through searches of the publicly available online databases, KEGG, HMDB, Lipid Maps, and BioCyc, and verification was performed through tandem mass spectrometry (MS/MS) against pure chemicals. The identification of metabolites that showed significant decreases in 3 Gy samples and their associated metabolic pathways are listed in Table 2. Ions that were validated by MS/MS compared with the pure chemicals are indicated by asterisks. Fig. 4B depicts the dose-dependent alteration of four representative metabolites in TCR-activated T cells. All these metabolites showed remarkable decreases after IR of 0.5 or 3 Gy, while 0.1 Gy caused mild increases for two of the metabolites. The MS/MS fragmentation patterns of the pure chemicals and the detected ions of these four metabolites are shown in Supplementary Figure 4.
Ions with significantly different levels in activated T cells exposed to IR. (A) Volcano plots of metabolites. Y-axis and X-axis represent -log10(p value) and fold-change of the paired analysis of 3Gy vs. sham control, respectively. (B) Levels of representative metabolites that show remarkable changes after TCR activation; all four metabolites were validated. Y-axis represents the UPLC-QTOF intensity data with arbitrary unit. * P value<0.05, *** P value < 0.001.
Identification of differential metabolites and associated metabolic pathways. * Metabolites with asterisk have been validated by MS/MS.
| Differential metabolites | Mode | m/z |
|---|---|---|
| Amino acid metabolism | ||
| Arginine * | + | 175.1190 |
| Aspartic acid * | - | 132.0292 |
| Glutamic acid * | - | 146.0447 |
| Proline * | + | 116.0705 |
| Leucine | + | 132.1013 |
| Pyrimidine/Purine metabolism | ||
| Guanosine * | - | 282.0837 |
| Hypoxanthine * | + | 137.0457 |
| GMP * | - | 362.0501 |
| UMP * | - | 323.0281 |
| Cytosine | + | 112.0502 |
| Uracil | + | 113.0343 |
| AMP | +/- | 348.0703 / 346.0548 |
| Uridine | - | 243.0613 |
| Inosine | - | 267.0728 |
| dAMP | - | 330.0598 |
| Glutathione metabolism | ||
| GSH * | - | 308.0915 |
| GSSG * | +/- | 613.1602 / 611.1456 |
| Spermidine * | + | 146.1648 |
| Glycolysis/energy metabolism | ||
| Lactate | - | 89.0233 |
| Citric acid | - | 191.0184 |
| Fatty acid metabolism | ||
| Carnitine | + | 162.1123 |
| Signaling molecule | ||
| Glutamate * | - | 146.0447 |
IR exposure has an adverse effect on TCR-triggered metabolic reprogramming
To understand how IR affects metabolic reprogramming upon T cell activation, the mRNA level of Myc was measured after TCR activation. Myc is a key transcriptional factor that directly regulates several processes of metabolic reprogramming, such as glucose uptake, glycolysis, glutaminolysis, and multiple biosynthetic pathways. It is known that both the transcriptional and protein levels of Myc are quickly induced upon T cell activation and reach high levels as early as 24 hr after TCR-mediated stimulation [5]. The expression level of Myc in the inactivated and activated T cells were compared and lower Myc mRNA levels were observed in T cells isolated from irradiated mice than those from the sham control (Fig. 5A). The downstream genes regulated by Myc, including Glut1, HK2, and Ldha, which are involved in glucose uptake and glycolysis in T cells, were measured at several time points after TCR activation to reflect the dynamic changes (Fig.5B). The results show that prior radiation significantly lowered the mRNA level of these genes in activated T cells.
Alteration of key processes in metabolic reprogramming of activated T cells in response to IR. T cells were isolated from mice at 4 hr after radiation. (n = 4 mice/group). (A) mRNA level of Myc in activated T cells. T cells isolated from control or irradiated mice were subjected to in vitro TCR stimulation. Cells were collected to determine the mRNA level of Myc by qRT-PCR. Myc expression was measured at 24 hr after TCR stimulation. (B) Expression of Glut1, HK2, and Ldha was assayed at the indicated time points after TCR stimulation. (C) Top panel, glucose uptake was measured at 48 hr post TCR stimulation; bottom panel, glycolysis was assayed at indicated time points after TCR stimulation. (D) Intracellular ATP level was determined at 48 hr post TCR stimulation. * P value < 0.05, ** P value < 0.01.
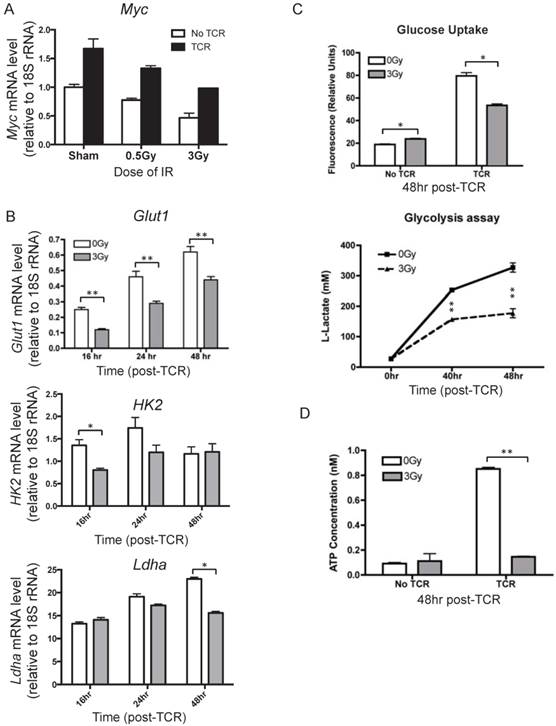
Glucose uptake, glycolysis, and ATP production in activated T cells were assessed as well. It is known that Glut1 is a major glucose transporter expressed on T cells. Consistent with the decreased Glut1 induction, glucose uptake was found to be significantly lower in TCR-stimulated T cells in the irradiated group than in sham control (Fig. 5C, top panel). The majority of glucose in activated T cells is metabolized through glycolysis and released as lactate. Glycolysis was assessed after TCR-mediated activation by measuring the concentration of lactate in the supernatant (Fig. 5C, bottom panel). IR resulted in dramatic decreases of lactate levels, with an approximate 50% decrease from sham control at the 48 hr time point. With the understanding that one of the major objectives of metabolic reprogramming is to provide sufficient energy supplies for cell activation and proliferation, we determined whether radiation affected cellular ATP concentration. IR exposure caused a clear decrease in ATP levels in activated T cells (Fig. 5D). Taken together, the results in Fig. 5 indicate that IR compromises metabolic reprogramming, inhibits glucose uptake and glycolysis, and results in significantly lower energy production upon T cell activation.
Discussion
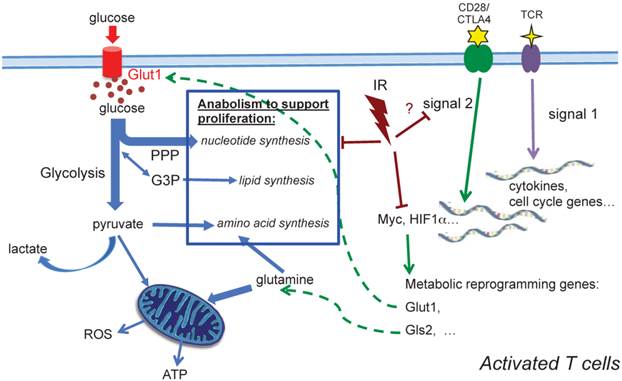
Our observations demonstrate that TCR activation-associated metabolic reprogramming was impaired after radiation. The major essential metabolic pathways for activation, such as amino acid metabolism, nucleotide metabolism, fatty acid metabolism, and glutathione metabolism (Table 2) were substantially affected in the T cells exposed to in vivo radiation. The mRNA level of Myc, the transcription factor that mediates the changes driving metabolic reprogramming upon T cell activation [5], was markedly lower in T cells that had been exposed to radiation (Fig. 5A). Expression of Glut1, the major glucose transporter in peripheral T cells, decreased in active T cells after radiation. Consequently, glucose uptake and glycolysis (Fig. 5C) were also strongly affected. In addition, the direct energy supply, ATP, showed a striking suppression in irradiated T cells (Fig. 5D). A diagram summarizing these events is shown in Figure 6. Metabolic reprogramming is a key process in T cell activation. A study by Zheng et al. [27] showed that blocking glucose, leucine, or energy metabolism led to a dose-dependent inhibition of both proliferation, and IL-2, and IFN-γ production in activated T cells, leading to the conclusion that inhibition of metabolism can lead to T cell anergy. Anergy is a T cell's state of functional hypo- or un-responsiveness to antigen stimulation, with defects in cell cycle progression and other effector function, such as reduction in IL-2 production [28]. Our study is the first to identify that metabolic reprogramming upon activation is prominently compromised in T cells isolated from animals exposed to IR, which can result in functional anergy in T cells. The current study follows up the alterations of T cell metabolism caused by IR after whole body irradiation with a time period of up to two weeks. With the understanding that IR has persistent effects on intracellular metabolic environment such as redox homeostatsis, we speculate that radiation may cause longer-term changes on T cell metabolism, however studies with longer post-IR time points are required to directly address those long-term effects. It is well characterized that the long-term adverse effects of IR on T cell immunity resembles the effects of aging on the immune system [15-17], suggesting that IR alters the T-cell function toward a compromised phenotype and may cause enhanced immunosenescence [29].
A schematic diagram summarizing metabolic alterations in activated T cells after in vivo irradiation. Profound alterations in activation-induced metabolic reprogramming processes are found in T cells isolated from previously irradiated animals. Induction of Myc, a controlling transcriptional factor, is significantly decreased after IR. Consequently, the enhanced expression of Glut1 is compromised, and glucose uptake, glycolysis and ATP generation significantly diminish. Our metabolomic profiling results highlight the comprehensive reduction of anabolic processes for cell proliferation after radiation.
Similar to that reported previously [30], the number of splenocytes decreased markedly at one week post-radiation and started to recover at two weeks post-radiation in the current study (Fig. 1A). In addition, the proportion of naïve T cells was reduced significantly after IR (Fig. 1C), which is consistent with the findings of a reduced percentage of naïve T cells and increased memory T cells reported in A-bomb cohort [15]. The declined naïve proportion in the T cell repertoire together with the significant compromise of metabolic reprogramming coupled with TCR activation may result in perturbed T cell homeostasis and reduced immunity against new pathogens in the individuals exposed to IR.
In connection with the compromised metabolic reprogramming, TCR-induced cell proliferation was also found decreased in T cells exposed to IR. The results showed an apparent halt of proliferation after 3Gy IR exposure, while 0.1Gy or 0.5Gy doses had little effect on TCR-stimulated proliferation measured by CFSE staining (Fig. 2B). Interestingly, results of metabolomics profiling (Fig. 3C, 3D, & 4B) indicate that the metabolic up-regulation in response to TCR stimulation is significantly compromised at a dose of as low as 0.5Gy, whilst at this dose no remarkable effect on proliferation was observed (Supplementary Figure 1). This discrepancy indicates that metabolic reprogramming during T cell activation is rather sensitive to radiation damage and there might be a threshold effect of metabolic impairment in order to induce the detectable alterations in other cellular processes, such as proliferation and cytokine production. Nevertheless, the impaired metabolic modulation at the dose range with little effect on T cell proliferation, like the one observed in 0.5Gy group of this study, may lead to alteration of T cell function. Interestingly, the low dose radiation such as 0.1Gy showed distinct changes from the higher doses as demonstrated in the PCA plot (Fig. 3C) with levels of some metabolites elevated in 0.1Gy rather than decreased in the other tested doses (Fig. 4B). It remains to be determined whether these metabolomics changes contribute to the widely known stimulatory effect of low dose radiation on immune cells [31, 32]. In this study we took advantage of UPLC-QTOF technique in combination with cell immunology methods to investigate the effects of IR on T cell function. The robust metabolomics approach that elucidates the metabolic alterations is more sensitive than the commonly used cell biology assays and reveals significant changes in the low dose IR conditions. With the understanding that metabolic reprogramming is an essential step required for T cell activation, the metabolomics should be of value in studying T cell function in physiological and pathological conditions.
In the two-signal model for lymphocyte activation, the engagement of TCR (signal 1) is insufficient to activate T cells in the absence of costimulation [33-35]. Signal 1 is initiated by TCR engagement that activates MAPK cascades and Ca2+-flux, while signal 2 is mediated via costimulatory receptors that rapidly induces a hierarchical signaling cascade for metabolic reprogramming [6, 36]. CD28 is the most well characterized costimulatory receptor; its engagement activates the PI3K-Akt-mTORC1 axis, which plays a direct and central role in integrating the metabolic regulatory events. mTORC1 regulates glucose metabolism by modulating two key transcription factors, Myc and HIF-1α. mTORC1 signaling also upregulates de novo lipid and cholesterol biosysthesis via activation of SREBP1 [37]. Further investigation will be needed to determine whether radiation impairs metabolic reprogramming in activated T cells by perturbing CD28 costimulatory signaling (Fig. 6). The in-depth understanding of CD28 costimulatory receptor and its negative regulators, such as cytotoxic T lymphocyte-associated antigen 4 (CTLA-4) and programmed death receptor 1 (PD-1), has led to new targets for immunotherapy. While some preclinical studies have implied that combination of radiotherapy and novel immunotherapy may potentiate antitumor treatment, a comprehensive understanding of the impact of radiation on T cell function, particularly on the targets of immunotherapy, should provide a basis for planning future therapeutic strategies.
Supplementary Material
Supplementary Figures 1-4.
Abbreviations
IR: ionizing radiation; OXPHOS: oxidative phosphorylation; wt: wild type; TBI: total body irradiation; CFSE dye: carboxyfluorescein succinimidyl ester; Th: helper T cell; Tc: cytotoxic T cell; DN: double negative T cell; CM: central memory T cell; EM: effector memory T cell; PCA: principle components analysis; UPLC: ultra performance liquid chromatography; QTOF: quadrupole-time-of-flight; ESI: electrospray ionization.
Acknowledgements
We thank the Proteomic and Metabolomics Shared Resources at Georgetown University, NIH P30CA51008 , for providing UPLC-MSTOF service. This work was supported by a research grant from Department of Energy (DE-SC0002345), and a research grant from National Natural Science Foundation of China (81372927).
Competing Interests
The authors declare no competing financial interests.
References
1. Bretscher P, Cohn M. A theory of self-nonself discrimination. Science. 1970;169:1042-49
2. Marelli-Berg FM, Fu H, Mauro C. Molecular mechanisms of metabolic reprogramming in proliferating cells: implications for T-cell-mediated immunity. Immunology. 2012;136:363-69
3. Maciolek JA, Pasternak JA, Wilson HL. Metabolism of activated T lymphocytes. Curr Opin Immunol. 2014;27:60-74
4. Jones RG, Thompson CB. Revving the engine: signal transduction fuels T cell activation. Immunity. 2007;27:173-78
5. Wang R, Dillon CP, Shi LZ, Milasta S, Carter R, Finkelstein D. et al. The transcription factor Myc controls metabolic reprogramming upon T lymphocyte activation. Immunity. 2011;35:871-82
6. Frauwirth KA, Riley JL, Harris MH, Parry RV, Rathmell JC, Plas DR. et al. The CD28 signaling pathway regulates glucose metabolism. Immunity. 2002;16:769-77
7. Fox CJ, Hammerman PS, Thompson CB. Fuel feeds function: energy metabolism and the T-cell response. Nat Rev Immunol. 2005;5:844-52
8. Pearce EL, Poffenberger MC, Chang CH, Jones RG. Fueling immunity: insights into metabolism and lymphocyte function. Science. 2013;342:1242454
9. Macintyre AN, Gerriets VA, Nichols AG, Michalek RD, Rudolph MC, Deoliveira D. et al. The glucose transporter Glut1 is selectively essential for CD4 T cell activation and effector function. Cell Metab. 2014;20:61-72
10. Sinclair LV, Rolf J, Emslie E, Shi YB, Taylor PM, Cantrell DA. Control of amino-acid transport by antigen receptors coordinates the metabolic reprogramming essential for T cell differentiation. Nat Immunol. 2013;14:500-08
11. Yang K, Shrestha S, Zeng H, Karmaus PW, Neale G, Vogel P. et al. T cell exit from quiescence and differentiation into Th2 cells depend on Raptor-mTORC1-mediated metabolic reprogramming. Immunity. 2013;39:1043-56
12. Delgoffe GM, Pollizzi KN, Waickman AT, Heikamp E, Meyers DJ, Horton MR. et al. The kinase mTOR regulates the differentiation of helper T cells through the selective activation of signaling by mTORC1 and mTORC2. Nat Immunol. 2011;12:295-303
13. Radford IR. Radiation response of mouse lymphoid and myeloid cell lines. Part I. Sensitivity to killing by ionizing radiation, rate of loss of viability, and cell type of origin. Int J Radiat Biol. 1994;65:203-15
14. Palayoor ST, Macklis RM, Bump EA, Coleman CN. Modulation of radiation-induced apoptosis and G2/M block in murine T-lymphoma cells. Radiat Res. 1995;141:235-43
15. Kusunoki Y, Hayashi T. Long-lasting alterations of the immune system by ionizing radiation exposure: implications for disease development among atomic bomb survivors. Int J Radiat Biol. 2008;84:1-14
16. Hayashi T, Kusunoki Y, Hakoda M, Morishita Y, Kubo Y, Maki M. et al. Radiation dose-dependent increases in inflammatory response markers in A-bomb survivors. Int J Radiat Biol. 2003;79:129-36
17. Neriishi K, Nakashima E, Delongchamp RR. Persistent subclinical inflammation among A-bomb survivors. Int J Radiat Biol. 2001;77:475-82
18. Neriishi K, Akiba S, Amano T, Ogino T, Kodama K. Prevalence of hepatitis B surface antigen, hepatitis B e antigen and antibody, and antigen subtypes in atomic bomb survivors. Radiat Res. 1995;144:215-21
19. Dainiak N. Hematologic consequences of exposure to ionizing radiation. Exp Hematol. 2002;30:513-28
20. Schaue D, McBride WH. T lymphocytes and normal tissue responses to radiation. Front Oncol. 2012;2:119
21. Hernandez-Godoy J, Planelles D, Balsalobre B. Immediate and short-, mid- and long-term effects of in vivo ionizing radiation exposure in BALB/c mice: II. activation of phorbol myristate acetate and/or calcium ionophore on lymphocyte proliferation. In Vivo. 2013;27:67-76
22. Li HH, Tyburski JB, Wang YW, Strawn S, Moon BH, Kallakury BV. et al. Modulation of fatty acid and bile acid metabolism by peroxisome proliferator-activated receptor alpha protects against alcoholic liver disease. Alcohol Clin Exp Res. 2014;38:1520-31
23. Xia J, Psychogios N, Young N, Wishart DS. MetaboAnalyst: a web server for metabolomic data analysis and interpretation. Nucleic Acids Res. 2009;37:W652-60
24. Mak TD, Laiakis EC, Goudarzi M, Fornace AJ Jr. MetaboLyzer: a novel statistical workflow for analyzing Postprocessed LC-MS metabolomics data. Anal Chem. 2014;86:506-13
25. Svensson C, Petrini B. Changes of gamma/delta T cells in blood after radiation therapy for prostatic cancer. Cancer Lett. 1993;72:175-78
26. Seki H, Kanegane H, Iwai K, Konno A, Ohta K, Yachie A. et al. Ionizing radiation induces apoptotic cell death in human TcR-gamma/delta+ T and natural killer cells without detectable p53 protein. Eur J Immunol. 1994;24:2914-17
27. Zheng Y, Delgoffe GM, Meyer CF, Chan W, Powell JD. Anergic T cells are metabolically anergic. J Immunol. 2009;183:6095-101
28. Fathman CG, Lineberry NB. Molecular mechanisms of CD4+ T-cell anergy. Nat Rev Immunol. 2007;7:599-609
29. Kusunoki Y, Yamaoka M, Kubo Y, Hayashi T, Kasagi F, Douple EB. et al. T-cell immunosenescence and inflammatory response in atomic bomb survivors. Radiat Res. 2010;174:870-76
30. Hernandez-Godoy J, Silvestre DP, Hernandez BB. Immediate and short-, mid- and long-term effects of in vivo ionizing radiation exposure in BALB/c mice: I. Activation of lymphocytes and subpopulations. In Vivo. 2010;24:719-26
31. Shklovskaya E, Fazekas de St Groth B. Severely impaired clonal deletion of CD4+ T cells in low-dose irradiated mice: role of T cell antigen receptor and IL-7 receptor signals. J Immunol. 2006;177:8320-30
32. Liu SZ, Jin SZ, Liu XD, Sun YM. Role of CD28/B7 costimulation and IL-12/IL-10 interaction in the radiation-induced immune changes. BMC Immunol. 2001;2:8
33. Quill H, Schwartz RH. Stimulation of normal inducer T cell clones with antigen presented by purified Ia molecules in planar lipid membranes: specific induction of a long-lived state of proliferative nonresponsiveness. J Immunol. 1987;138:3704-12
34. Jenkins MK, Chen CA, Jung G, Mueller DL, Schwartz RH. Inhibition of antigen-specific proliferation of type 1 murine T cell clones after stimulation with immobilized anti-CD3 monoclonal antibody. J Immunol. 1990;144:16-22
35. Linsley PS, Ledbetter JA. The role of the CD28 receptor during T cell responses to antigen. Annu Rev Immunol. 1993;11:191-212
36. Stillwell R, Bierer BE. T cell signal transduction and the role of CD7 in costimulation. Immunol Res. 2001;24:31-52
37. Calvisi DF, Wang C, Ho C, Ladu S, Lee SA, Mattu S. et al. Increased lipogenesis, induced by AKT-mTORC1-RPS6 signaling, promotes development of human hepatocellular carcinoma. Gastroenterology. 2011;140:1071-83
Author contact
![]() Corresponding author: Dr. Heng-Hong Li, Tel: 202-687-3113; FAX: 202-687-3140; Email: hl234edu
Corresponding author: Dr. Heng-Hong Li, Tel: 202-687-3113; FAX: 202-687-3140; Email: hl234edu