Impact Factor ISSN: 1449-2288

 Global reach, higher impact
Int J Biol Sci 2015; 11(11):1314-1324. doi:10.7150/ijbs.11344 This issue Cite
Research Paper
CELF1 is Up-Regulated in Glioma and Promotes Glioma Cell Proliferation by Suppression of CDKN1B
Liang Xia*, Caixing Sun*, Qinglin Li*, Fang Feng, Enqi Qiao, Limin Jiang ![]() , Bin Wu
, Bin Wu ![]() , Minghua Ge
, Minghua Ge ![]()
Zhejiang Cancer Hospital, Hangzhou 310022, Zhejiang Province, P.R.C
* Liang Xia, Caixing Sun and Qinglin Li contributed equally to this work.
Received 2014-12-14; Accepted 2015-7-20; Published 2015-9-22
Abstract

BACKGROUND: As a member of the CELF family, CELF1 (CUG-binding protein 1, CUGBP1) is involved in cardiac and embryonic development, skeletal muscle differentiation and mammary epithelial cell proliferation. CELF1 is also observed in many kinds of cancer and may play a great role in tumorigenesis and deterioration. However, the expression and mechanism of its function in human glioma remain unclear.
METHODS: We examined CELF1 expression in 62 glioma patients by immunohistochemistry and Western blot. The association between the expression of CELF1 protein and clinicopathological characteristics was analysed using SPSS 17.0. Survival analyses were performed using the Kaplan-Meier method. Small-interfering RNA was utilised to specifically knockdown CELF1 mRNA in U87 and U251 cells. Cell proliferation, cell cycle and cell apoptosis were tested by Cell Counting Kit-8 and flow cytometry. The expression of cell cycle-related gene CDKN1B was investigated by Western blot. The interactions between CELF1 and CDKN1B were detected with immune co-precipitation. Subcutaneous tumour models were used to study the effect of CELF1 on the growth of glioma cells in vivo.
RESULTS: Our results showed that CELF1 protein was frequently up-regulated in human glioma tissues. The expression level of this protein was positively correlated with glioma World Health Organisation grade and inversely correlated with patient survival (P < 0.05). Knockdown of CELF1 inhibited the glioma cell cycle process and proliferation potential, possibly by down-regulating its target, CDKN1B protein.
CONCLUSIONS: Results indicated that CELF1 may be a novel independent prognostic predictor of survival for glioma patients. It may promote glioma cell proliferation and cell cycle process during glioma carcinogenesis.
Keywords: CELF1, Glioma, Prognosis, Proliferation
Introduction
Glioma is the most frequent malignancy in the brain, which accounts for over 50% amongst all tumours in the central nervous system[1]. Treatment strategies for human malignant gliomas are surgery, followed by radiotherapy and chemotherapy. Glioma has a high degree of malignancy, recurrence rate, multi-drug resistance and invasiveness; thus, its treatment presents great difficulty, and the glioma has a poor outcome. The median survival of patients who have glioblastoma multiforme ranges from 9 months to 12 months[2, 3]. With the rapid development of molecular biology of tumours, most scientists have reached a basic consensus that glioma is a complex disease caused by interactions amongst multiple genes, involving many types of oncogene activation and antioncogene inactivation[4]. Therefore, exploring the pathogenesis of gliomas and identifying effective therapy are crucial.
CELF1, a member of the CELF family (CUGBP and embryonic lethal abnormal vision-like factor) that belongs to RNA-binding proteins, is found to interact with RNA CUG repeats expanded in patients with myotonic dystrophy type 1, which binds to 3´ untranslated regions of the dystrophia myotonica protein kinase gene[5-7]. Previous research has indicated that CELF1 might affect the embryonic development process, including heart development, bone and adipose tissue differentiation and reproductive cell formation[8, 9]. Recent studies have shown that CELF1 is overexpressed in many human malignant tumours, such as non-small cell lung cancer, hepatic carcinoma, breast cancer, colon carcinoma, prostate carcinoma, oral carcinoma, acute myelogenous leukaemia and acute B cell lymphoma[10-15]. However, the appearance of CELF1 in human glioma is unclear.
In our study, the expression of CELF1 protein derived from 62 glioma patients was preliminarily investigated by Western blot and immunohistochemical staining. Its relationships with clinicopathological parameters and prognosis were then assessed. The effect of targeted silencing of the CELF1 gene on cell proliferation and cell cycle progression of glioma was detected using small-interfering RNA (siRNA) in vitro. Whether tumour-initiating capability is affected by CELF1 in cell lines of glioma was investigated in nude mice. The aforementioned findings are valuable in determining possible candidates for targeted treatment of gliomas.
Materials and methods
Tumour specimens
Sixty-two glioma tumour samples were obtained from patients aged 35 to 74 years (median, 53 years) who underwent surgery between February 2005 and May 2013 in the Department of Neurosurgery, Zhejiang Cancer Hospital. None of the patients died because of unexpected events or other diseases during evaluation. Cases accepting adjuvant immunosuppressive treatment, including chemotherapy or radiotherapy before operation, were excluded in this study. Glioma was pathologically diagnosed. Regarding tumour grade, 37 cases were of grades III-IV, and 25 were of grades I-II. Features of the cases were collected, inclusive of Karnofsky performance scale scores, prior to the first surgery (Table 2). The surgically resected brain tissue of eight trauma patients admitted to the hospital within the same period was used as a control group (normal brain, NB). All cases were pathologically confirmed to be without gliosis. The final protocol of our study passed the approval of the Ethics Committee in our hospital, and we obtained informed consent from each patient.
Western blot
Total proteins were extracted, and the concentration was detected by the bovine serum albumin method (Beyotime Institute of Biotechnology, P.R.C). For every sample, 40 μg of protein lysates underwent sodium dodecyl sulphate-polyacrylamide gel electrophoresis with 10% acrylamide gel used, which were then transferred onto polyvinylidene difluoride membranes (Millipore Corporation, USA) under 350 mA for 2.5 h. Non-fat milk (5%) was used to block the membrane, and primary antibodies against CELF1 (1:500, Abcam, USA), CDKN1B (1:1000, Sigma, USA), caspase-3 (1:1000, Abcam, USA), cleaved caspase-3 (1:1000, Abcam, USA) or β-actin (1:2000, Beyotime Institute of Biotechnology, P.R.C) were used for incubation overnight under 4 °C. Subsequently, horseradish peroxidase-conjugated secondary antibody (1:500, Beyotime Institute of Biotechnology, P.R.C) was used for incubation. After stripping, Western blot detection reagents of ultra-enhanced chemiluminescence (ECL, Beyotime Institute of Biotechnology, P.R.C) were utilised for reprobing the membrane with β-actin (1:2000, Beyotime Institute of Biotechnology, P.R.C). Protein was observed under an ECL system (ECL, Beyotime Institute of Biotechnology, P.R.C). Each Western band was quantified by densitometry, which was expressed in bar graphs.
Immunohistochemistry (IHC)
Sections (5 μm) on slides were prepared and covered by 10% polylysine. Graded ethanol series was used for deparaffinisation, and the sections were soaked in 0.3% hydrogen peroxide for 30 min to block endogenous peroxidase activity. To retrieve antigen, the sections were placed in 10 mmol/L citrate buffer with pH 6.0 and heated until 121 °C for 20 min. Donkey serum (10%) was added for 1 h under room temperature after rinsed in PBS (pH 7.2) to block any non-specific reactions, followed by incubation overnight under 4 °C together with goat antihuman CELF1 polyclonal antibody (1:100 dilution; Abcam, USA). Each slide was processed according to the peroxidase-antiperoxidase approach (Dako, Hamburg, Germany). After rinsing by PBS solution, the sections were incubated with diaminobenzidine tetrahydrochloride in 0.05 mol/L Tris buffer with pH 7.6, which contained 0.03% H2O2. A peroxidase reaction then appeared. Each section was counterstained by hematoxylin, followed by dehydration and coverslipping. To assess CELF1 expression in tumours of different grades, 10 randomised visual fields per section were examined under 400× magnification, and a Leica light microscope (Wetzlar, Germany) was used for examination. Five high-power fields were randomly selected for every specimen, and nuclear staining was examined. Over 500 cells were counted to calculate the mean percentage, which meant the percentage of stained cells. CELF1 protein expression was defined as positive if nucleus was stained over 5%, whereas cellular plasma was not. Protein expression was defined as (-), (+), (++) and (+++) if nucleus was stained <5%, 5%-30%, 30%-70% (++) and over 70%, respectively.
Cell culture
A normal human astrocyte cell line (1800 cell line) and human malignant glioma cell lines (SHG-44, U251MG and U87MG cell lines) were derived from the Cell Library of the Chinese Academy of Sciences (P.R.C). SHG-44, U251MG and U87MG cells were cultured under 37 °C and 5% CO2 in Dulbecco's modified Eagle's essential medium (DMEM) (Gibco BRL, USA), which was replenished with 2 mM L-glutamine, 10% fetal bovine serum and 100 U/ml penicillin-streptomycin (Gibco). Normal astroctyes were cultured under the same conditions in modified RPMI-1640 (Hyclone, USA) by the same supplements. The medium was renewed every 3-4 d, and the culture was split by 0.25% trypsin.
Transfection with siRNAs
SiRNAs (CELF1-siRNA) and si-negative control (con-siRNA) were both derived from Biomics (Jiangsu, China). Three types of siRNAs targeted the CELF1 gene, amongst which the most effective one (CELF1-siRNA) was utilised for subsequent experiments. The sequences of CELF1-siRNA and con-siRNA were 5'-CTAGCCGGGATTGAAGAATGCCGGATATTCAAGAGATATCCGGCATTCTTCAATCTTTTTAAT-3' and 5'-CTAGCCCGGTTCTCCGAACGTGTCACGTATCTCGAGATACGTGACACGTTCGGAGAATTTTTTTAAT-3', respectively. U251 or U87 cells were plated onto a 96-well or 6-well plate at 40%-60% confluence 24 h before transfection. They were then transfected through incubating with CELF1-siRNA (con -siRNA as control) at final concentrations of 50 nM and TurboFect™ siRNA Transfection Reagent (Fermentas). Following the manufacturer's instructions, the medium was not displaced after transfection. The cells were collected 48 h later for subsequent experiments or 72 h later for extraction of RNA or protein.
Semiquantitative RT-PCR
Total RNA was extracted and converted to cDNA using the RevertAidTM First Strand cDNA synthesis kit (Fermentas,, USA) following the supplier's instructions. GAPDH was used as a control for adjusting the relative of total RNA. The thermal cycles were: 96°C for 30 s, 65°C for 30 s, and 72°C for 30 s for 30 cycles for CELF1, and 95°C for 30 s, 58°C for 30 s, and 72°C for 30 s for 30 cycles for GAPDH. The primers (Invitrogen, China) used for PCR were as follows: CELF1, 5'-ACCTGTTCATCTACCACCTG-3' and 5'-GGCTTGCTGTCATTCTTCG-3; human GAPDH (as an internal control), 5'-GACCCCTTCATTGACCTCAAC-3' and 5'-CTTCTCCATGGTGGTGAAGA-3'. The PCR reactions for CELF1 and GAPDH were analyzed by 2% agarose gel electrophoresis. Reverse transcription PCR was carried out at least three times.
Cell proliferation assay
The cells were seeded in a 96-well plate at a density of 2000 cells/well at 12 h after transfection. Cell Counting Kit-8 (CCK-8) was employed to assess cell viability. CCK-8 (10 μL, C0038, Beyotime Institute) and DMEM (100 μL) were added onto every pre-cultured film, followed by incubation of the plate under 37 °C for 3 h. At a wavelength of 450 nm, the absorbance was determined by a microplate reader (Multi-skanMK33, Thermo Electron Corporation, P.R.C)
Flow cytometry
Glioma U87 and U251 cells transiently transfected with CELF1-siRNA or con con con-siRNA were harvested 48 h after transfection by trypsinisation. After double staining with FITC-Annexin V and propidium iodide (PI) using an FITC AnnexinV Apoptosis Detection Kit (BD Biosciences) according to the manufacturer's recommendations, the cells were analysed with a flow cytometer (FACScan®; BD Biosciences) equipped with CellQuest software (BD Biosciences). Cells were discriminated into viable cells, dead cells, early apoptotic cells and apoptotic cells. The relative ratio of early apoptotic cells was compared with the control transfectant from each experiment. Cells for cell cycle analysis were stained with PI using CycleTEST™ PLUS DNA Reagent Kit (BD Biosciences) following the protocol and then analysed by FACScan. The percentages of the cells in the G0/G1, S and G2/M phases were counted and compared.
Tumorigenicity assay
Animal experiments were conducted following the institutional animal care guidelines. Subcutaneous injection of the transfected cells and control cells (1 × 10⁶) was performed into the right front, close to the upper extremities of 12 Balb/C female nude mice (age, five weeks; Experimental Animal Laboratories, P.R.C). The formed tumour was monitored every week. The tumour volume was calculated as follows (mm3): length×width×height×0.5236. Each mouse was killed five weeks after implantation. The tumour tissues were harvested and weighed prior to fixation. Data were presented in the form of mean ± standard deviation (SD).
Statistical analysis
Student's t-test (two-tailed), one-way ANOVA and Mann-Whitney-Wilcoxon test were performed to analyse the in vitro and in vivo data using SPSS 17.0 software. Data represent the mean ± SD from three independent experiments. χ2 test was also used to analyse the association between CELF1 protein expression and clinicopathological parameters. Disease-specific survival referred to the period between primary surgery and death of patients or end of follow up. The Kaplan-Meier method and log-rank test were used to evaluate the correlation between CELF1 expression and patient survival. P values less than 0.05 were considered significant.
Results
Expression of CELF1 protein in gliomas of different grades
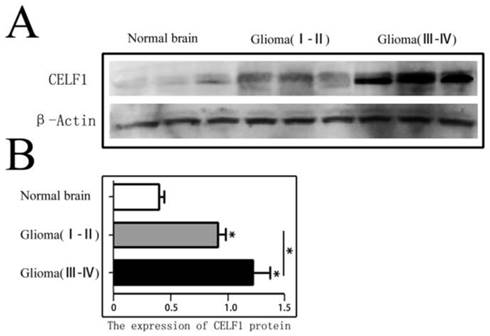
CELF1 protein expression in different grade glioma tissues and NB tissues was firstly detected by Western blot. As shown in Figure 1, the expression of CELF1 in different grade (I-IV) glioma tissues (1.06 ± 0.15) was dramatically higher than that in NB tissues (0.36 ± 0.08) (P < 0.01). A significant difference was also found between low-grade (I-II) (0.83 ± 0.11) and high-grade (III-IV) glioma tissues (1.26 ± 0.14) (P < 0.05).
CELF1 protein expression in different grades of gliomas and normal brain tissues detected by Western blot. A Expression of CELF1 protein level in different grades of gliomas. (Normal Brain, WHO I-II gliomas, WHO III-IV gliomas). B Graphical representation of β-actin-normalized CELF1 protein expression profiles in (a) (*P < 0.05)
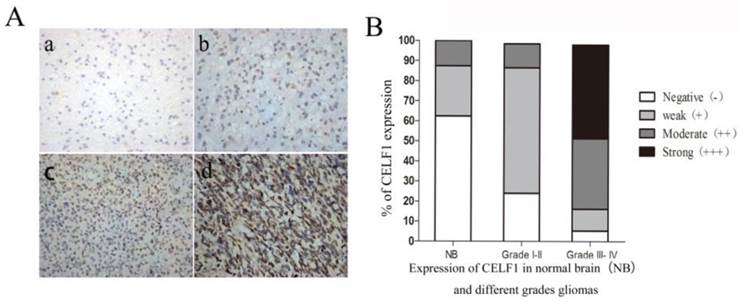
IHC results showed that CELF1 protein was localised in nuclei, with high expression (Figure 2) and a total positive rate of 87.10% in glioma tissues. Low to high expression of CELF1 was observed in gliomas of different grades. Weakly CELF1 positive (+) or negative (-) immunoreactivity was detected in only 3/8 NB tissues; 54/62 glioma tiusses showed different levels (+, ++, +++) of CELF1 expression; 31/37 gliomas of grades III-IV exhibited detectable positive (++) or strong positive (+++) levels of CELF1; and 4/25 gliomas of low grade showed the same levels of protein expression (Table 1). These results indicated that CELF1 expression increased with rising tumour grades, consistent with the results of Western blot analysis.
Expression of CELF1 in normal brain(NB) and different grades gliomas
| Group | Case | Score of CELF1 expression | |||
|---|---|---|---|---|---|
| - | + | ++ | +++ | ||
| NB | 8 | 5 | 2 | 1 | 0 |
| Grade I-II | 25 | 6 | 15 | 3 | 1 |
| Grade III- IV | 37 | 2 | 4 | 13 | 18 |
The CELF1 positive rate was significantly correlated with WHO classification of glioma grades, P<0.05.
A Representative sections for CELF1 immunoreactivity in Normal brain and different grades of gliomas (×400) (a, Normal brain; b, WHO I gliomas; c, WHO II- IIIIV gliomas; d, WHO IV gliomas). B Overall level of CELF1 expression was significantly higher in WHO III-IV glioma tissues than that in WHO I-II glioma tissues and Normal brain tissues according to the IHC results (P < 0.05)
Prognostic value of CELF1 expression in gliomas
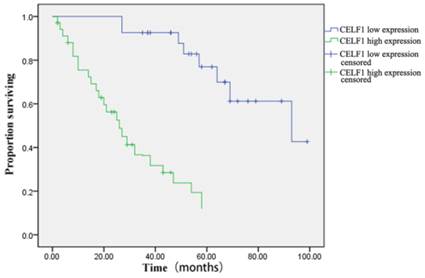
The correlation between CELF1 expression and clinicopathological features of glioma was further analysed (Table 2). According to the expression profile of CELF1, expression levels of glioma tissue were divided into high expression (++, +++) or low expression (+, -). No significant correlation was found between high or low CELF1 expression and sex, age, volume of tumour or site of origin (P > 0.05). However, high or low expression of CELF1 was statistically correlated with the World Health Organisation (WHO) grade (P = 0.002). The difference between the high expression group and low expression group in the overall survival of patients was also statistically significant (P = 0.001; Figure 3). The survival of those patients who had a high CELF1 expression seemed to be worse than the survival of those who had a low CELF1 expression. Therefore, CELF1 expression might be an independent prognostic factor for glioma patients.
Relationship between CELF1 expression and clinicopathological characteristics of gliomas
| CELF1 expression | ||||
|---|---|---|---|---|
| Clinicopathological features Value | N | Low expression (-,+) | high expression (++,+++) | p |
| Gender | ||||
| Male | 30 | 12 | 18 | 0.585 |
| Female | 32 | 15 | 17 | |
| Age | ||||
| <40 | 35 | 16 | 19 | 0.695 |
| >40 | 27 | 11 | 16 | |
| KPS | ||||
| <80 | 28 | 13 | 15 | 0.875 |
| >80 | 34 | 14 | 20 | |
| Tumor diameter | ||||
| <4cm | 24 | 14 | 10 | 0.062 |
| >4cm | 38 | 13 | 25 | |
| Tumor location | ||||
| Frontal | 21 | 8 | 13 | 0.236 |
| Temporal | 26 | 6 | 10 | |
| other | 15 | 3 | 9 | |
| WHO grade | ||||
| Ⅰ∼Ⅱ | 25 | 21 | 4 | 0.001 |
| Ⅲ∼Ⅳ | 37 | 6 | 31 | |
Kaplan-Meier postoperative survival curve for patterns of patients with glioma and CELF1 expression
Exogenous down-regulation of CELF1 in glioma cells
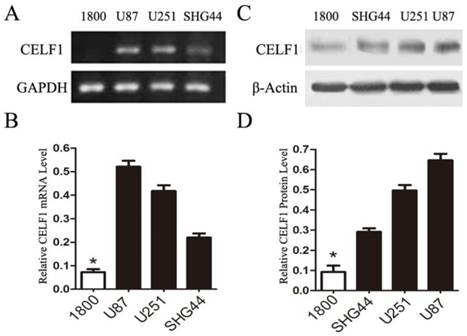
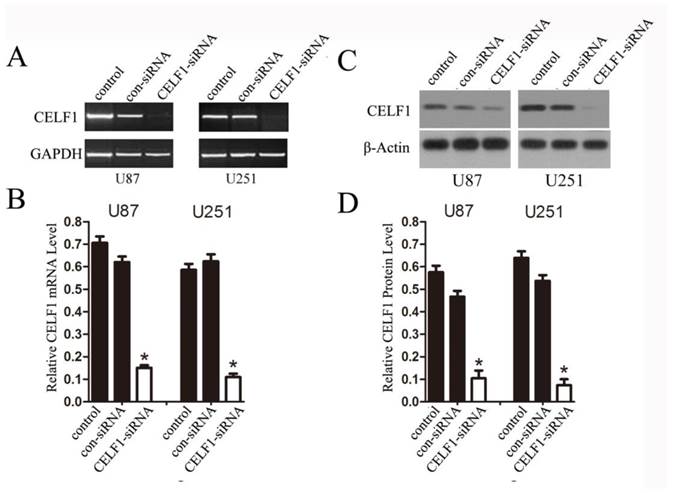
To explore the role of CELF1 expression in gliomas, human glioma cell lines, including SHG44, U251 and U87 cell lines, and a normal astroglial cell line, i.e. 1800 cell line, were used in our study. Western blot and RT-PCR analyses were performed. High expression of CELF1 mRNA and protein was observed in glioma cell lines, whereas low expression was found in the normal astroglial cell line (Figure 4, P < 0.005). The expression of CELF1 in U87 and U251 cells was higher than that in SHG44 cells. CELF1 siRNA was utilised to specifically knockdown CELF1 mRNA in U87 and U251 cells to decrease CELF1 expression. Transfection of U87 and U251 glioma cell lines with an siRNA duplex for 2 d led to 83.8% and 68.6% reduction or so in both mRNA levels of CELF1, respectively, whereas con-siRNA showed no effect on the expression of CELF1 (Figures 5A and 5B). Western blot revealed consistent results for protein levels (Figures 5C and 5D).
Expression of CELF1 mRNA level (AB) and protein level (CD) in three glioma cell lines (U87, U251 and SHG) and one normal astroglia cell line (1800) , GAPDH(AB) orβ-actin(CD) were used as loading controls.(*P < 0.05)
Extent of knockdown of CELF1 mRNA (AB) and protein (CD) transcription upon transfection of siRNA sequence in comparison with the negative control (con-siRNA) and untransfected cells (control), GAPDH(AB) orβ-actin(CD) were used as loading controls. (*P < 0.05)
Effect of CELF1 on cell proliferation and apoptosis in vitro
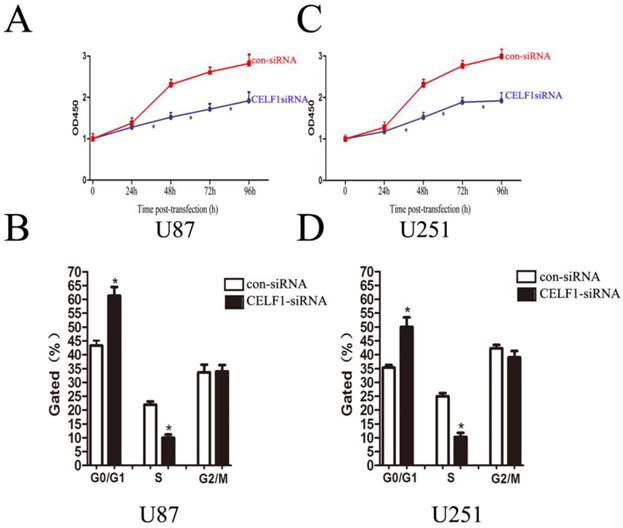
As indicated by the growth curves determined by CCK-8 assay, cell proliferation of the two cell lines was significantly inhibited by CELF1 down-regulation (Figures 6A and 6C, *P < 0.005). To further examine whether the effect of CELF1 on proliferation of glioma cells reflects cell cycle arrest, cell cycle progression was analysed by flow cytometry analysis. The results revealed that U87 cells transfected with CELF1-SiRNA had an obvious cell cycle arrest at the G1/G0 phase and a decreased G2/S phase (Figure 6B, *P < 0.005). Similar results were found in CELF1-siRNA-transfected U251 cells (Figure 6D, *P < 0.005). These results suggested that the cell cycle progression of glioma could be inhibited by down-regulation of CELF1 expression, which could also be accelerated by overexpression of CELF1.
Effects of CELF1 knockdown on the proliferation of glioma cells (*P < 0.005). A and C, Growth curves indicating cell growth promotion by CELF1 (U87 and U251). B and D, Flow cytometry quantitation of cell cycle progression in glioma cells (U87 and U251).
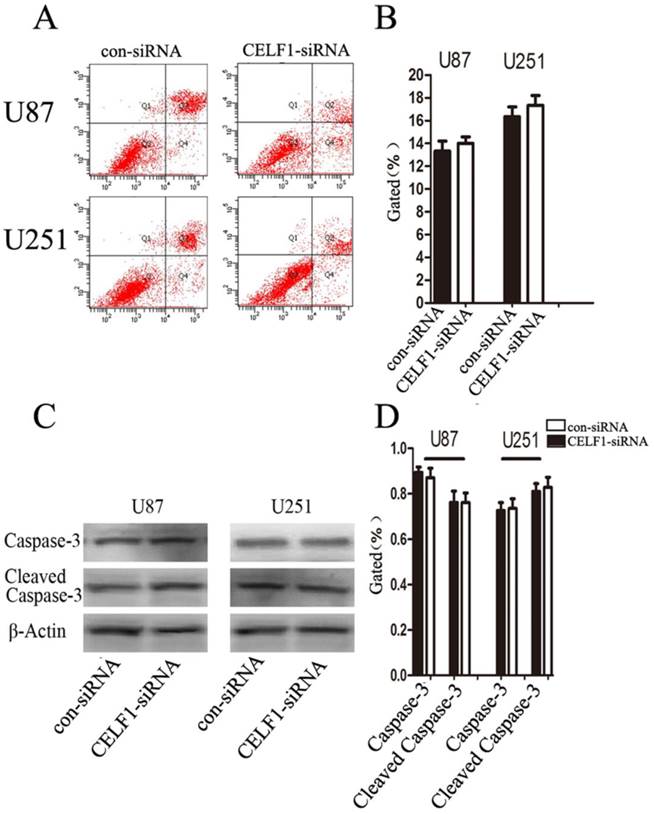
To determine whether glioma cell proliferation is influenced by apoptosis, we performed flow cytometry assay. Quantification of the number of cells with condensed and fragmented nuclei indicated that CELF1-siRNA-treated U87 and U251 cells displayed no significant difference in apoptosis in comparison with the control (Figures 7A and B). Consistent with our findings from flow cytometry, Western blot analysis indicated that the expression level of cleaved caspase-3 displayed no significant change in CELF1-siRNA-transfected U87 and U251 cells (Figures 7C and D). These results indicated that enhanced CELF1 expression promoted glioma cell proliferation and cell cycle progression and did not influence cell apoptosis.
Effect of CELF1 on cell apoptosis. A and B, Apoptotic rates of cells detected by flow cytometry. C and D, Western blot assays of caspase-3 and cleaved caspase-3, β-actin(CD) was used as loading controls. (*P < 0.05)
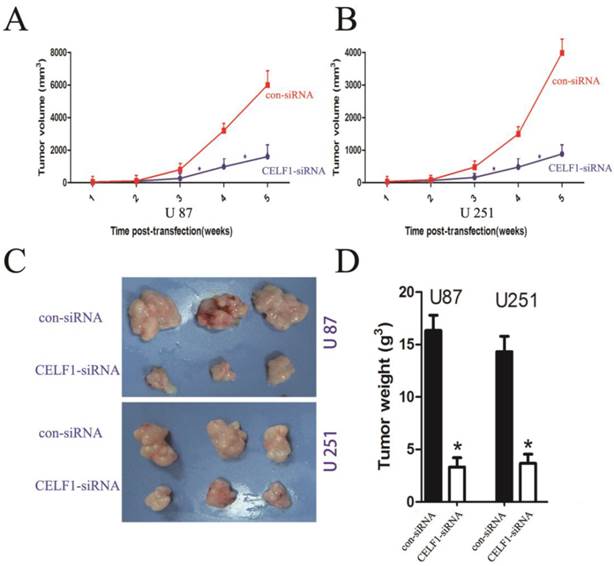
Tumour volume curves and tumour weights at five weeks when mice were killed. A,B The curve shows the tumour growth of cells with CELF1 knockdown, negative control (con-siRNA). C,D The tumour tissues were harvested and individually weighed (P < 0.05)
CELF1 enhanced tumorigenicity in nude mice
To explore the effect of altered CELF1 expression on glioma growth in vivo, stable CELF1 siRNA-transfected U87 cell lines (U87- CELF1-siRNA) were established by duplication of transfection experiments with U87 cell lines. Compared with control siRNA(con-siRNA), a few colonies survived in cells transfected with CELF1 siRNA after G418 selection for 14 d. Colonies that survived within each respective transfection group were pooled to set up stable transfected cell lines. Western blot analysis revealed that CELF1 protein expression in CELF1 siRNA-transfected U87MG cell lines declined in an approximate 52.3% as compared with the con-siRNA. Those cells were then subcutaneously injected into nude mice (1 × 10⁶ per mouse) to assess the effect of CELF1 knockdown on brain tumour growth. Measurement of tumour growth was conducted once per week for five times. In contrast to control (con-siRNA), the size of tumours formed in the group of si CELF1-transfected U87 cells was smaller (Figure 7A). The tumour tissues were harvested and weighed five weeks after transplantation. As shown in Figures 7C and 7D, the U87- CELF1-siRNA cell group had a smaller tumour weight than the controls (U87-con-siRNA) (P < 0.005). The same result was obtained in U251 cells (Figures 7B-7D).
Protein level of CDKN1B affected by altered CELF1 expression
Preliminary studies indicated that CELF1 interacts with the human CDKN1B 5'-untranslated region, and its overexpression suppresses expression of endogenous CDKN1B and decreases translation initiation via CDKN1B IRES[8]. Accordingly, we speculated that CELF1 accelerated glioma cell cycle progression by suppressing the CDKN1B, which is a cyclin-dependent kinase inhibitor, a chief regulator of G1 to S phase transition and is active in the nuclei. In this study, we used RT-PCR and Western blot to determine whether CDKN1B mRNA and protein expression is affected by CELF1. The results showed that down-regulation of CELF1 in U87 and U251 cells contributed to a 3- to 3.5-fold rise in CDKN1B protein expression (Figures 9A and 9B), but no change was found in CDKN1B mRNA expression (Figures 9C and 9D). Thus, overexpression of CELF1 accelerated cell cycle progression in glioma cells via CDKN1B protein suppression but not mRNA. The interactions between CELF1 and CDKN1B protein were detected with immune co-precipitation in U87 and U251 glioma cells (Figure 9E).
Down-regulating the expression of CELF1 could partially promote CDKN1B overexpression. A and B, Expression of CDKN1B protein was analysed by Western blot. C and D, Expression of CDKN1B mRNA was analysed by quantitative polymerase chain reaction. β-actin (AB) or GAPDH (CD) were used as loading controls. E, U87 and U251 cells were transiently transfected with CELF1-siRNA or CON-siRNA using Lipofectamine 2000. After 48 h, lysates were prepared and immunoprecipitated with anti-CUGBP1 or anti- CDKN1B antibody. Western blot was conducted with anti- CDKN1B or anti- CELF1 antibodies.

Discussion
The CELF (CUGBP and ETR-like factors) family proteins are major sequence-specific RNA binding proteins that control alternative splicing and mRNA translation and stability[16]. Some reports have demonstrated that CELF1 protein regulates pre-mRNA alternative splicing, which is involved in mRNA editing and translation in organogenesis[17]. Previous studies have also suggested that CELF1 plays a critical role in non-small cell lung cancer, breast cancer, hepatic carcinoma, colon carcinoma, prostate cancer, oral cancer, acute myelogenous leukaemia and acute B cell lymphoma[4, 10-12, 17], but its role and molecular carcinogenesis in glioma are unknown.
In our study, overexpression of CELF1 was correlated with poor overall survival and high WHO grade in glioma patients, but it had no correlation with age, sex, tumour location, tumour size and KPS scores. Our findings suggested that CELF1 may act as a possible therapeutic target and a promising prognostic factor in human glioma patients.
The cyclin-dependent kinase inhibitor CDKN1B is a well-known tumour suppresser because it is important in controlling cell proliferation through suppressing cyclin-dependent kinase[18]. CDKN1B binds to cyclin E complexes and CDK2, thereby preventing cell cycle progression from the G1 phase to the S phase, which is also frequently down-regulated in various types of cancer, including glioma[19]; the reduced expression of CDKN1B protein is related to poor outcomes of glioma patients and is implicated in glioma cell proliferation and differentiation[20]. The regulation of CDKN1B is complex, involving transcriptional, translational and posttranslational levels[21]. According to previous studies, CELF1 interacts with the human CDKN1B 5'-untranslated region, and its overexpression suppresses the expression of endogenous CDKN1B and decreases translation initiation via CDKN1B IRES[8]. Therefore, we speculated that CELF1 promoted glioma cell proliferation by down-regulation of CDKN1B expression in glioma, as confirmed by the present study; this finding was also consistent with the study of Yuhuan Zheng et al.[8], who reported that suppressed expression of CELF1 by siRNA transfection enhances CDKN1B protein levels and stimulates p27 IRES activity.
In our study, CELF1 was often up-regulated in human glioma cell lines but not in the normal astroglial cell line, thereby confirming results of the previous glioma tissue experiment. Functional evidence regarding the possible role of CELF1 in glioma was also indicated because CELF1 up-regulation could enhance glioma cell proliferation potential, possibly by down-regulation of its target CDKN1B. CDKN1B and CELF1 expression levels in the glioma cell lines were inversely correlated. CELF1 up-regulation in human glioma may promote glioma cell proliferation during carcinogenesis. This fine-tuning regulation of CELF1 on CDKN1B protein in the glioma cells may be considered a sophisticated mechanism, which guaranteed a fast response in CDKN1B levels to any intracellular or environmental changes.
In conclusion, our research suggested that the overexpression of CELF1 may contribute to the growth and progression of glioma, at least in part, by suppressing CDKN1B expression. Additional functional studies are still required to aid our comprehension of the molecular basis of carcinogenesis, as well as to provide new evidence for the development of innovative therapies that target the specific molecular mechanisms of glioma.
Acknowledgements
The study was sponsored by the Natural Science Program of Zhejiang Department of Finance (No.: LY12H16032), the National Natural Science Foundation of China (No. 81502147) and the Youth Scientific Innovation Foundation of Zhejiang Cancer Hospital (No.: QN201402).
Conflict of interests
All the authors declare that they have no conflict of interests.
Animal experiments were performed in strict accordance with the Institutional Animal Care guidelines of interest.
References
1. Stupp R, Tonn JC, Brada M, Pentheroudakis G. High-grade malignant glioma: ESMO Clinical Practice Guidelines for diagnosis, treatment and follow-up. Annals of oncology: official journal of the European Society for Medical Oncology / ESMO. 2010;21(Suppl 5):v190-3
2. Ohgaki H, Kleihues P. Epidemiology and etiology of gliomas. Acta neuropathologica. 2005;109:93-108
3. Jemal A, Murray T, Ward E, Samuels A, Tiwari RC, Ghafoor A. et al. Cancer statistics, 2005. CA: a cancer journal for clinicians. 2005;55:10-30
4. Wrensch M, Fisher JL, Schwartzbaum JA, Bondy M, Berger M, Aldape KD. The molecular epidemiology of gliomas in adults. Neurosurgical focus. 2005;19:E5
5. Ward AJ, Rimer M, Killian JM, Dowling JJ, Cooper TA. CUGBP1 overexpression in mouse skeletal muscle reproduces features of myotonic dystrophy type 1. Human molecular genetics. 2010;19:3614-22
6. Koshelev M, Sarma S, Price RE, Wehrens XH, Cooper TA. Heart-specific overexpression of CUGBP1 reproduces functional and molecular abnormalities of myotonic dystrophy type 1. Human molecular genetics. 2010;19:1066-75
7. Mulders SA, van den Broek WJ, Wheeler TM, Croes HJ, van Kuik-Romeijn P, de Kimpe SJ. et al. Triplet-repeat oligonucleotide-mediated reversal of RNA toxicity in myotonic dystrophy. Proceedings of the National Academy of Sciences of the United States of America. 2009;106:13915-20
8. Zheng Y, Miskimins WK. CUG-binding protein represses translation of p27Kip1 mRNA through its internal ribosomal entry site. RNA biology. 2011;8:365-71
9. Zhang L, Lee JE, Wilusz J, Wilusz CJ. The RNA-binding protein CUGBP1 regulates stability of tumor necrosis factor mRNA in muscle cells: implications for myotonic dystrophy. The Journal of biological chemistry. 2008;283:22457-63
10. Mukhopadhyay D, Jung J, Murmu N, Houchen CW, Dieckgraefe BK, Anant S. CUGBP2 plays a critical role in apoptosis of breast cancer cells in response to genotoxic injury. Annals of the New York Academy of Sciences. 2003;1010:504-9
11. Jiao W, Zhao J, Wang M, Wang Y, Luo Y, Zhao Y. et al. CUG-binding protein 1 (CUGBP1) expression and prognosis of non-small cell lung cancer. Clinical & translational oncology: official publication of the Federation of Spanish Oncology Societies and of the National Cancer Institute of Mexico. 2013;15:789-95
12. Liu Y, Huang H, Yuan B, Luo T, Li J, Qin X. Suppression of CUGBP1 inhibits growth of hepatocellular carcinoma cells. Clinical and investigative medicine Medecine clinique et experimentale. 2014;37:E10-8
13. Ramalingam S, Ramamoorthy P, Subramaniam D, Anant S. Reduced Expression of RNA Binding Protein CELF2, a Putative Tumor Suppressor Gene in Colon Cancer. Immuno-gastroenterology. 2012;1:27-33
14. Zhou Y, Ma H, Fang J, Lian M, Feng L, Wang R. Knockdown of CUG-binding protein 1 induces apoptosis of human laryngeal cancer cells. Cell biology international. 2014;38:1408-14
15. Guerzoni C, Bardini M, Mariani SA, Ferrari-Amorotti G, Neviani P, Panno ML. et al. Inducible activation of CEBPB, a gene negatively regulated by BCR/ABL, inhibits proliferation and promotes differentiation of BCR/ABL-expressing cells. Blood. 2006;107:4080-9
16. Beisang D, Reilly C, Bohjanen PR. Alternative polyadenylation regulates CELF1/CUGBP1 target transcripts following T cell activation. Gene. 2014;550:93-100
17. Kalsotra A, Xiao X, Ward AJ, Castle JC, Johnson JM, Burge CB. et al. A postnatal switch of CELF and MBNL proteins reprograms alternative splicing in the developing heart. Proceedings of the National Academy of Sciences of the United States of America. 2008;105:20333-8
18. Koguchi K, Nakatsuji Y, Nakayama K, Sakoda S. Modulation of astrocyte proliferation by cyclin-dependent kinase inhibitor p27(Kip1). Glia. 2002;37:93-104
19. Naumann U, Weit S, Rieger L, Meyermann R, Weller M. p27 modulates cell cycle progression and chemosensitivity in human malignant glioma. Biochemical and biophysical research communications. 1999;261:890-6
20. Gopinath S, Malla RR, Gondi CS, Alapati K, Fassett D, Klopfenstein JD. et al. Co-depletion of cathepsin B and uPAR induces G0/G1 arrest in glioma via FOXO3a mediated p27 upregulation. PloS one. 2010;5:e11668
21. Chen YJ, Lin JK, Lin-Shiau SY. Proliferation arrest and induction of CDK inhibitors p21 and p27 by depleting the calcium store in cultured C6 glioma cells. European journal of cell biology. 1999;78:824-31
Author contact
![]() Corresponding authors: Bin Wu M.D. Email: wubinbindoccom; Minghua Ge M.D. Email: geminghcom; Limin Jiang M.D. Email:jlm129com. Address: Zhejiang Cancer Hospital, 38 Guangji Road, Hangzhou 310022, Zhejiang Province, P.R.C., Phone: +86-571-88122222
Corresponding authors: Bin Wu M.D. Email: wubinbindoccom; Minghua Ge M.D. Email: geminghcom; Limin Jiang M.D. Email:jlm129com. Address: Zhejiang Cancer Hospital, 38 Guangji Road, Hangzhou 310022, Zhejiang Province, P.R.C., Phone: +86-571-88122222