Impact Factor ISSN: 1449-2288

 Global reach, higher impact
Int J Biol Sci 2016; 12(1):1-17. doi:10.7150/ijbs.13158 This issue Cite
Research Paper
A Mechanobiology-based Algorithm to Optimize the Microstructure Geometry of Bone Tissue Scaffolds
Antonio Boccaccio ![]() , Antonio Emmanuele Uva, Michele Fiorentino, Luciano Lamberti, Giuseppe Monno
, Antonio Emmanuele Uva, Michele Fiorentino, Luciano Lamberti, Giuseppe Monno
Dipartimento di Meccanica, Matematica e Management, Politecnico di Bari, 70126 Bari, Italy
Received 2015-7-6; Accepted 2015-9-23; Published 2016-1-1
Abstract

Complexity of scaffold geometries and biological mechanisms involved in the bone generation process make the design of scaffolds a quite challenging task. The most common approaches utilized in bone tissue engineering require costly protocols and time-consuming experiments. In this study we present an algorithm that, combining parametric finite element models of scaffolds with numerical optimization methods and a computational mechano-regulation model, is able to predict the optimal scaffold microstructure. The scaffold geometrical parameters are perturbed until the best geometry that allows the largest amounts of bone to be generated, is reached. We study the effects of the following factors: (1) the shape of the pores; (2) their spatial distribution; (3) the number of pores per unit area. The optimal dimensions of the pores have been determined for different values of scaffold Young's modulus and compression loading acting on the scaffold upper surface.
Pores with rectangular section were predicted to lead to the formation of larger amounts of bone compared to square section pores; similarly, elliptic pores were predicted to allow the generation of greater amounts of bone compared to circular pores. The number of pores per unit area appears to have rather negligible effects on the bone regeneration process. Finally, the algorithm predicts that for increasing loads, increasing values of the scaffold Young's modulus are preferable.
The results shown in the article represent a proof-of-principle demonstration of the possibility to optimize the scaffold microstructure geometry based on mechanobiological criteria.
Keywords: Numerical Optimization, Mechanobiology, Scaffold Microstructure, Mechano-regulation Algorithm.
Introduction
Bone defects of critical dimensions usually present harsher challenges to successful bone repair. In these conditions, surgery is usually required in order to re-establish the structural integrity of the fractured bone. Scaffold implantation hence becomes mandatory as it provides an ad-hoc structural/porous framework for the bone defect healing process, i.e. an effective incubator allowing for cell attachment, proliferation and controlled differentiation into the targeted phenotype [1]. Scaffolds must favorite important biological processes such as production of extra-cellular matrix, signaling and vascularization. Mechanical loads acting on scaffolds must be properly transferred to the adjacent biological tissues.
Complexity of scaffold geometries and extreme variability of bone tissue properties make the design of scaffolds a quite challenging task. The most common approach in bone tissue engineering is the 'trial-and-error' (T&E) approach: the existing design is modified based on the outcome of in vitro or in vivo experiments. Improvements in cell culture protocols and development of very efficient bioreactors have greatly improved T&E, as well as reliability of in vitro experiments [2]. However, T&E approach usually requires costly protocols and time-consuming experiments [3]. Computational models allow to simulate within a certain degree of accuracy how environment affects bone regeneration and hence, to fully understand the mechanisms behind tissue differentiation [4-7]. Mechanical factors are known to play a key role in the bone regeneration process [2] and a number of studies have used computational models to investigate the role of biophysical stimuli in regulating tissue differentiation in scaffolds for bone tissue engineering [8-16].
The geometry of porous scaffolds has recently been shown to significantly influence the cellular response and the rate of bone tissue regeneration [17]. Rumpler et al. [18] showed that curvatures with radii much larger than the cells could interact with the cells and influence their behavior. The type of curvature, i.e. concave vs. convex, is also found to be important in some studies showing that the tissue growth process prefers concave surfaces to convex ones [19-23]. Furthermore, a number of studies have shown that the pore shape could significantly affect the tissue regeneration process in scaffolds [20, 24-26].
Studying the effects of the scaffold microstructure on the bone regeneration process is a very difficult task. In order to identify all the specific geometrical features that could influence bone tissue regeneration it is necessary the systematic study of different classes of pore shapes but, no such studies are currently available in the literature [17]. In such a context, the availability of in vitro, in vivo and in silico data is of crucial importance. The effects of the large number of mechanisms involved in the bone regeneration process could be separated when in vitro, in vivo and in silico data are simultaneously available. Different types of mechanisms in fact, could be turned on or off in computer or in in vitro models to study whether a given experimental response depends or not on a specific mechanism.
Numerical optimization techniques have been utilized to determine the optimal design of scaffolds for bone tissue engineering [27]. Rainer et al. [28] introduced an innovative strategy for the fabrication of highly optimized structures, based on the a priori finite element analysis (FEA) of the physiological load set at the implant site. Dias et al. [29] and Coelho et al. [30], based on design optimization schemes previously developed [31-32], proposed a topology optimization algorithm as a technique to design scaffolds that meet specific requirements for mass transport and mechanical load bearing. Wieding et al. [33] proposed a numerical study to optimize the geometrical parameters of open-porous titanium scaffolds to match the elastic properties of human cortical bone with respect to an adequate pore size. Guyot et al. [26] developed a computational framework based on the level set methodology to predict curvature-dependent growth of the cell/extracellular matrix domain within tissue engineering constructs. However, to date, no studies are reported in the literature that determine the optimal scaffold geometry by maximizing (or minimizing) an objective function based on mechano-regulation criteria.
The objective of this study is to optimize the microstructure geometry of scaffolds through the combined implementation of finite element models, a numerical optimization routine and a mechano-regulation algorithm. The scaffold geometrical parameters are continuously perturbed and then the finite element model is re-meshed in each iteration cycle until the biophysical stimulus acting on the tissue filling the scaffold becomes the most favorable one thus maximizing the amount of generated bone. In particular, in this paper the effects of the following factors have been investigated: (1) the shape of the pores; (2) their spatial distribution; (3) the number of pores per unit area. The optimal dimensions of the pores have been determined for different values of scaffold Young's modulus and compression loading acting on the scaffold upper surface.
Materials and Methods
Scaffold parametric models
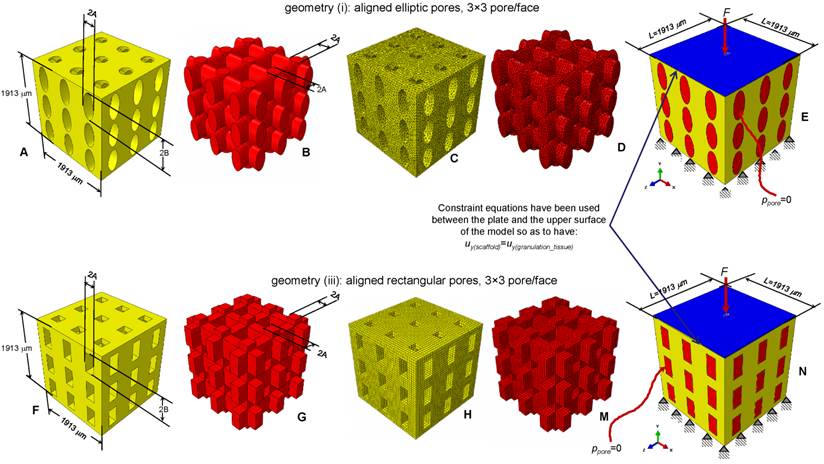
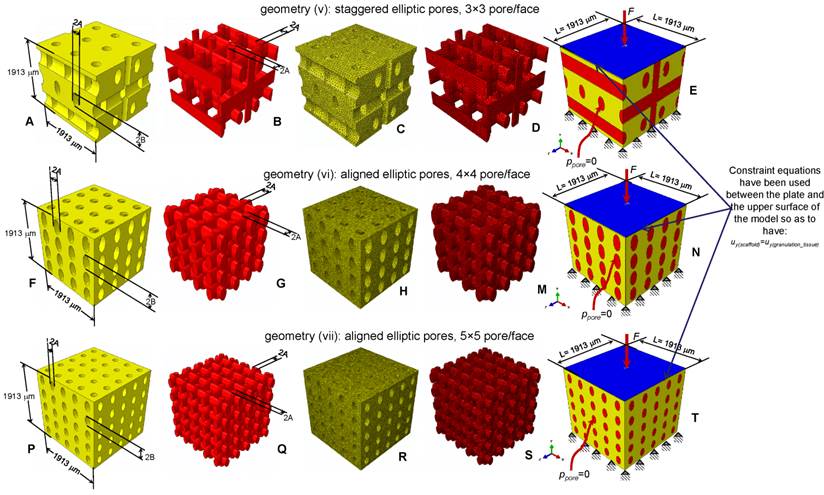
Parametric three-dimensional biphasic poro-elastic finite element (FE) models of open-porous scaffolds were developed to investigate their structural response under different values of compression loading. The general purpose finite element software ABAQUS® Version 6.12 (Dassault Systèmes, France) was utilized. Following Byrne et al. [8], cubic finite element models of regular structured bone scaffolds were built with volume VTOT = L × L × L = 1.913 × 1.913 × 1.913 ≅ 7 mm3 (Figures 1 and 2). Modelling was hypothesized to begin once the granulation tissue has infiltrated the scaffold. Both the scaffold and the granulation tissue were modelled as poroelastic materials. Seven principal geometries have been investigated: (i) aligned elliptic pores, 3×3 pore/face (Figure 1(A-E)); (ii) aligned circular pores, 3×3 pore/face; (iii) aligned rectangular pores, 3×3 pore/face (Figure 1(F-N)); (iv) aligned square pores, 3×3 pore/face; (v) staggered elliptic pores, 3×3 pore/face (Figure 2(A-E)); (vi) aligned elliptic pores, 4×4 pore/face (Figure 2(F-N)); (vii) aligned elliptic pores, 5×5 pore/face (Figure 2(P-T)). The dimension of the pores is controlled by two independent parameters A and B (Figures 1 and 2) that have been optimized to maximize the amount of bone that develops within the scaffold. For the sake of brevity, geometries (ii) and (iv) are not shown as they can be obtained from geometries (i) and (iii), respectively, by simply imposing the constraint (A = B).
CAD model of the scaffold (A, F) and of the granulation tissue (B, G) in the case of aligned elliptic (A-B) and rectangular (F-G) pores, 3×3 pore/face. Finite element mesh of the scaffold (C, H) and of the granulation tissue (D, M) in the case of elliptic (C-D) and rectangular (H-M) pores. Boundary and loading conditions acting on the model with elliptic (E) and rectangular (N) pores. A force to generate an apparent pressure is applied vertically via a rigid plate. As the surrounding tissue would not totally prevent the fluid from escaping the pore pressure ppore on the outer surfaces of the granulation tissue was set to zero to simulate the free exudation of fluid.
CAD model (A-B, F-G, P-Q) and finite element mesh (C-D, H-M, R-S) of the scaffold (A, C, F, H, P, R) and of the granulation tissue (B, D, G, M, Q, S) in the case of: (A-E) elliptic staggered pores, 3×3 pore/face; (F-N) elliptic (aligned) pores, 4×4 pore/face; elliptic (aligned) pores 5×5 pore/face (P-T). (E, N, T) Boundary and loading conditions acting on the model. A force to generate an apparent pressure is applied vertically via a rigid plate. The pore pressure ppore on the outer surfaces of the granulation tissue was set to zero to simulate the free exudation of fluid.
All the scaffold models, according to Byrne et al. [8], were hypothesized to undergo to compression loading. The bottom surface nodes were clamped while, a force to generate an apparent pressure (defined as the ratio between the load F and the total surface area A = L × L, Figure 1E,1N, Figure 2E, 2N, 2T) of 0.001, 0.005, 0.01, 0.05, 0.1, 0.5, 1.0, 2.0, 3.0, 4.0 and 5.0 MPa was applied on the nodes of the upper surface via a rigid plate (shown in blue in Figure 1E, 1N, Figure 2E, 2N, 2T). The load was ramped over a time period of 1 s which can be considered the time in which a scaffold can be loaded in in vivo conditions (e.g. the time necessary to assume the erect position, etc). The same time period was utilized in a previous study [34]. In order to apply the same vertical displacement to the nodes of the scaffold and those of the regenerate, constraint equations have been utilized that tie the rigid plate to the model upper surface. According to Byrne et al.[8], the pore pressure ppore on the outer surfaces of the granulation tissue was set equal to zero thus simulating the free exudation of fluid.
In the parametric study, scaffolds were hypothesized to possess three different Young's modulus values E: 500 (low), 1000 (intermediate) and 1500 (high) MPa which are consistent with those utilized by Byrne et al. [8]. The material properties used for the granulation tissue are the same as used in previous models [35-37]: Young's modulus 0.2 MPa; Permeability 1×10-14 m4/N/s; Poisson's ratio 0.167; Porosity 0.8; Bulk modulus grain 2300 MPa; Bulk modulus fluid 2300 MPa. 4-node linear coupled pore pressure elements (C3D4P) and 8-node trilinear displacement and pore pressure elements (C3D8P) available in ABAQUS were utilized to model scaffolds including elliptic or circular (i.e. geometries: (i), (ii), (v), (vi) and (vii); Figures 1C, 1D and Figures 2C, 2D, 2H, 2M, 2R, 2S) and rectangular or square (i.e. geometries: (iii) and (iv); (Figures 1H, 1M) pores, respectively. Poro-elastic finite element analyses were performed in the study accounting for geometric nonlinearity. Mesh was properly refined so as to reach a good compromise between the convergence of nonlinear analyses and the computational time. In particular, for geometries (i) to (v) the approximate element size was 40 μm and the curvature of the pores was controlled with a maximum deviation factor of 0.1. For geometries (vi) and (vii) an approximate element size of 35 μm and a maximum deviation factor of 0.1 were set.
Mechano-regulation model
Tissue regeneration process begins once mesenchymal stem cells (MSCs) invade the scaffold thus proliferating and differentiating. Neglecting the transient phase of the spreading of the MSCs throughout the scaffold pores we assume that complete cell coverage in the scaffold has already taken place. After dispersal, cells are hypothesized to differentiate depending on the values of a biophysical stimulus S that is assumed to be a function of the octahedral shear strain and interstitial fluid flow in the extracellular environment of the cells.
Following Prendergast et al. [38], if γ is the octahedral shear strain and v the relative fluid/solid velocity, the stimulus S is defined as:
(1)
a and b being empirical constants [39], where a=3.75% and b=3μms-1. Based on the value of S, in each element filling the scaffold pores the following cell phenotypes and the corresponding new tissue types will be predicted to form:
(2)
where nmature, nresorb and m represent boundaries of the mechano-regulation diagram for tissue differentiation [40]. Their values (nresorb=0.01, nmature=0.53, m=3) are taken to be the same as those utilized in previous studies [35-36, 40-41].
Algorithm
An ad hoc algorithm, a graphical summary of which is depicted in Figure 3, was written in Matlab® (v. R2011b) environment that combines a numerical optimization routine with the finite element models and the computational mechano-regulation model described above. The aim of the algorithm was to compute the optimal dimensions A and B (Figures 1 and 2) that allow the amounts of bone developed within the scaffold, during the early stages of the bone regeneration process, to be maximized. In other words, the algorithm determines the best dimensions of parameters A and B based on the hypothesis that the only tissue occupying the scaffold pores is granulation tissue and that the mesenchymal stem cells are homogeneously dispersed throughout the scaffold domain.
Schematic of the algorithm written in Matlab environment for the identification of the optimal geometrical parameters A and B.
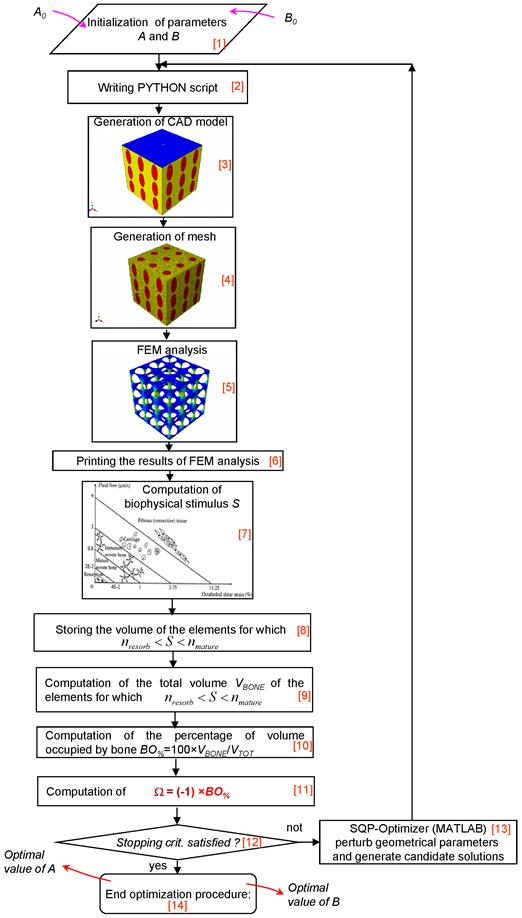
The algorithm first requires the initialization of parameters A and B (Block [1]). The bounds were set very broad in order to increase the design freedom of the optimization process. The lower bounds Amin and Bmin were set equal to 5 μm, -that is a very small dimension rather far from the typical range of pore size for bone tissue scaffolds-, while the upper ones, chosen on the basis of (a) the hypothesized side dimension L of the scaffold (Figures 1 and 2), (b) the pores spatial distribution and (c) the number of pores per unit area, are listed in Table 1. For example, in the case of geometry (i) (aligned elliptic pores, 3×3 pore/face) the maximum diameter of the single pore will be 600 μm and hence the sum of the diameters of all the pores disposed along a row or a column, will be 600 × 3 = 1800 μm that is slightly smaller than the dimension of the side (1913 μm) of the cubic model. The same consideration holds true in the case of geometries (ii), (iii) and (iv). Regarding geometry (vi) (or (vii)), the maximum diameter of the single pore will be 450 μm (or 360 μm) and the sum of the diameters of all the pores disposed along a row or a column, will be 450 × 4 = 1800 μm (or 360 × 5 = 1800 μm). It is worthy to note that for geometry (v) (staggered elliptic pores, 3×3 pore/face), following the hypothesis that changing the values of A and B, the connectivity of the scaffold must remain constant, Amax cannot be greater than 150 μm (and not 300 μm). In fact, exceeding this threshold limit would lead to additional intersections between the pores which imply the change of the original connectivity.
Upper bounds set for dimensions A and B in the algorithm
| Scaffold geometry | Amax [μm] | Bmax [μm] |
|---|---|---|
| (i) Aligned elliptic pores, 3×3 pore/face | 300 | 300 |
| (ii) Aligned circular pores, 3×3 pore/face | 300 | - |
| (iii) Aligned rectangular pores, 3×3 pore/face | 300 | 300 |
| (iv) Aligned square pores, 3×3 pore/face | 300 | - |
| (v) Staggered elliptic pores, 3×3 pore/face | 150 | 300 |
| (vi) Aligned elliptic pores, 4×4 pore/face | 225 | 225 |
| (vii) Aligned elliptic pores, 5×5 pore/face | 180 | 180 |
The initial values given to A and B are defined in a PYTHON script (Block [2]) that is run in ABAQUS. The CAD model (with the same dimensions written in the PYTHON script) (Block [3]) and the finite element mesh (Block [4]) are automatically generated. After applying on the model the boundary and loading conditions above described, a finite element analysis is performed (Block [5]). Then, for each element occupying the scaffold pores (i.e. the elements highlighted in red, see Figures 1 and 2), strain and fluid flow values are printed (Block [6]) and, according to equation (1), the biophysical stimulus S is computed (Block [7]). The computation of S is done at the end of the ramp loading. Based on the magnitude of S and the boundaries of the mechano-regulation diagram for tissue differentiation (the diagram is schematically shown in Figure 3, Block [7]), for each element of the scaffold pores, the cell phenotypes and the corresponding new tissue types are predicted. For the elements for which:
(3)
i.e. for the elements where mature bone is predicted to form, the volume is stored in memory. Then, the algorithm computes the percentage of the total scaffold volume BO% occupied by bone (Block [10]) as:
(4)
where VBONE is the volume obtained by summing up the volume of all the elements for which inequality (3) is satisfied, and VTOT the total volume of the scaffold computed as VTOT = L × L × L= 1.913 × 1.913 × 1.913 ≅ 7 mm3.
The algorithm formulates, hence, an optimization problem including the geometrical parameters A and B as design variables where the objective is to minimize the functional Ω. This optimization problem is stated as follows (Block [11]):
(5)
being Amin, Bmin and Amax, Bmax the lower and the upper bounds, respectively, described above. In other words, the algorithm aims to minimize Ω and then to maximize BO%, i.e. the amounts of bone developed within the scaffold during the early stages of the bone regeneration process. In the case of the geometries with circular (i.e. geometry (ii)) or square (i.e. geometry (iv)) pores, problem (5) includes also the constraint equation (A = B). The inverse problem stated in Eq. (5) is solved with the Sequential Quadratic Programming (SQP) method, a globally convergent gradient-based optimization algorithm available in Matlab®, where the gradients are computed by means of the finite difference approach. The number of iterations performed in the optimization process can be defined by means of stopping criteria. These criteria include several tolerances that can be set by the user. Once one of the stopping criteria is satisfied (Block [12]), the optimization process terminates and the optimal values of A and B are hence given in output (Block [14]). In the case where none of the stopping criteria is meet, the optimization algorithm perturbs geometrical parameters A and B, writes a new PYTHON script thus commencing a new iteration. Iterations will be performed until one of the stopping criteria is satisfied (Block [13]). The solution of the optimization problem, i.e. the values of A and B for which Ω reaches its minimum value, will be between two limit cases: pores too small a) and pores too large b). In the first case, for most of the elements occupying the scaffold pores, inequality (3) will be satisfied but VBONE will be small, as the volume of pores (that can be occupied by bone) is small. In the second case, the volume of the pores (and then, potentially, VBONE) is large but, due to the high values of the biophysical stimulus (caused by the high values of strain) for a very limited number of elements, inequality (3) will be satisfied.
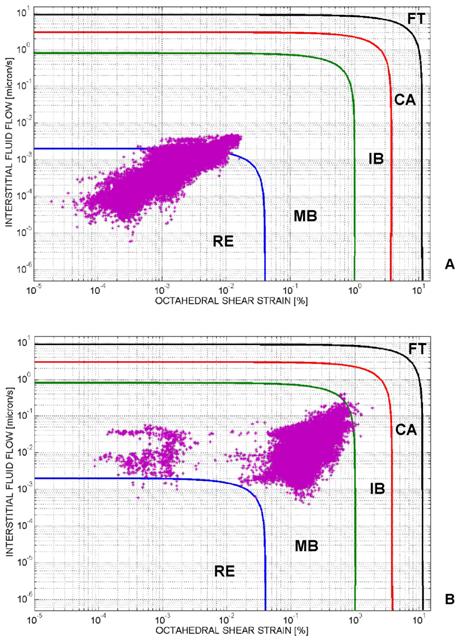
Figure 4, shows the mechano-regulation diagram for tissue differentiation and clarifies how the algorithm works (in particular, the diagram refers to the case of geometry (i), aligned elliptic pores, 3×3 pore/face, pressure 0.005 MPa and E 1500 MPa, Figure 1(A-E)). For each element of the tissue occupying the scaffold pores, the computed interstitial fluid flow v is diagrammed in function of the octahedral shear strain γ. Based on the region where the couple (γ, v) falls, the biophysical stimulus S acting on the element will be: 'Fibrous tissue formation' (FT) or 'Cartilage formation' (CA) or 'Immature Bone formation' (IB) or 'Mature Bone formation' (MB) or, finally, 'Resorption' (RE). The cloud of points (γ, v) computed before the optimization process is principally distributed in the region 'Resorption' (Figure 4A). After implementing the algorithm, the cloud of points moves towards the region 'Mature Bone' (Figure 4B). A very small number of elements is outside the 'Mature Bone formation' (MB) region.
Mechano-regulation diagram for tissue differentiation. For each element of the tissue occupying the scaffold, the computed interstitial fluid flow v is diagrammed in function of the octahedral shear strain γ. Based on the region where the couple (γ, v) falls, the biophysical stimulus acting on the generic element will be: 'Fibrous tissue' (FT) or 'Cartilage' (CA) or Immature Bone' (IB) or 'Mature Bone' (MB) or, finally, 'Resorption' (RE). The cloud of points (γ, v) computed before the optimization process is principally localized in the region 'Resorption' (A). After implementing the algorithm, the cloud of points moves towards the region 'Mature Bone' (B). A very small number of elements is outside the 'Mature Bone formation' (MB) region. In order to better visualize the distribution of the cloud of points in the diagram, the logarithmic scale was utilized on both the axes.
All simulations have been performed on a HP Z620- Intel® Xeon® Processor E5-2620 - 16Gb RAM. Determination of the optimal values of A and B took 10 to 15 hours for each analysis. Considering that: seven geometries have been investigated; for each geometry, three values of scaffold Young's modulus E and eleven levels of pressure have been hypothesized, it follows that 7 × 11 × 3 = 231 analyses were performed for a total of about 3000 hours of computation.
Results
Aligned elliptic pores, 3×3 pore/face
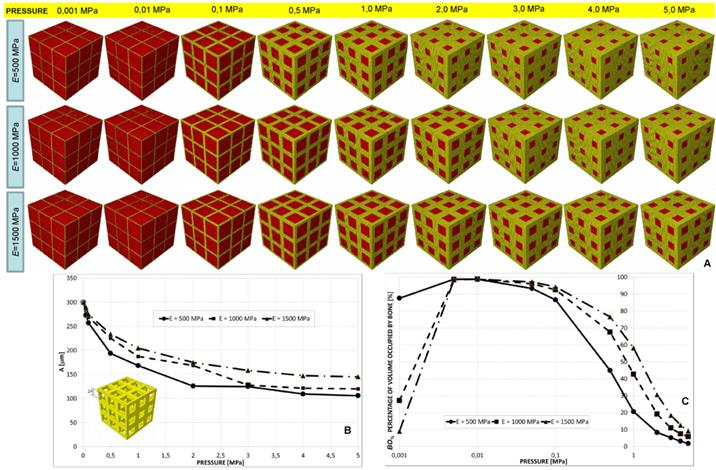
For pressure values smaller than 0.5 MPa, the optimal geometry predicted by the algorithm included almost circular pores (Figure 5A); in particular, the greater the scaffold Young's modulus the small is the difference between the optimal values of A and B (Figure 5(A-B)). For increasing values of pressure, A decreases while B remains almost constant and equal to the maximum value Bmax in the case of E equal to 1000 and 1500 MPa and decreases in the case of E equal to 500 MPa (Figure 5B). Large percentages of volume occupied by bone BO% were predicted to form for very low pressure values (ranging in the interval 0.01-0.1 MPa, Figure 5C). (Note: in order to better visualize the change of BO% with the pressure, the logarithmic scale was utilized on the axis of abscissae. This was done for this and all the diagrams throughout the article illustrating BO% in function of the pressure). For pressures smaller than 0.01 MPa, increasing values of BO% were predicted for decreasing values of the scaffold Young's modulus. For pressures greater than 0.1 MPa, conversely, increasing values of BO% were predicted for increasing values of E (Figure 5C).
(A) Geometrical configurations predicted by the optimization algorithm for different values of pressure and scaffold Young's modulus in the case of aligned elliptic pores, 3×3 pore/face. (B) Optimal values of the parameters A and B predicted by the optimization algorithm in function of the pressure. (C) Percentage of scaffold volume occupied by bone BO% for each optimal design. In order to better visualize the change of BO% with the pressure the logarithmic scale was utilized on the axis of abscissae.

It is important to note that the values of BO% reported in Figure 5C as well in all the other graphs showing BO% in function of the pressure are relative to the optimal design. In other words, for a fixed level of pressure and scaffold Young's modulus, the optimization algorithm after perturbing the values of A and B, finds a very large number of BO%. The percentage illustrated in Figure 5C (and in all the graphs showing BO%) refers to the optimal values of A and B, i.e. is the maximum value of BO% among the others that have been computed.
Aligned circular pores, 3×3 pore/face
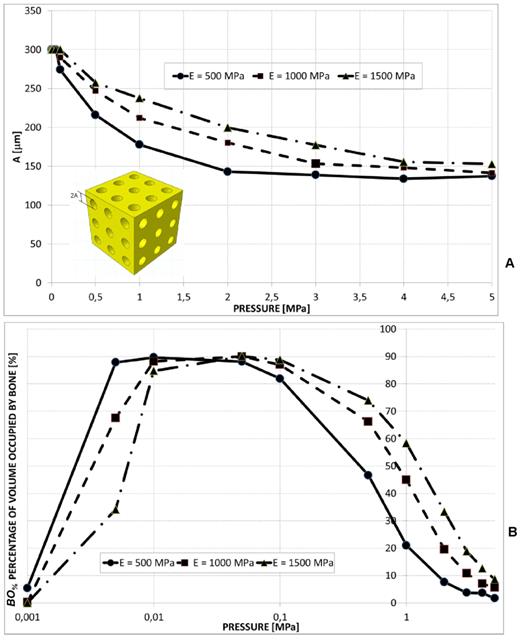
A wide radius of the circular pores was predicted only for pressure values smaller than 0.1 MPa (Figure 6A). Greater values of the scaffold Young's modulus were predicted to lead to larger values of the radius A. Also in this case, for very small pressures (< 0.01 MPa), the percentage of volume occupied by bone increases for decreasing levels of E. On the contrary, for pressures greater than 0.1 MPa, increasing values of BO% were predicted for increasing values of the scaffold Young's modulus (Figure 6B).
(A) Optimal values of the radius A of the aligned circular pores, 3×3 pore/face, predicted by the optimization algorithm for different pressures and scaffold Young's moduli. (B) Percentage of scaffold volume occupied by bone BO% for each optimal design.
Aligned rectangular pores, 3×3 pore/face
For all the pressure values investigated in the study the optimal dimension of B was predicted to remain almost constant and equal to Bmax (Figure 7A). The values of A, instead, were predicted to significantly decrease for increasing levels of pressure. For a fixed value of pressure, the parameter A increases for increasing values of E. The trend of BO% appears similar to that found in the case of elliptic and circular pores.
(A) Parameters A and B predicted by the optimization algorithm diagrammed in function of the pressure in the case of aligned rectangular pores, 3×3 pore/face. (B) Percentage of scaffold volume BO% occupied by bone for each optimal design.
Aligned square pores, 3×3 pore/face
A large value of the side dimension A of the square pore was predicted for very low pressures (Figure 8(A-B)). For pressure values greater than 2-3 MPa, dimension A tends to assume an asymptotic trend and its value increases for increasing values of the scaffold Young's modulus (Figure 8B). The percentage of volume occupied by bone BO% assumes a trend similar to that shown in the previous cases (Figure 8C).
(A) Geometrical configurations predicted by the optimization algorithm for different values of pressure and scaffold Young's modulus in the case of aligned square pores, 3×3 pore/face. (B) Values of A predicted by the optimization algorithm in function of the pressure. (C) Percentage of scaffold volume occupied by bone BO% for each optimal design.
Staggered elliptic pores, 3×3 pore/face
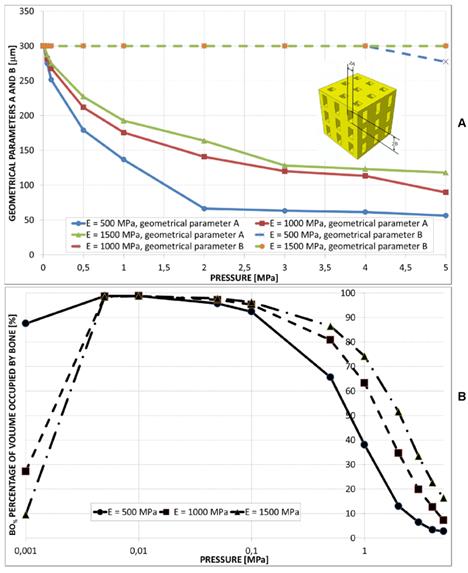
A constant value of B was predicted for all the hypothesized levels of pressure. Dimension A, instead, for a pressure greater than 0.5 MPa, was predicted to decrease (Figure 9(A-B)). For very small values of pressure the percentage of volume occupied by bone is null (Figure 9C) thus indicating that the tissue occupying the scaffold is subject to resorption. Furthermore, the highest values of BO% (about 60 %) are significantly smaller than those predicted for the other geometries.
(A) Geometrical configurations predicted by the optimization algorithm for different values of pressure and scaffold Young's modulus in the case of elliptic staggered pores, 3×3 pore/face. (B) Parameters A and B predicted by the optimization algorithm diagrammed in function of the pressure. (C) Percentage of scaffold volume occupied by bone BO% for each optimal design.
Aligned elliptic pores, 4×4 and 5×5 pore/face
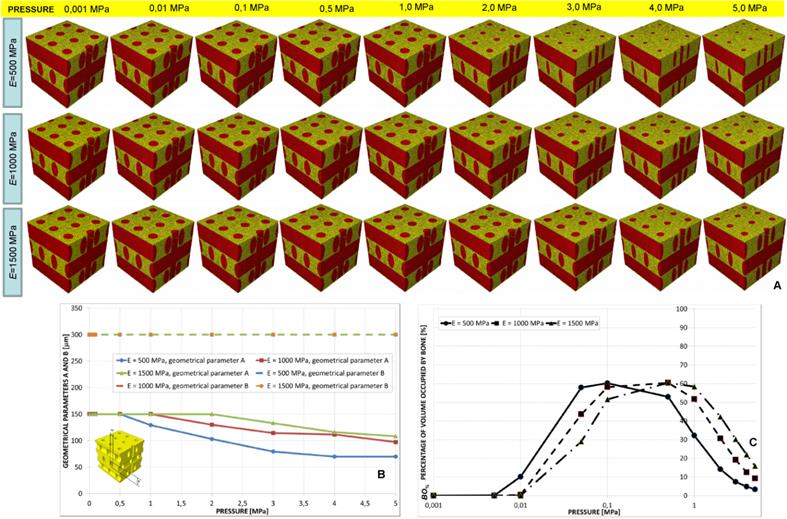
The value of B predicted by the algorithm was almost constant for the all the values of pressure. Parameter A was instead predicted to decrease for increasing levels of pressure (Figure 10A, 10C and Figure 11). The trend of BO% in function of pressure is similar to that shown in the case of aligned elliptic pores, 3×3 pore/face (Figures 10B, 10D).
Parameters A and B predicted by the optimization algorithm diagrammed in function of the pressure (A, C) in the case of aligned elliptic pores, 4×4 pore/face (A) and aligned elliptic pores, 5×5 pore/face (C). Percentage of scaffold volume occupied by bone BO% for each optimal design in the case of 4×4 pore/face (B) and 5×5 pore/face (D).
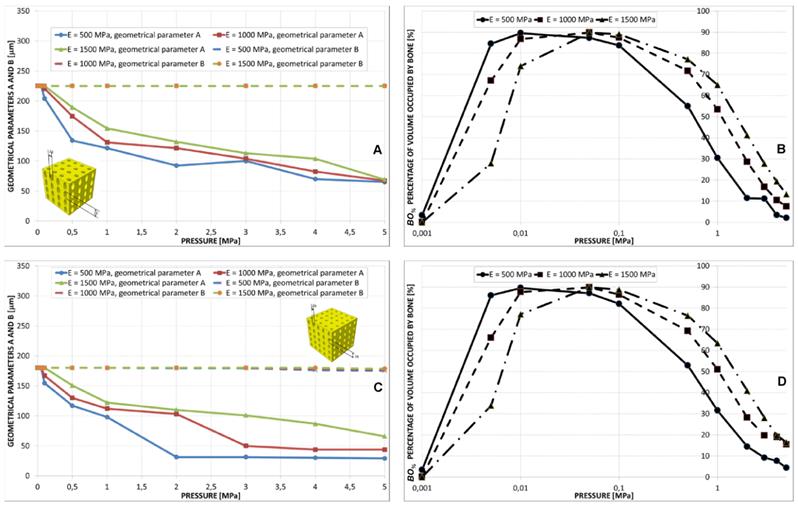
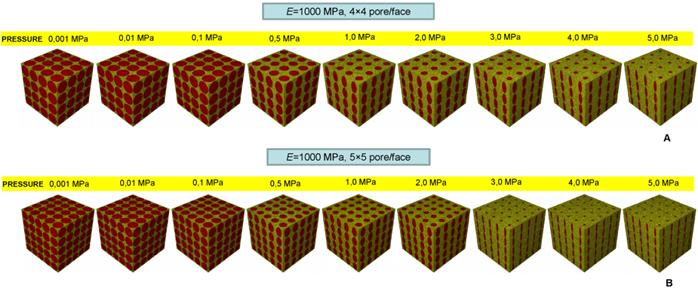
Geometrical configurations predicted by the optimization algorithm for different values of pressure in the case of aligned elliptic pores, 4×4 pore/face (A) and aligned elliptic pores, 5×5 pore/face (B). All the configurations shown in the figure refer to the case of scaffold Young's modulus 1000 MPa.
Analysis of the effect of the shape of the pores, their spatial distribution and the number of pores per unit area
In order to evaluate the effects (1) to (3), BO% was diagrammed in function of the pressure for different shapes of pore (Figure 12A), pore distributions (Figure 12B) and number of pores per unit area (Figure 12C). All the graphs refer to the case of scaffold Young's modulus 1000 MPa.
Percentage of scaffold volume occupied by bone BO% for each optimal design in the case of different pore shapes (A); different pore positioning (B); different numbers of pore/face (C). All the graphs refer to the case of scaffold Young's modulus 1000 MPa.
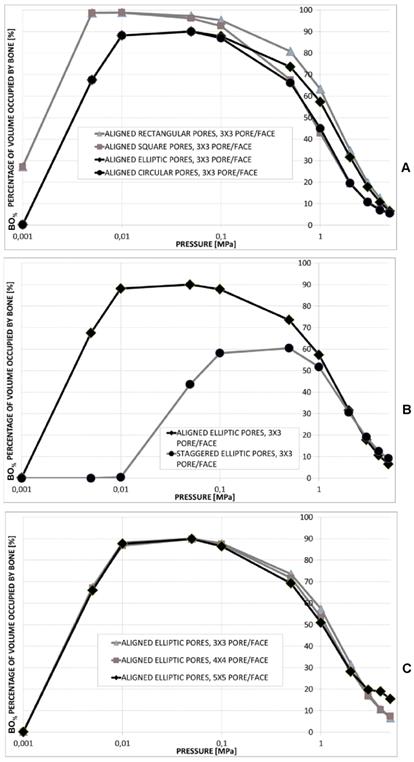
Realizing scaffolds with elliptic pores was predicted to lead to higher values of BO% than the case of circular pores (Figure 12A). However, for very low pressures, values of BO% computed for the two shapes are the same. Analogously, scaffolds with rectangular pores were predicted to produce higher levels of BO% with respect to the case of square pores. Also in this case, for very low values of pressure, the two curves showing BO% in function of pressure are overlapped (Figure 12A). For pressures lower than 1 MPa, scaffolds with rectangular pores were predicted to allow the generation of greater amounts of bone than scaffolds with elliptic pores. For pressures higher than 2 MPa, similar values of BO% were predicted for elliptic and rectangular pores as well as for circular and square pores (Figure 12A).
For pressure values lower than 1 MPa, scaffolds with aligned elliptic pores (3×3 pore/face) allow larger amounts of bone to be generated than those with staggered elliptic pores (3×3 pore/face) (Figure 12B). For pressures higher than 2 MPa, instead, scaffolds with staggered pores were predicted to lead to the formation of slightly larger amounts of bone than the case of aligned pores (Figure 12B).
For very low pressures (< 0.1 MPa) the curves of BO% computed for different numbers of pores per face are overlapped (Figure 12C). In the interval 0.1 - 2.0 MPa, the model with (aligned elliptic) 3×3 pore/face was predicted to have higher levels of BO% than that with 4×4 and 5×5 pore/face. Interestingly, beyond 3 MPa, the trend changes and the geometry with 5×5 pore/face appears to be the most performant as it allows the greatest amounts of bone to be generated.
Discussion
This study presented the first mechanobiology-based optimization algorithm ever developed in the literature to determine the optimal microstructure geometry of bone tissue scaffolds.
The pore shape seems to have important effects on the amounts of bone predicted to form within the scaffold (Figures 5-8, Figure 12A). In general, “oriented” pores (i.e. pores whit A ≠ B) allow greatest amounts of bone to be generated. For example, rectangular pores lead to larger values of BO% compared to square pores; similarly, elliptic pores were predicted to produce higher levels of BO% compared to circular pores (Figure 12A). This can be justified with the argument that in the case of “oriented” pores, two design variables have to be optimized (i.e. A and B) and then greater BO% values can be obtained than the case where just one design variable (e.g. square or circular pores, where A = B) can be optimized. The higher the load, the greater is the “orientation” (i.e. the difference between A and B) of the pores (Figure 5A, Figure 7A, Figure 9A, Figure 10A, 10C, Figure 11). However, for very high loads and for a scaffold Young's modulus of 500 MPa, the elliptic pores tend to assume a circular shape (Figure 5A).
For very low values of pressure, the rectangular pores tend to assume the square shape (Figure 7A, Figure 8(A-B)), as well as the elliptic pores, the circular one (Figure 5(A-B), Figure 6A). For low pressures, in fact, low values of the biophysical stimulus S are computed and hence the optimization algorithm, in order to increase S, tends to increase the dimensions of A and B. At the limit, A is fixed equal to Amax and B to Bmax, where Amax = Bmax.
For very low pressures, square pores allow larger amounts of bone to be generated within the scaffold, than the circular ones (Figure 12A). The circular shape of the pore cross section is in fact inscribed in the square one and then the volume (that can be considered as the protrusion of different pore cross sections) that can be occupied by bone in the case of square pores will certainly be greater than the circular counterpart. For higher pressures, BO% values predicted for the rectangular pores are close to those computed for the elliptic ones, as well as BO% values computed for the square pores are close to those computed for the circular ones (Figure 12A).
Regarding the effect of the pore distribution, it appears that for very low pressure values, scaffolds with aligned pores allow much larger amounts of bone to be generated than scaffolds with staggered pores (Figure 5, Figure 9 and Figure 12B). This is principally due to the geometrical limitation that must be imposed to Amax (in fact, for elliptic staggered pores, Amax cannot exceed 150 μm, see Table 1) to keep constant (during the optimization process) the scaffold connectivity. For high pressure values, instead, the volume percentage occupied by bone BO% for scaffolds with staggered pores is slightly higher than that predicted for scaffolds with aligned pores (Figure 12B).
The effect of the number of pores per unit area appears to be less relevant. In the interval 0.1 - 2.0 MPa, the model with (aligned elliptic) 3×3 pore/face was predicted to exhibit the highest values of BO%. Beyond 3 MPa, instead, the geometry with 5×5 pore/face appears to favorite the formation of the greatest amounts of bone (Figures 10, Figure 11 and Figure 12C).
Regarding the scaffold mechanical properties, it appears that for increasing loads, increasing values of the scaffold Young's modulus are preferable (Figure 5C, Figure 6B, Figure 7B, Figure 8C, Figure 9C, Figure 10(B, D)). In Table 2, for different scaffold geometries and compression loads, the best scaffold Young's modulus is listed, i.e. the value of E for which the highest amounts of bone are predicted to form.
Best values of the scaffold Young's modulus (expressed in MPa) for different scaffold geometries and compression loads
| Scaffold geometry/pressure [MPa] | 0.01 | 0.05 | 0.1 | 0.5 | 1.0 | 2.0 | 3.0 | 4.0 | 5.0 |
|---|---|---|---|---|---|---|---|---|---|
| (i) Aligned elliptic pores, 3×3 pore/face | 500 | 1000 | 1500 | 1500 | 1500 | 1500 | 1500 | 1500 | 1500 |
| (ii) Aligned circular pores, 3×3 pore/face | 500 | 1000 | 1500 | 1500 | 1500 | 1500 | 1500 | 1500 | 1500 |
| (iii) Aligned rectangular pores, 3×3 pore/face | 500 | 1500 | 1500 | 1500 | 1500 | 1500 | 1500 | 1500 | 1500 |
| (iv) Aligned square pores, 3×3 pore/face | 500 | 1500 | 1500 | 1500 | 1500 | 1500 | 1500 | 1500 | 1500 |
| (v) Staggered elliptic pores, 3×3 pore/face | 500 | 500 | 500 | 1000 | 1500 | 1500 | 1500 | 1500 | 1500 |
| (vi) Aligned elliptic pores, 4×4 pore/face | 500 | 1000 | 1500 | 1500 | 1500 | 1500 | 1500 | 1500 | 1500 |
| (vii) Aligned elliptic pores, 5×5 pore/face | 500 | 1000 | 1500 | 1500 | 1500 | 1500 | 1500 | 1500 | 1500 |
Due to the differences in body weight, size, and cross sectional area of bone, the stress values in each human bone can significantly change from a subject to another. This explains why a very broad interval (from 0.001 to 5 MPa) of loads have been tested in the study. However, if one can control the load level, based on the levels of BO% predicted in the study, some pore dimensions should be preferred to others. For instance, in the case of geometry (ii) aligned circular pores, 3×3 pore/face, for a scaffold Young's modulus of 1500 MPa, loads close to 0.05 MPa should be applied to maximize bone formation (Figure 6B). Analogously, for the same geometry and for a scaffold Young's modulus of 500 MPa, the load of 0.005 MPa should be preferred (Figure 6B). Generally speaking, scaffolds should be tailored for the specific anatomic site where they will be implanted. In a low loading environment, scaffolds with large dimension pores can be utilized (Figure 5B, Figure 6A, Figure 7A, Figure 8B, Figure 10A, 10C); scaffolds with smaller and “oriented” pores should be instead utilized in a high loading environment (Figures 5B, Figure 7A, Figure 10A, 10C).
The model utilized in the study presents a number of limitations. The proposed algorithm aims to minimize the functional Ω that depends on the biophysical stimulus S and then on the mechano-regulation hypothesis first proposed by Prendergast et al. [38] and on the same model parameters as has been used in numerous other predictions of tissue repair [9, 35, 42-43]. These mechanobiological models must be continually tested in order to provide further corroboration for the hypotheses on which they are based [14, 44-45]. Other factors known to partially regulate bone regeneration, such as angiogenesis [46-47] and growth factors [48], were not included in the model. The model neglects the temporal variable and predicts the best microstructure based on the hypothesis that only the granulation tissue occupies the scaffold pores and that mesenchymal stem cells are homogeneously distributed throughout the scaffold domain. A more complete, but much more expensive in terms of computational times, model would simulate: (a) the MSCs spreading and diffusion through the scaffold domain, (b) the tissue differentiation and (c) the bone regeneration processes in function of time and would determine the best scaffold geometry based not only on the mechanobiological predictions at the instant t = 0 s but on the entire temporal interval investigated. Any scaffold dissolution processes have also been neglected [8]. Preliminary analyses revealed that, based on the computational time necessary to perform a single finite element analysis and on the number of analyses that should be run to simulate the evolution in time of the regeneration process (that includes also the scaffold dissolution) and to determine the best scaffold geometry, a computational time at least 60-90 times longer (than the time taken to perform the analyses presented in the paper) is required. Increases in computational power will ultimately allow better 4D models to be developed to more accurately simulate the tissue differentiation and the bone regeneration processes occurring in scaffolds. The ideal scaffold geometry is based on the presence of both macro-pores that have been extensively analysed in the present study and of micro-pores that are involved in cell adhesion and differentiation the analysis of which is missing [49]. Given the complexity of the problem and the large number of physical, chemical, biological and mechanical phenomena that are involved, a possible strategy to find the relationships between these two dimension scales consists in implementing multiscale algorithms. A micro-scale model can be utilized to study the cellular adhesion and differentiation, a macro-scale model, instead, can be utilized to determine the “average” loading and boundary conditions acting on the single cell. Homogenization rules can be utilized to transfer information from the micro- to the macro-scale model, localization rules can, instead, be utilized to transfer data from the macro- to the micro-scale model. A similar approach has been utilized in a previous study [9]. The implementation of multiscale algorithms to investigate this field represents the objective of extensive future studies.
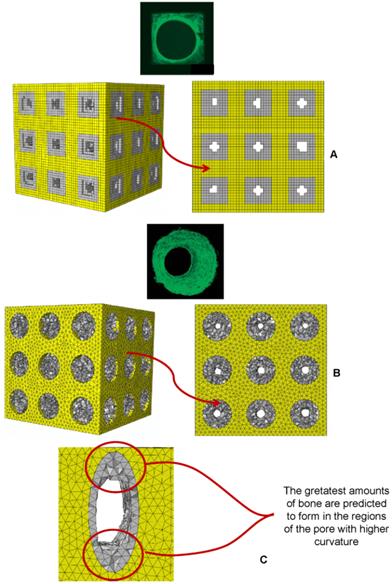
In spite of these limitations, the patterns of bony tissue predicted by the optimization algorithm in the case of aligned square pores (geometry (iv)) and aligned circular pores (geometry (ii)) (pressure 1 MPa, scaffold Young's modulus 1000 MPa) are reasonably consistent with those of new tissue formed in three-dimensional matrix channels observed in an in vitro study [18]. In Figure 13 the gray elements represent the volumes within the scaffold where the algorithm predicts bone formation. Bone forms from the pore walls and tends to develop towards the center of the pore. In the case of square pores, the new bone does not follow the original sharp edge but tends to distribute on a rounded surface (Figure 13). The typical pattern of bony tissue predicted by the algorithm in the case of elliptic pores is also consistent with experimental studies where it has been observed that the rate of tissue generation is proportional to the curvature of the surface [18-20, 50]. Interestingly, in the regions of the pore with the highest curvature the greatest amounts of bone are predicted to form. For instance, Figure 3C shows a detailed view of the typical pattern of bone formed in an elliptic pore, geometry (i), aligned elliptic pores 3×3 pore/face, pressure 5 MPa, E 1500 MPa.
Patterns of bony tissue (3D view and frontal view) predicted by the optimization algorithm in the case of (A) square pores, pressure 1 MPa, scaffold Young's modulus 1000 MPa and (B) circular pores, pressure 1 MPa, scaffold Young's modulus 1000 MPa. The gray elements represent the volumes within the scaffold where bone formation is predicted to occur. The patterns of bone tissue are reasonably consistent with those of new tissue formed in three-dimensional matrix channels observed in an in vitro study [18]. Bone forms from the pore walls and tends to develop towards the center of the pore. In the case of square pores, the new bone does not follow the original sharp edge but tends to distribute on a rounded surface. (C) Detailed view of the pattern of bony tissue predicted to form in an elliptic pore (the case shown refers to geometry (i), E=1500 MPa, pressure 5 MPa). The greatest amounts of bone form in the regions where the curvature of the pore is higher. This is consistent with experimental findings [18-20, 50].
It was shown that a minimum pore size of around ≈ 100 μm is required for successful progression of the bone regeneration process [51]. This threshold dimension is respected in all the scaffold models analyzed in the study (Figures 5-11) with the sole exception of the scaffold with aligned elliptic pores, 5×5 pore/face, E 500 MPa, where dimensions of A slightly smaller were predicted (Figure 10C). However, the values of the ratio between the load and E, for which the pore size was predicted to be smaller than 100 μm, are rather high [8] and hence reasonably far from being representative of the “physiological loading conditions” acting on a real scaffold for bone tissue engineering. It was shown that the change in the mechanical properties of the scaffold leads to an altered rate of bone tissue regeneration [52]. This is consistent with the results of the numerical model. Different amounts of bone in fact, were predicted to be generated for different values of the scaffold Young's modulus (Figure 5C, 6B, 7B, 8C, 9C, 10B, 10D).
Conclusions
A mechanobiology-based algorithm was developed capable of predicting the best scaffold microstructure, i.e. the optimal dimensions A and B of the pores that allow the amounts of bone generated within the scaffold, to be maximized. The effects of the following factors have been investigated: (1) the shape of the pores; (2) their spatial distribution; (3) the number of pores per unit area. The optimal dimensions of the pores have been determined for different values of scaffold Young's modulus and compression loading. The main results of the study are listed below.
1) “Oriented” pores (i.e. pores whit A ≠ B) allow greatest amounts of bone to be generated than the “not oriented” (i.e. pores whit A = B) ones. For example, rectangular pores lead to larger volumes of bone compared to square pores; similarly, elliptic pores were predicted to produce greater amounts of bone compared to circular pores.
2) For very low load values, scaffolds with aligned pores allow much larger amounts of bone to be generated than scaffolds with staggered pores; for high pressure values, instead, the volume percentage occupied by bone for scaffolds with staggered pores is slightly higher than that predicted for scaffolds with aligned pores.
3) The number of pores per unit area appears to have negligible effects on the amounts of bone that can be generated in the scaffold.
4) For increasing loads, increasing values of the scaffold Young's modulus are preferable.
5) In a low loading environment, scaffolds with large dimension pores can be utilized; scaffolds with smaller and “oriented” pores should be instead utilized in a high loading environment.
These results represent a proof-of-principle demonstration of the possibility to optimize the scaffold microstructure based on mechanobiological criteria.
Competing Interests
The authors have declared that no competing interest exists.
References
1. Bianco P, Robey PG. Stem cells in tissue engineering. Nature. 2001;414:118-21
2. Lacroix D, Planell JA, Prendergast PJ. Computer-aided design and finite element modelling of biomaterial scaffolds for bone tissue engineering. Philos T Roy Soc A. 2009;367:1993-2009
3. Sanz-Herrera JA, García-Aznar JM, Doblaré M. A mathematical approach to bone tissue engineering. Philos T Roy Soc A. 2009;367:2055-78
4. van der Meulen MCH, Huiskes R. Why mechanobiology? A survey article. J Biomech. 2002;35:401-14
5. Sun W, Lal P. Recent development on computer aided tissue engineering—a review. Comput Meth Prog Bio. 2002;67:85-103
6. Sun W, Darling A, Starly B, Nam J. Computer aided tissue engineering: overview, scope and challenges. Biotechnol Appl Bioc. 2004;39:29-47
7. Sun W, Starly B, Darling A, Gomez C. Computer aided tissue engineering: biomimetic modelling and design of tissue engineering. Biotechnol Appl Bioc. 2004;39:49-58
8. Byrne DP, Lacroix D, Planell JA, Kelly DJ, Prendergast PJ. Simulation of tissue differentiation in a scaffold as a function of porosity, Young's modulus and dissolution rate: application of mechanobiological models in tissue engineering. Biomaterials. 2007;28:5544-54
9. Boccaccio A, Ballini A, Pappalettere C, Tullo D, Cantore S, Desiate A. Finite Element Method (FEM), Mechanobiology and Biomimetic Scaffolds in Bone Tissue Engineering. Int J Biol Sci. 2011;7:112-32
10. Sandino C, Planell JA, Lacroix D. A finite element study of mechanical stimuli in scaffolds for bone tissue engineering. J Biomech. 2008;41:1005-14
11. Olivares A, Marsal E, Planell JA, Lacroix D. Finite element study of scaffold architecture design and culture conditions for tissue engineering. Biomaterials. 2009;30:6142-9
12. Milan JL, Planell JA, Lacroix D. Computational modelling of the mechanical environment of osteogenesis within a polylactic acid-calcium phosphate glass scaffold. Biomaterials. 2009;30:4219-26
13. Milan JL, Planell JA, Lacroix D. Simulation of bone tissue formation within a porous scaffold under dynamic compression. Biomech Model Mechanobiol. 2010;9:583-96
14. Khayyeri H, Checa S, Tägil M, Prendergast PJ. Corroboration of mechanobiological simulations of tissue differentiation in an in vivo bone chamber using a lattice-modeling approach. J Orthop Res. 2009;27:1659-66
15. Hendrikson WJ, van Blitterswijk CA, Verdonschot N, Moroni L, Rouwkema J. Modeling Mechanical Signals on the Surface of mCT and CAD Based Rapid Prototype Scaffold Models to Predict (Early Stage) Tissue Development. Biotechnol Bioeng. 2014;111:1864-75
16. Velasco MA, Narváez-Tovar CA, Garzón-Alvarado DA. Design, Materials, and Mechanobiology of Biodegradable Scaffolds for Bone Tissue Engineering. Biomed Res Int. 2015 Article ID 729076, 21 pages
17. Zadpoor AA. Bone tissue regeneration: the role of scaffold geometry. Biomater Sci. 2015;3:231-45
18. Rumpler M, Woesz A, Dunlop JW, van Dongen JT, Fratzl P. The effect of geometry on three-dimensional tissue growth. J R Soc Interface. 2008;5:1173-80
19. Bidan CM, Kommareddy KP, Rumpler M, Kollmannsberger P, Bréchet YJ, Fratzl P, Dunlop JW. How linear tension converts to curvature: geometric control of bone tissue growth. PLoS One. 2012;7:e36336
20. Bidan CM, Wang FM, Dunlop JW. A three-dimensional model for tissue deposition on complex surfaces. Comput Methods Biomech Biomed Eng. 2013;16:1056-70
21. Gamsjäger E, Bidan C, Fischer F, Fratzl P, Dunlop JW. Modelling the role of surface stress on the kinetics of tissue growth in confined geometries. Acta Biomater. 2013;9:5531-43
22. Bidan CM, Kommareddy KP, Rumpler M, Kollmannsberger P, Fratzl P, Dunlop JW. Geometry as a factor for tissue growth: towards shape optimization of tissue engineering scaffolds. Adv Healthcare Mater. 2013;2:186-94
23. Bianchi M, Urquia Edreira ER, Wolke JG, Birgani ZT, Habibovic P, Jansen JA, Tampieri A, Marcacci M, Leeuwenburgh SC, van den Beucken JJ. Substrate geometry directs the in vitro mineralization of calcium phosphate ceramics. Acta Biomater. 2014;10:661-69
24. Van Bael S, Chai YC, Truscello S, Moesen M, Kerckhofs G, Van Oosterwyck H, Kruth JP, Schrooten J. The effect of pore geometry on the in vitro biological behavior of human periosteum-derived cells seeded on selective laser-melted Ti6Al4 V bone scaffolds. Acta Biomater. 2012;8:2824-34
25. Feng YF, Wang L, Li X, Ma ZS, Zhang Y, Zhang ZY, Lei W. Influence of Architecture of β-Tricalcium Phosphate Scaffolds on Biological Performance in Repairing Segmental Bone Defects. PLoS One. 2012;7:e49955
26. Guyot Y, Papantoniou I, Chai YC, Van Bael S, Schrooten J, Geris L. A computational model for cell/ECM growth on 3D surfaces using the level set method: a bone tissue engineering case study. Biomech Model Mechanobiol. 2014;13:1361-71
27. Giannitelli SM, Accoto D, Trombetta M, Rainer A. Current trends in the design of scaffolds for computer-aided tissue engineering. Acta Biomater. 2014;10:580-94
28. Rainer A, Giannitelli SM, Accoto D, De Porcellinis S, Guglielmelli E, Trombetta M. Load-Adaptive Scaffold Architecturing: A Bioinspired Approach to the Design of Porous Additively Manufactured Scaffolds with Optimized Mechanical Properties. Ann Biomed Eng. 2012;40:966-75
29. Dias MR, Guedes JM, Flanagan CL, Hollister SJ, Fernandes PR. Optimization of scaffold design for bone tissue engineering: A computational and experimental study. Med Eng Phys. 2014;36:448-57
30. Coelho PG, Hollister SJ, Flanagan CL, Fernandes PR. Bioresorbable scaffolds for bone tissue engineering: optimal design, fabrication, mechanical testing and scale-size effects analysis. Med Eng Phys. 2015;37:287-96
31. Lin CY, Kikuchi N, Hollister SJ. A novel method for biomaterial scaffold internal architecture design to match bone elastic properties with desired porosity. J Biomech. 2004;37:623-36
32. Almeida Hde A, Bártolo PJ. Virtual topological optimisation of scaffolds for rapid prototyping. Med Eng Phys. 2010;32:775-82
33. Wieding J, Wolf A, Bader R. Numerical optimization of open-porous bone scaffold structures to match the elastic properties of human cortical bone. J Mech Behav Biomed Mater. 2014;37:56-68
34. Boccaccio A, Kelly DJ, Pappalettere C. A Mechano-Regulation Model of Fracture Repair in Vertebral Bodies. J Orthop Res. 2011;29:433-43
35. Boccaccio A, Pappalettere C, Kelly DJ. The influence of expansion rates on mandibular distraction osteogenesis: a computational analysis. Ann Biomed Eng. 2007;35:1940-60
36. Boccaccio A, Prendergast PJ, Pappalettere C, Kelly DJ. Tissue differentiation and bone regeneration in an osteotomized mandible: a computational analysis of the latency period. Med Biol Eng Comput. 2008;46:283-98
37. Boccaccio A, Lamberti L, Pappalettere C. Effects of aging on the latency period in mandibular distraction osteogenesis: a computational mechano-biological analysis. J Mech Med Biol. 2008;8:203-25
38. Prendergast PJ, Huiskes R, Søballe K. Biophisical stimuli on cells during tissue differentiation at implant interfaces. J Biomec. 1997;30:539-48
39. Huiskes R, van Driel WD, Prendergast PJ, Søballe K. A biomechanical regulatory model of periprosthetic tissue differentiation. J Mater Sci Mater Med. 1997;8:785-8
40. Lacroix D, Prendergast PJ. A mechano-regulation model for tissue differentiation during fracture healing: analysis of gap size and loading. J Biomech. 2002;35:1163-71
41. Boccaccio A, Kelly DJ, Pappalettere C. A model of tissue differentiation and bone remodelling in fractured vertebrae treated with minimally invasive percutaneous fixation. Med Biol Eng Comput. 2012;50:947-59
42. Kelly DJ, Prendergast PJ. Mechano-regulation of stem cell differentiation and tissue regeneration in osteochondral defects. J Biomech. 2005;38:1413-1422
43. Andreykiv A, Prendergast PJ, van Keulen F. Swieszkowski W, Rozing PM. Bone ingrowth simulation for a concept glenoid component design. J Biomech. 2005;38:1023-33
44. Isaksson H, Donkellar CC, Huiskes R, Ito K. Corroboration of mechanoregulatory algorithms for tissue differentiation during fracture healing: Comparison with in vivo results. J Orthop Res. 2006;24:898-907
45. Isaksson H. Recent advances in mechanobiological modeling of bone regeneration. Mech Res Commun. 2012;42:22-31
46. Geris L, Gerisch A, Sloten JV, Weiner R, Oosterwyck HV. Angiogenesis in bone fracture healing: a bioregulatory model. J Theor Biol. 2008;251:137-58
47. Sandino C, Checa S, Prendergast PJ. Lacroix D. Simulation of angiogenesis and cell differentiation in a CaP scaffold subjected to compressive strains using a lattice modeling approach. Biomaterials. 2010;31:2446-52
48. Bailón-Plaza A, Van Der Meulen MCH. A mathematical framework to study the effects of growth factor influences on fracture healing. J Theor Biol. 2001;212:191-209
49. Bose S, Roy M, Bandyopadhyay A. Recent advances in bone tissue engineering scaffolds. Trends biotechnol. 2012;30:546-54
50. Knychala J, Bouropoulos N, Catt C, Katsamenis O, Please C, Sengers B. Pore geometry regulates early stage human bone marrow cell tissue formation and organisation. Ann Biomed Eng. 2013;41:917-30
51. Karageorgiou V, Kaplan D. Porosity of 3D biomaterial scaffolds and osteogenesis. Biomaterials. 2005;26:5474-91
52. Yavari SA, van der Stok J, Ahmadi S, Wauthlé R, Schrooten J, Weinans H, Zadpoor AA. Mechanical analysis of a rodent segmental bone defect model: The effects of internal fixation and implant stiffness on load transfer. J Biomech. 2014;47:2700-8
Author contact
![]() Corresponding author: Dr. Antonio Boccaccio. Mailing Address: Dipartimento di Meccanica, Matematica e Management, Politecnico di Bari, Viale Japigia, 182, 70126, Bari, Italy. Contact Information: Tel: +39-0805962829; Fax: +39-0805962777; E-mail: a.boccaccioit
Corresponding author: Dr. Antonio Boccaccio. Mailing Address: Dipartimento di Meccanica, Matematica e Management, Politecnico di Bari, Viale Japigia, 182, 70126, Bari, Italy. Contact Information: Tel: +39-0805962829; Fax: +39-0805962777; E-mail: a.boccaccioit