Impact Factor ISSN: 1449-2288
- Issue 12; 2026
- Issue 11; 2026
- Issue 10; 2026
- Issue 9; 2026
- Issue 8; 2026
- Volume 22; 2026
- Past Issues
- Advance Articles
- Editorial Board
- Cover Images
- Index & Coverage
- Cover Suggestion
- Special Issues
Introduction
Materials and Methods
Results
Discussion
Conclusion
Supplementary Material
Acknowledgements
References

 Global reach, higher impact
Int J Biol Sci 2016; 12(2):210-218. doi:10.7150/ijbs.13057 This issue Cite
Research Paper
Diabetes Induced Changes in Podocyte Morphology and Gene Expression Evaluated Using GFP Transgenic Podocytes
Jianxiang Xu1 ![]() , Shirong Zheng1, Patricia M. Kralik1, Laxminarayanan Krishnan2, Hui Huang1,4, James B. Hoying2, Lu Cai1, Edward C. Carlson3, Yi Tan1, Paul N. Epstein1
, Shirong Zheng1, Patricia M. Kralik1, Laxminarayanan Krishnan2, Hui Huang1,4, James B. Hoying2, Lu Cai1, Edward C. Carlson3, Yi Tan1, Paul N. Epstein1
1. Department of Pediatrics, University of Louisville;
2. Cardiovascular Innovations Institute, University of Louisville;
3. Department of Anatomy, University of North Dakota;
4. Children's Hospital of Jiangxi Province, China.
Received 2015-6-26; Accepted 2015-10-26; Published 2016-1-1
Abstract

The effect of diabetes in vivo has not been examined on isolated podocytes. To achieve this, GFP was expressed constitutively in podocytes of PGFP transgenic mice which were bred to OVE mice to produce diabetic OVE-GFP mice. Viewing GFP fluorescence, foot processes of OVE-GFP podocytes were visually and measurably effaced, which did not occur with less severe STZ diabetes. Over 300,000 podocytes were purified from each PGFP mouse but only 49,000 podocytes per diabetic OVE-GFP mouse. The low yield from OVE-GFP mice appeared to be due to more fragile state of most OVE-GFP diabetic podocytes which did not survive the isolation process. Diabetic podocytes that were isolated had high levels of the lipid peroxidation product 4-HNE and they were more sensitive to death due to oxidative stress. Gene array analysis of OVE-GFP podocytes showed strong diabetes induction of genes involved in inflammation. Four CXC chemokines were induced at least 3-fold and the chemokine CXCL1 was shown for the first time to be specifically induced in podocytes by OVE, dbdb and STZ diabetes.
Keywords: diabetic nephropathy, podocytes, gene expression, chemokines, transgenic
Introduction
Diabetes injures podocytes [1, 2] and diabetic podocytes are visibly abnormal. Electron microscopy shows widening and retraction of the diabetic podocyte foot process (FP)[3, 4]. Diabetic patients lose podocytes in their urine [5] and podocyte loss is considered a key factor leading to diabetic nephropathy (DN) [6] . However the mechanism for diabetic injury to podocytes is not understood, in part because the purest diabetic podocytes analyzed have been diabetic glomeruli, which consist of less than 30% podocytes. Several labs reported using fluorescent tagged podocytes in combination with fluorescent activated cell sorting (FACS) to purify podocytes for studying podocyte gene [7] or protein expression [8]. However, this approach has not been applied to diabetic models. The same fluorescent markers used for podocyte purification also facilitate more detailed visualization of podocytes, including light level discrimination of individual FPs [9, 10]. In the current study a constitutively active, podocin-GFP transgene is used to produce fluorescent tagged podocytes for the purpose of determining how severe, OVE26 (OVE) diabetes effects podocyte gene expression, oxidative stress and FP effacement.
Materials and Methods
Transgenes
The PGFP transgene was constructed to produce podocyte targeted expression of enhanced GFP. The transgene consisted of a 2.5 kb fragment of the human podocin promoter, which has been demonstrated to produce podocyte specific expression [11], ligated in front of the gene for green fluorescent protein (GFP) mutated to produce enhanced fluorescence [12]. A second transgene, commonly used for visual recognition of transgenic mice in albino strains by expression of tyrosinase in melanocytes [13, 14] was co-injected with the PGFP transgene into embryos.
Mice
PGFP transgenic mice were produced with fertilized FVB embryos at the University of Louisville transgenic mouse facility and maintained on the FVB background. Diabetic OVE-GFP mice were produced by crossing the PGFP line with the transgenic diabetic line OVE [15], also on FVB background. All studies were performed on PGFP and OVE-GFP mice on the background FVB. Mice of both sexes were used from 3 to 5 months of age.
Additional diabetic models were utilized in some studies to determine if the results obtained with OVE-GFP mice applied to other diabetic models. One diabetic model used was dbdb on the FVB background [16]. For dbdb experiments non-diabetic db heterozygotes were used as controls. The other diabetic model tested was multiple low dose streptozotocin diabetes produced on PGFP mice, which had been crossed to the C57BL6 background. Non-diabetic PGFP mice on the C57BL6 background were used as control. PGFP mice were transferred to C57BL6 by backcrossing more than 10 generations to C57BL6 mates. Multiple low dose streptozotocin diabetes induction was performed as described previously[17]. Except for the PGFP and OVE [18] lines generated by the authors other mouse lines were initially obtained from Jackson Laboratories and maintained at the University of Louisville. All animal procedures conformed to NIH guidelines and were approved by the University of Louisville Animal Care and Use Committee.
Podocyte isolation
Magnetic bead isolated glomeruli [19] were dispersed to single cells by 30 min digestion in 1 ml of 0.25% trypsin (Invitrogen) at 37oC and 5% CO2 . Cells were then washed at 450xg in 10% FCS, RPMI 1640 and resuspended in 2% FCS RPMI 1640 before sorting on a BD FACS Aria.
Podocyte survival and 4HNE assays
Podocytes were cultured in F12/DMEM containing 5% FBS, 0.5% insulin-tranferrin-Selenium A. Cell survival assays were performed using Invitrogen Alamar Blue kits in 96 well plates with 2000 cells per well. 4HNE content was measured using OxiSelect™ HNE-His Adduct ELISA Kits (Cell-Biolabs) with 1 µg podocyte protein per sample.
Gene array
For gene array podocytes samples were prepared from 5 OVE-GFP and 4 PGFP mice on the FVB background. The five diabetic mice were 3 to 5 months of age and were had 24 hour urine albumin excretion between 75 and 155 mg. Podocyte RNA samples were prepared with picoPure RNA isolation kits (Arcturus). Gene array probes were prepared using WT- Ovation™ Pico RNA Amplification and Biotin labeling kits (NuGen) and were hybridized to Affymetrix Mouse -430 2.0 GeneChips. Gene array data is available on the GEO database (GSE36209). Fold change and P values were uploaded to Metacore (Thomson Reuters, https://portal.genego.com) for analysis. Quantitative rtPCR (QrtPCR) assays were performed using Taqman primers (ABI) and relative expression was calculated by the 2-ΔΔCT method as previously described [20].
Antibodies
WT1, actin and synaptopodin antibodies were from Santa Cruz. CXCL1 antibody was from Abcam. Osteopontin antibody was from R&D system and complement C3 antibody was from MP Biomedicals.
Immunohistochemistry
Formalin perfused kidneys were immersed in 30% sucrose, embedded in OCT and cryosectioned at 10 μm. Sections were pre-incubated in Dako retrieval solution for 30 min at 500C before staining overnight at 40C with antibodies to synaptopodin (1:50), osteopontin (1:40), complement component C3 (1:100) or CXCL1 (1:50) followed by fluorescent labeled second antibodies as previously described [2, 21].
Confocal Imaging
For movies 200 µm sections of formalin fixed kidney in agar were examined on Olympus FV-1000 confocal. Microscope stacks of GFP images taken 1um apart, to encompass the maximal depth visible of the glomerulus were converted to 8-bit stacks and imported into Amira (Visage Imaging, San Diego, CA) for volume rendering as described earlier [22].
For examining podocyte processes, formalin perfused kidneys were immersed in 30% sucrose and 15 μm sections prepared on a cryostat or 75 μm sections prepared on a Vibratome. Sections were observed on a Leica TCS SP2 confocal microscope with a 63X objective. Podocyte processes were most visible on the glomerular surface closest to the objective. Selection of secondary processes for quantitation was based on clarity of the image. Foot process measurement was performed with Leica Application Suite Lite.
Podocyte Number, Density and Glomerular Volume
Except for the use of GFP instead of WT1 for identifying podocytes, morphometric procedures are described in on our previous publications [2, 21]. Images of 48 PGFP and 59 OVE-GFP glomeruli from 3 kidneys per group were analyzed by two observers blind to group identity.
Statistical analysis
For one parameter analyses measured in just two groups (OVE-GFP diabetic group versus PGFP non-diabetic group) statistical comparisons were calculated by t-test or Mann-Whitney Rank Sum Test. The response of diabetic and non-diabetic podocytes in the presence of two concentrations of hydrogen peroxide or without hydrogen peroxide was made by two-way ANOVA and Holm-Sidak multiple comparison procedure. Statistics were calculated with SigmaPlot software. P-values provided for Metacore process networks were calculated by the Metacore software based on the probability of obtaining the degree of overlap between the number of objects in the Network set and the number of OVE-GFP genes tested for overlap.
Results
GFP Transgenic podocytes
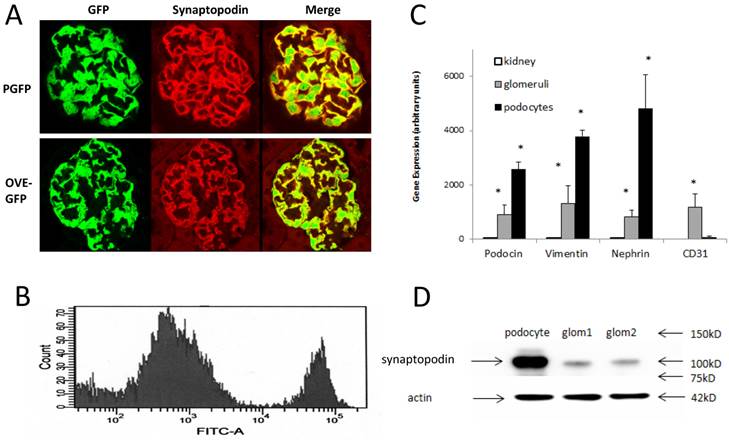
PGFP transgenic mice were made on the FVB background. Diabetic OVE-GFP mice were produced by crossing PGFP mice with the diabetic strain OVE also on FVB background. Podocyte specific expression of GFP was demonstrated in both diabetic and non-diabetic mice by showing synaptopodin and GFP expression in the same cells (Figure 1A).
Immunofluorescence localization of GFP in podocytes and purification of fluorescent podocytes: (A) GFP and synaptopodin are expressed in the same cells of PGFP (upper row) and diabetic OVE-GFP (lower row). Confocal images are from 3 month old mice taken with a 63X objective. (B) Flow cytometry histogram of cells from PGFP glomeruli shows a distinct podocyte peak (far right). (C) Enrichment of 3 podocyte marker RNAs in purified podocytes demonstrated by quantitative rtPCR of RNA from kidney, glomeruli and podocytes (normalized to 18S RNA). The endothelial marker CD31 was tested only in podocytes and glomeruli. An * indicates that rtPCR values were different for that gene in podocytes than in other samples at P<0.05 by 1 way ANOVA for vimentin and podocin, Kruskal-Wallis test for nephrin or by t-test for CD31. Values are the averages ±SEM from 4 podocyte, 3 kidney and 3 glomeruli samples. (D) Western blot showing enrichment of synaptopodin in podocytes relative to glomeruli, arrows at 42 kD, 75 kD, 100 kD and 150 kD indicate the position of stained MW markers, densitometry indicated a 4.55 fold enrichment of synaptopodin in podocytes.
Podocyte purification
GFP podocytes were FACS isolated (Figure 1B) from trypsin dispersed glomeruli. Compared to PGFP glomeruli, isolated podocytes were over 3-fold enriched for podocyte specific RNAs and over ten-fold reduced in content of endothelial marker CD31 (Figure 1C). By western blot WT1 protein was enriched in PGFP podocytes compared to PGFP glomeruli (Figure 1D). The average number of podocytes obtained per PGFP mouse was 329,778±19,971 (n=15). But diabetic podocyte yield was 6-fold lower, only 49,317±6,513 (n=10). The low yield of OVE-GFP podocytes prompted us to count GFP positive podocytes per glomerulus in fixed kidneys. Those results demonstrated that GFP podocyte number per glomerulus in PGFP and OVE-GFP mice was similar (Table 1) and this factor could not explain the 6-fold lower yield of purified OVE-GFP podocytes.
GFP podocyte density, glomerular volume and GFP podocyte number per glomerulus of PGFP and OVE-GFP mice.a
| GFP Podocytes per μm ³ Glomerular Volume | Glomerular Volume μm ³ | GFP Podocytes per Glomerulus | |
|---|---|---|---|
| PGFP | 0.0004±0.00002 | 325,581±31,438 | 145±7 |
| OVE-GFP | 0.0002±.0.00001* | 698,706±41,296* | 138±7 |
a: Images of 48 PGFP and 59 OVE-GFP glomeruli were counted by 2 scorers blind to the identity of the section. Calculation of glomerular volume and counting were performed as previously described [2, 21]. Each value is the mean ± SEM. An asterisk indicates that the two groups were different (P<0.0001, by t-test).
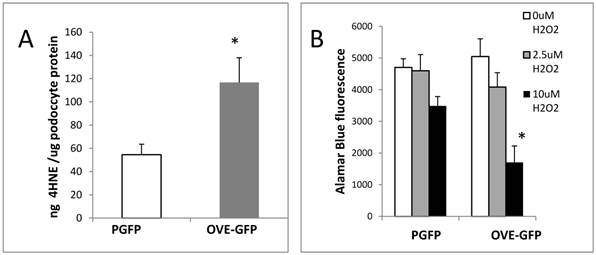
Following isolation podocytes were extracted or cultured with H2O2 to determine if OVE-GFP podocytes were more susceptible to oxidative injury than PGFP podocytes. The assays of podocyte extracts (Figure 2A) demonstrated that content of lipid peroxidation product 4-hydroxynonenal (4HNE) was 2-fold higher in diabetic podocytes. Diabetic podocytes in culture were also more sensitive to ROS injury as indicated by twice as much death in OVE-GFP podocytes compared to PGFP podocytes when exposed to 10 μM H2O2 (Figure 2B).
Oxidative stress in diabetic OVE-GFP podocytes. A. Increased content of lipid peroxidation product 4HNE in diabetic podocytes. B. Increased sensitivity of isolated OVE-GFP podocytes to H2O2. n=4 or 5 per group. In A * indicates P<0.05 between PGFP and OVE-GFP by t-test. In B * indicates that 10 µm H2O2 significantly reduced cell viability in OVE-GFP podocytes compared to PGFP podocytes at the same dose or OVE-GFP podocytes at lower levels of H2O2, P<0.05 by two way ANOVA. Vertical bars are the SEM.
Differences between normal and diabetic podocyte morphology visualized with GFP
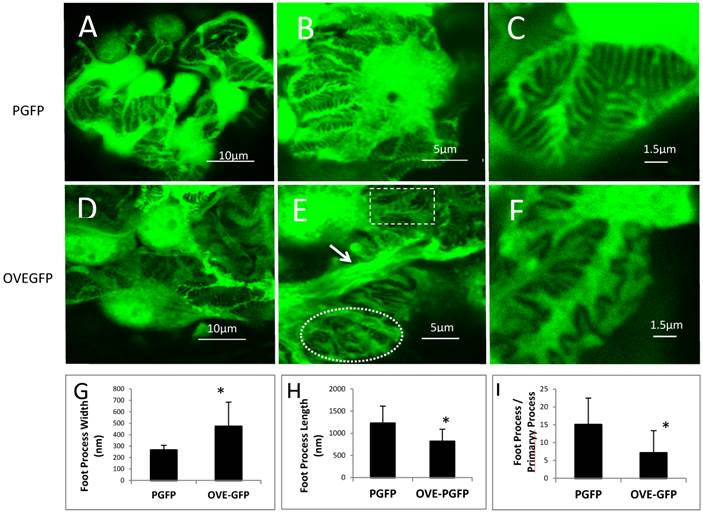
FPs of PGFP podocytes were discernable (Figures 3A-C) by confocal imaging. In non-diabetic mice FPs were well aligned, evenly spaced and relatively uniform. Diabetic FPs were less abundant and less uniform (Figures 3D-F). Quantitatively OVE-GFP FPs were 78 percent wider (Figure 3G), two-thirds as long (Figure 3H) and half as numerous (Figure 3I) as non-diabetic FPs (all P<0.01). Both normal appearing and effaced FPs were present in the same OVE-GFP glomerulus (Figure 3E). In addition to abnormal FPs, primary processes of OVE-GFP podocytes appeared unusually wide (arrows in Figure 3E), which was most evident on podocytes with nearby effaced FPs. Confocal imaging was also performed on three PGFP mice crossed 10 generations to C57BL6 and then made diabetic with STZ. These diabetic mice did not demonstrate effaced FPs (Additional File 1: Figure S1).
FP effacement in diabetic podocytes. Representative confocal images from glomeruli of PGFP (A-C) and OVE-GFP (D-F) mice at 4 months of age at 3 magnification indicated by the scale bars. The rectangle and oval in panel E enclose normal and effaced FPs, respectively, present in one diabetic glomerulus. The arrow in panel E points to an abnormally thick primary podocyte processes. Graphs in panels G and H show reduced average FP width and length for OVE-GFP podocytes compared to PGFP (n>100 FPs measured from >5 glomeruli from 3 mice per group). Panel I shows there are fewer FPs per major process in OVE-GFP podocytes compared to PGFP (FPs counted on 23 major processes, from 3 mice per group). Vertical bars are the SD and * indicates P≤0.01 by t-test.
Endogenous GFP fluorescence permitted confocal viewing of podocytes through the depth of most of the glomerulus and 3D reconstruction of glomeruli. Movies S1-S3 show a normal PGFP glomerulus (movie S1), a hypertrophied OVE-GFP glomerulus (movie S2) and a hypertrophied, sclerotic OVE-GFP glomerulus (movie S3). The movies demonstrate that the surfaces of diabetic, OVE-GFP glomeruli (movies S2 and S3) are jagged and discontinuous compared to the smooth, continuous surface of the non-diabetic glomerulus (movie S1).
Gene expression in isolated PGFP and OVE-GFP podocytes
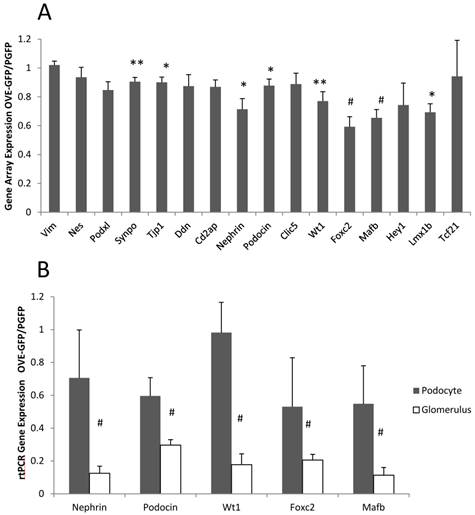
Gene array analysis was performed on podocyte RNA from PGFP and OVE-GFP mice, as described in Materials and Methods. Most significant gene expression changes (P<0.05) produced by diabetes were up-regulations: 327 RNAs were 2-fold elevated and 122 RNAs were more than 3-fold elevated in diabetic samples, while only 152 RNAs and 31 RNAs were reduced by diabetes 2 or over 3-fold, respectively. (Additional File 1: Tables S1 and S2 show the 40 most up and down regulated diabetic RNAs). Unexpectedly, not one RNA decreased 2-fold by diabetes was for a podocyte specific RNA. The gene array results indicated that diabetes had a small effect on podocyte specific RNA expression (Figure 4A). Inhibition of podocyte specific gene expression is a typical response in diabetes [23, 24] including the OVE model [2]. To reassess this result we compared expression of 5 podocyte specific RNAs by qPCR in podocyte and glomerular samples. Unexpectedly these assays suggested that OVE diabetes produced a 2-10 fold greater inhibitory effect when measured in glomerular samples compared to measurement in podocyte samples (Figure 4B).
Different effect of OVE diabetes on expression of podocyte specific RNAs when measured in podocytes and glomeruli. (A) Affymetrix gene array analysis of 16 podocyte specific RNAs in podocyte samples. Columns show the ratio of diabetic OVE-GFP to non-diabetic PGFP signal intensity for each RNA. (B) QrtPCR assays of 5 podocyte specific RNAs in podocyte and glomerular samples. Columns show the ratio of diabetic OVE-GFP to non-diabetic PGFP expression measured in podocytes and glomeruli. QrtPCR assays were normalized to GAPDH. For gene array n=5 OVE-GFP and 4 PGFP. For QrtPCR podocytes n=5 OVE-GFP and 4 PGFP. For QrtPCR glomeruli samples n=7 OVE-GFP and 9 PGFP. * P≤0.05, ** P≤0.02 and # P≤0.01 by t-test. Vertical bars are the SEM. Mice were of both sexes from 3-5 months of age.
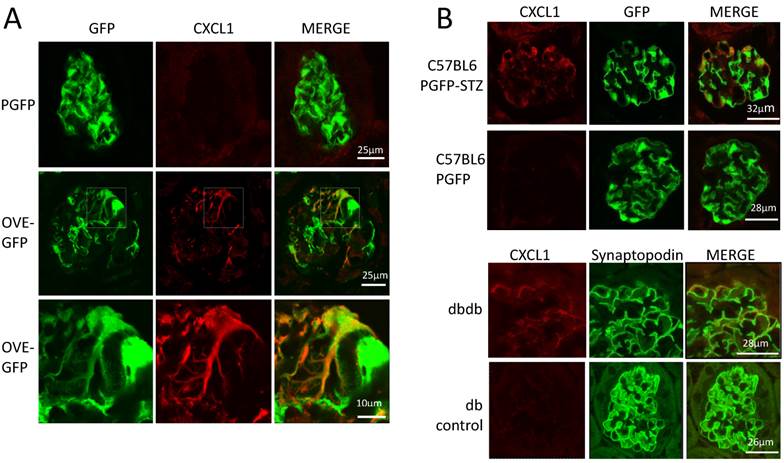
The podocyte gene array results were inspected for data that were consistent with changes previously reported in diabetic kidneys. RNA for inflammatory proteins osteopontin and complement component C3 have been shown to be significantly elevated in diabetic podocytes or glomeruli [24-26]. In our podocyte gene array results, induction of these RNAs by diabetes was obvious (osteopontin and C3 were induced 3.9 and 10.8 fold, respectively in OVE-GFP podocytes compared to PGFP podocytes, P<0.05 by t-test). Immunohistochemistry (Additional File 1: Figure S2) supported the gene array findings. Metacore software analysis indicated that cellular processes related to inflammation or leucocyte chemotaxis (Table 2) comprised 5 of the 10 most enriched cellular processes for genes highly induced by diabetes. Four C-X-C motif chemokines of a total of 15 [27] murine CXC chemokines were elevated 3-fold or more in diabetic podocytes (Table 3). Of these CXCL1 had the highest expression and diabetes induction was verified by CXCL1 antibody staining (Figure 5A). CXCL1 immunostaining was evident only in diabetic samples and indicated that CXCL1 was specific for podocytes, though not every diabetic podocyte stained for CXCL1. Induction of CXCL1 has not been reported in DN. To test whether CXCL1 was induced in other diabetic models immunostaining was also performed on STZ treated PGFP mice, dbdb mice and non-diabetic control mice. Both STZ and dbdb diabetes induced CXCL1 staining (Figures 5B-C) in podocytes, which was not seen in podocytes of control animals. Even more obvious than with OVE-GFP, many STZ and dbdb podocytes did not stain for CXCL1.
Process Networks most enriched in genes up 3-fold (p<0.05) in OVE-GFP podocytes.a
| Rank | Process Network | Network Objects Increased 3X / Total Network Size | P- Value | Network Objects Increased 3X |
|---|---|---|---|---|
| 1 | Inflammation_Complement system | 7/73 | 0.00 | Clusterin, C5AR, C3dg, C3, iC3b, C3a, C3b |
| 2 | Cell adhesion_Cell junctions | 7/162 | 0.00 | Occludin, Desmoglein 2, Claudin-7, Keratin 18, Keratin 8/18, E-cadherin, Keratin 8 |
| 3 | Cytoskeleton_Intermediate filaments | 5/81 | 0.00 | NEFL, NEFM, Keratin 18, Keratin 8/18, Keratin 8 |
| 4 | Inflammation_Innate inflammatory response | 7/181 | 0.00 | C5AR, β-defensin 1, IL-1F6, C3, C3a, C3b, COX-2 (PTGS2) |
| 5 | Chemotaxis | 7/137 | 0.00 | Gα(q)-GPCRs, Gα(i)-GPCRs, C5AR, Osteopontin, CXCL1, CXCL16, CXCL2 |
| 6 | Immune response Phagocytosis | 6/222 | 0.00 | APOB, C3, C3b, C3dq, iC3b, LDL |
| 7 | Development Neurogenesis Axonal Guidance | 6/230 | 0.02 | Calcyclin, NEFL, NEFM, Neuropilin-1, Semaphorin 3C, SPOCK2 |
| 8 | Immune response Phagosome in antigen presentation | 6/243 | 0.02 | C3, C3dq, Cathepsin S, HLA-DQA1, iC3b, MHC classII |
| 9 | Development Cartilage development | 3/66 | 0.02 | Activin beta A, Collagen XII, MGP |
| 10 | Cell adhesion_Leucocyte chemotaxis | 6/205 | 0.03 | Gα(q)-GPCRs, Gα(i)-GPCRs, MHC class II, CXCL1,CXCL16 |
a Process Networks are network models created by Metacore of main cellular processes based on GO-processes and pathway maps. The P-value column indicates the probability calculated by Metacore software of obtaining the degree of overlap between the set of objects in the Network and the set of OVE-GFP genes increased 3 fold.
C-X-C chemokines elevated over 3-fold in diabetic podocytes.a
| chemokine | PGFP signal | OVE-GFP signal | Fold Increase | P-value |
|---|---|---|---|---|
| CXCL1 | 819±128 | 2,998±762 | 3.7 | 0.02 |
| CXCL10 | 46±10 | 278±114 | 6.1 | 0.02 |
| CXCL16 | 41±6 | 129±39 | 3.2 | 0.02 |
| CXCL2 | 5±2 | 82±34 | 15.1 | 0.07 |
a Values are the average signal intensity for 4 PGFP and 5 OVE-GFP samples ± the standard error. P values are by Mann-Whitney Rank Sum Test except for CXCL2 which is by t-test.
Diabetes in 3 models induces CXCL1 in some podocytes. (A) There is no CXCL1 staining in PGFP podocytes (upper row) but CXCL1 stains some podocytes in an OVE-GFP glomerulus (middle row). The bottom row shows expansion of the region enclosed by a rectangle in the middle row. CXCL1 staining is most intense in podocytes with weak GFP fluorescence and weak in podocytes with strong GFP fluorescence. All PGFP and OVE-GFP mice are on FVB background. STZ (B) and dbdb (C) diabetes also induced CXCL1 in some but not all podocytes. In the top row of panel B diabetes was induced in PGFP mice on the C57BL6 background using multiple low dose STZ. The next row is control, without STZ injection. Podocytes are indicated by GFP fluorescence from the PGFP transgene. Panel C shows glomeruli from dbdb diabetic and db non-diabetic mice on FVB background. Podocytes are indicated by synaptopodin staining. CXCL1 staining is red, podocytes are green from GFP or synaptopodin staining. Confocal images were made using a 63X objective. The scale for images on each row is shown in the MERGE image on the right.
Discussion
This study utilized transgenic GFP expression to analyze the effects of OVE diabetes on podocytes. FP effacement was seen and quantitated by light microscopy. Only about 17% of diabetic podocytes survived FACS purification. Compared to normal podocytes, isolated diabetic podocytes contained higher 4HNE content and they were more sensitive to ROS exposure. OVE-GFP diabetic podocytes expressed elevated levels of RNA for several inflammatory proteins including CXCL1. CXCL1 was shown to be induced in multiple models of diabetes, mostly in podocytes.
GFP fluorescence revealed major effects of diabetes on podocyte morphology that could not be seen by light microscopy. Podocyte FP effacement is a marker of podocyte pathology and characteristic of DN [28]. During effacement the FP widens, shortens and retracts into the primary process. This progression may be a direct effect of podocyte injury that increases the risk of detachment or an adaptive response [4] to help resist detachment. Until recently, detection of effacement required imaging by electron microscopy. Several laboratories [9, 10, 29] reported that FPs could be visualized by confocal microscopy in mice displaying heterogeneous podocyte fluorescence. FP visualization required non-adjacent podocytes to have contrasting fluorescence, achieved by mosaic expression of one fluorescent protein [9, 10] or by stochastic multicolor fluorescence labeling of podocytes [29]. In this study, one transgene expressed GFP from the podocin promoter, active in all podocytes. The images of FPs in PGFP mice were apparently as clear as published images for the induced mosaic and mutilcolor transgenic strains [9, 10, 29]. Since the PGFP transgene is a single transgene, is available on FVB and C57BL6 backgrounds and does not require titration with an inducer, PGFP is a simpler transgenic tool to study podocytes in many mouse models. Because it uses only one fluorescent protein, PGFP may be easier to use on a cell sorter than multicolor strains. On the other hand PGFP mice do not have the ability to use color contrast to distinguish adjacent podocytes which is an inherent advantage of the multicolor transgenic strain [29].
Podocyte FPs were visibly effaced in diabetic OVE-GFP mice (Figure 2), which was statistically verified on measurements of FPs. Similar effacement of OVE podocyte FPs was found using EM [30]. In contrast, effacement was not seen on podocytes of PGFP mice made diabetic with multiple low dose STZ on the C57BL6 background (Additional File 1: Figure S1). This is consistent with a prior report of no effacement visible by EM [17] in C57BL6 mice made diabetic with multiple low dose STZ. For both OVE and STZ diabetic models confocal GFP images produced the same conclusions for FP effacement as electron microscopy.
Other abnormalities were evident by visualizing fluorescence of OVE-GFP podocytes. Many primary processes were much wider in OVE-GFP podocytes, suggesting that the pathology affecting FPs may affect much of the podocyte cytoskeleton. There were potentially relevant changes in diabetic gene expression. Metacore software identified the biological network Cytoskeleton Intermediate Filaments (Table 2) as highly enriched for genes induced by diabetes. RNAs of cytoskeletal genes for keratins and neurofilament polypeptides were particularly induced. Diabetic podocyte morphology was heterogeneous. A single diabetic glomerulus contained clusters of effaced and relatively normal appearing FPs. Podocyte fluorescence also enabled production of movies showing that the outer surface of normal PGFP glomeruli was a nearly continuous layer of podocyte cell bodies and processes whereas the surface of diabetic OVE-PGFP glomeruli was jagged and podocytes made up only a discontinuous portion of the glomerular surface.
Podocytes were FACS purified to analyze the effect diabetes had on podocyte composition. The major obstacle was poor yield, only 1/6th as many podocytes were isolated from OVE-GFP mice as from PGFP mice. Initially this suggested that OVE-GFP mice had far fewer podocytes or that diabetes turned off GFP expression. These possibilities were evaluated by counting GFP fluorescent podocytes per glomerulus in PGFP and OVE-GFP fixed kidney sections. These counts showed no difference in fluorescent podocyte number per glomerulus (Table 1). The values determined by counting GFP cells were within 9% and 18% of values published for FVB and OVE glomeruli, calculated from EM images [30]. Since fluorescent podocyte numbers were almost the same in situ a more likely explanation for the 6-fold lower yield was that OVE-GFP podocytes did not survive purification. This possibility was supported by the findings that even diabetic podocytes sturdy enough to be purified were damaged compared to non-diabetic podocytes, as indicated by high content of ROS damage marker 4HNE and more sensitivity to hydrogen peroxide exposure (Figure 4). The low yield also raised the possibility that purified OVE-GFP podocytes were a sub-population selected for minimal damage by diabetes. DN and other renal diseases down-regulate podocyte specific RNAs [21] [31]. Since these RNAs are present only in podocytes, their expression can be measured accurately in podocytes or glomeruli. Diabetes appeared to produce much greater inhibition of podocyte specific RNA expression when analyzed in glomeruli compared to analysis performed in purified podocytes (Figure 5). The different results supports the conclusion that FACS isolated diabetic podocytes are a selected population with more normal RNA expression than the total diabetic podocyte population. OVE diabetes on the FVB background produces especially severe DN [32] with extensive podocyte damage [33] possibly predisposing this model to low yields of purified podocytes.
This is the first report on how in vivo diabetes alters podocyte gene expression, determined in isolated podocytes. Although not all OVE-GFP podocytes were collected it was still apparent that podocyte expression of many genes was markedly altered by diabetes. By Metacore software analysis of gene array results, inflammatory and chemotaxis networks were the cellular processes most enriched with diabetes induced genes (Table 2). Consistent with prior reports [25, 34] diabetes induced the RNA for pro-inflammatory protein osteopontin. Complement component C3 RNA, previously shown to be induced in diabetic human glomeruli [24] was shown herein to be elevated in diabetic podocytes. While RNAs for osteopontin and C3 were strongly induced in diabetic podocytes their induction was not specific to podocytes, increased staining for both proteins was evident in other glomerular cells and in tubules (Additional File 1: Figure S2).
Podocyte gene array results demonstrated strong diabetes induction of 4 members of the CXC subfamily of pro-inflammatory [27] chemokines (Table 3) Diabetic culture conditions induce CXC chemokines in podocyte cell lines [35], but their induction by diabetes in vivo has not been reported before. CXCL1 antibody staining of fixed kidney sections demonstrate many diabetic podocytes express CXCL1 and non-diabetic podocytes do not (Figure 5). CXCL1 was also induced in podocytes of dbdb and STZ diabetic mice. Unlike osteopontin and C3, diabetic induction of CXCL1 was mostly specific for podocytes. Expression of CXC chemokine receptor RNAs is low and not induced by diabetes (data not shown). This may indicate that podocyte secreted chemokines are not acting on podocytes in a paracrine fashion, rather podocyte secreted chemokines may act to attract leucocytes or effect activity of adjacent endothelial cells. Grgic et al recently reported CXCL1 induction in podocytes in a mouse model of FSGS [36] , which indicates that CXCL1 induction occurs in response to other types of podocyte stress as well as diabetes.
Conclusion
The constitutive expression of GFP in transgenic podocytes provides a simple tool for evaluating the effect of diabetes on podocyte morphology, providing results consistent with electron microscopy observations for FP effacement in 2 diabetic models. Using GFP to isolate diabetic podocytes is limited by the fact that diabetic podocytes are fragile, resulting in isolation of just the sturdiest, least damaged diabetic podocytes. Therefore the RNA expression results obtained in this study are probably biased towards the least damaged diabetic podocytes. Despite this limitation isolated diabetic podocyte samples enabled identification of inflammatory chemokines, which had not previously been shown to be induced in diabetic podocytes.
Supplementary Material
Additional File 1Figures S1-S2 and Tables S1-S2.
Movie S1.
Movie S2.
Movie S3.
Acknowledgements
We appreciate the excellent technical support of Yun Huang.
Funding
This work was supported by Juvenile Diabetes Research Foundation grant 1-INO-2014-116-A-N and NIH grant RO1-DK072032.
Competing Interests
The authors have declared that no competing interest exists.
References
1. Reidy K, Kang HM, Hostetter T, Susztak K. Molecular mechanisms of diabetic kidney disease. J Clin Invest. 2014;124:2333-40
2. Zheng S, Carlson EC, Yang L, Kralik PM, Huang Y, Epstein PN. Podocyte-specific overexpression of the antioxidant metallothionein reduces diabetic nephropathy. J Am Soc Nephrol. 2008;19:2077-85
3. Toyoda M, Najafian B, Kim Y, Caramori ML, Mauer M. Podocyte Detachment and Reduced Glomerular Capillary Endothelial Fenestration in Human Type 1 Diabetic Nephropathy. Diabetes. 2007
4. Kriz W, Shirato I, Nagata M, LeHir M, Lemley KV. The podocyte's response to stress: the enigma of foot process effacement. Am J Physiol Renal Physiol. 2013;304:F333-47
5. Nakamura T, Ushiyama C, Suzuki S, Hara M, Shimada N, Ebihara I. et al. Urinary excretion of podocytes in patients with diabetic nephropathy. NephrolDialTransplant. 2000;15:1379-83
6. Pagtalunan ME, Miller PL, Jumping-Eagle S, Nelson RG, Myers BD, Rennke HG. et al. Podocyte loss and progressive glomerular injury in type II diabetes. J Clin Invest. 1997;99:342-8
7. Brunskill EW, Georgas K, Rumballe B, Little MH, Potter SS. Defining the molecular character of the developing and adult kidney podocyte. PLoS One. 2011;6:e24640
8. Boerries M, Grahammer F, Eiselein S, Buck M, Meyer C, Goedel M. et al. Molecular fingerprinting of the podocyte reveals novel gene and protein regulatory networks. Kidney Int. 2013;83:1052-64
9. Grgic I, Brooks CR, Hofmeister AF, Bijol V, Bonventre JV, Humphreys BD. Imaging of podocyte foot processes by fluorescence microscopy. Journal of the American Society of Nephrology: JASN. 2012;23:785-91
10. Hohne M, Ising C, Hagmann H, Volker LA, Brahler S, Schermer B. et al. Light microscopic visualization of podocyte ultrastructure demonstrates oscillating glomerular contractions. Am J Pathol. 2013;182:332-8
11. Moeller MJ, Sanden SK, Soofi A, Wiggins RC, Holzman LB. Two gene fragments that direct podocyte-specific expression in transgenic mice. Journal of the American Society of Nephrology: JASN. 2002;13:1561-7
12. Cormack BP, Valdivia RH, Falkow S. FACS-optimized mutants of the green fluorescent protein (GFP). Gene. 1996;173:33-8
13. Yokoyama T, Silversides DW, Waymire KG, Kwon BS, Takeuchi T, Overbeek PA. Conserved cysteine to serine mutation in tyrosinase is responsible for the classical albino mutation in laboratory mice. Nucleic acids research. 1990;18:7293-8
14. Ribar TJ, Epstein PN, Overbeek PA, Means AR. Targeted overexpression of an inactive calmodulin that binds Ca2+ to the mouse pancreatic beta-cell results in impaired secretion and chronic hyperglycemia. Endocrinology. 1995;136:106-15
15. Zheng S, Noonan WT, Metreveli NS, Coventry S, Kralik PM, Carlson EC. et al. Development of Late-Stage Diabetic Nephropathy in OVE26 Diabetic Mice. Diabetes. 2004;53:3248-57
16. Chua S Jr, Liu SM, Li Q, Yang L, Thassanapaff VT, Fisher P. Differential beta cell responses to hyperglycaemia and insulin resistance in two novel congenic strains of diabetes (FVB- Lepr (db)) and obese (DBA- Lep (ob)) mice. Diabetologia. 2002;45:976-90
17. Qi Z, Fujita H, Jin J, Davis LS, Wang Y, Fogo AB. et al. Characterization of susceptibility of inbred mouse strains to diabetic nephropathy. Diabetes. 2005;54:2628-37
18. Epstein PN, Overbeek PA, Means AR. Calmodulin-induced early-onset diabetes in transgenic mice. Cell. 1989;58:1067-73
19. Takemoto M, Asker N, Gerhardt H, Lundkvist A, Johansson BR, Saito Y. et al. A new method for large scale isolation of kidney glomeruli from mice. AmJPathol. 2002;161:799-805
20. Wang J, Wang Q, Watson LJ, Jones SP, Epstein PN. Cardiac overexpression of 8-oxoguanine DNA glycosylase 1 protects mitochondrial DNA and reduces cardiac fibrosis following transaortic constriction. American journal of physiology Heart and circulatory physiology. 2011;301:H2073-80
21. Yang L, Zheng S, Epstein PN. Metallothionein over-expression in podocytes reduces adriamycin nephrotoxicity. Free Radic Res. 2009;43:174-82
22. Krishnan L, Underwood CJ, Maas S, Ellis BJ, Kode TC, Hoying JB. et al. Effect of mechanical boundary conditions on orientation of angiogenic microvessels. Cardiovascular Research. 2008;78:324-32
23. Doublier S, Salvidio G, Lupia E, Ruotsalainen V, Verzola D, Deferrari G. et al. Nephrin expression is reduced in human diabetic nephropathy: evidence for a distinct role for glycated albumin and angiotensin II. Diabetes. 2003;52:1023-30
24. Woroniecka KI, Park AS, Mohtat D, Thomas DB, Pullman JM, Susztak K. Transcriptome analysis of human diabetic kidney disease. Diabetes. 2011;60:2354-69
25. Lorenzen J, Shah R, Biser A, Staicu SA, Niranjan T, Garcia AM. et al. The role of osteopontin in the development of albuminuria. J Am Soc Nephrol. 2008;19:884-90
26. Susztak K, Bottinger E, Novetsky A, Liang D, Zhu Y, Ciccone E. et al. Molecular profiling of diabetic mouse kidney reveals novel genes linked to glomerular disease. Diabetes. 2004;53:784-94
27. Chung AC, Lan HY. Chemokines in renal injury. J Am Soc Nephrol. 2011;22:802-9
28. Ellis EN, Steffes MW, Chavers B, Mauer SM. Observations of glomerular epithelial cell structure in patients with type I diabetes mellitus. Kidney Int. 1987;32:736-41
29. Tao J, Polumbo C, Reidy K, Sweetwyne M, Susztak K. A multicolor podocyte reporter highlights heterogeneous podocyte changes in focal segmental glomerulosclerosis. Kidney Int. 2014;85:972-80
30. Carlson EC, Chhoun JM, Laturnus DI, Bikash KC, Berg B, Zheng S. et al. Podocyte-specific overexpression of metallothionein mitigates diabetic complications in the glomerular filtration barrier and glomerular histoarchitecture: a transmission electron microscopy stereometric analysis. Diabetes Metab Res Rev. 2013;29:113-24
31. Hodgin JB, Borczuk AC, Nasr SH, Markowitz GS, Nair V, Martini S. et al. A molecular profile of focal segmental glomerulosclerosis from formalin-fixed, paraffin-embedded tissue. The American journal of pathology. 2010;177:1674-86
32. Xu J, Huang Y, Li F, Zheng S, Epstein PN. FVB mouse genotype confers susceptibility to OVE26 diabetic albuminuria. Am J Physiol Renal Physiol. 2010;299:F487-94
33. Burger D, Thibodeau JF, Holterman CE, Burns KD, Touyz RM, Kennedy CR. Urinary podocyte microparticles identify prealbuminuric diabetic glomerular injury. J Am Soc Nephrol. 2014;25:1401-7
34. Nicholas SB, Liu J, Kim J, Ren Y, Collins AR, Nguyen L. et al. Critical role for osteopontin in diabetic nephropathy. Kidney Int. 2010;77:588-600
35. Anderberg RJ, Meek RL, Hudkins KL, Cooney SK, Alpers CE, Leboeuf RC. et al. Serum amyloid A and inflammation in diabetic kidney disease and podocytes. Lab Invest. 2015;95:250-62
36. Grgic I, Hofmeister AF, Genovese G, Bernhardy AJ, Sun H, Maarouf OH. et al. Discovery of new glomerular disease-relevant genes by translational profiling of podocytes in vivo. Kidney international. 2014;86:1116-29
Author contact
![]() Corresponding author: Jianxiang Xu, phone: 502-852-2651, fax: 502-852-5634, e-mail: j0xu0006louisville.edu , Louisville, KY 40202
Corresponding author: Jianxiang Xu, phone: 502-852-2651, fax: 502-852-5634, e-mail: j0xu0006louisville.edu , Louisville, KY 40202