Impact Factor ISSN: 1449-2288
- Issue 12; 2026
- Issue 11; 2026
- Issue 10; 2026
- Issue 9; 2026
- Issue 8; 2026
- Volume 22; 2026
- Past Issues
- Advance Articles
- Editorial Board
- Cover Images
- Index & Coverage
- Cover Suggestion
- Special Issues
Introduction
Materials and methods
Results
Discussion
Supplementary Material
Acknowledgements
References

 Global reach, higher impact
Int J Biol Sci 2016; 12(7):799-811. doi:10.7150/ijbs.13310 This issue Cite
Research Paper
Global Identification and Differential Distribution Analysis of Glycans in Subcellular Fractions of Bladder Cells
Ganglong Yang1*, Luyu Huang2*, Jiaxu Zhang1, Hanjie Yu3, Zheng Li3, Feng Guan1 ![]()
1. The Key Laboratory of Carbohydrate Chemistry & Biotechnology, Ministry of Education; School of Biotechnology, Jiangnan University, Wuxi, China;
2. The Key Laboratory of Biological Pesticide and Chemical Biology, Ministry of Education; College of Life Sciences, Fujian Agriculture and Forestry University, Fuzhou, China;
3. Laboratory for Functional Glycomics, College of Life Sciences, Northwest University, Xi'an, China.
*These authors contributed equally to the study.
Received 2015-7-22; Accepted 2016-4-12; Published 2016-5-15
Abstract

Compartmentalization of cellular components and their associated biological processes is crucial for cellular function. Protein glycosylation provides a basis for diversity of protein functions. Diversity of glycan composition in animal cells remains poorly understood. We used differential centrifugation techniques to isolate four subcellular protein fractions from homogenate of metastatic bladder YTS1 cells, low grade nonmuscle invasive bladder cancer KK47 cells and normal bladder epithelia HCV29 cells: microsomal (Mic), mitochondrial (Mito), nuclear (Nuc), and cytosolic (Cyto). An integrated strategy combining lectin microarray and mass spectrometry (MS) analysis was then applied to evaluate protein glycosylation of the four fractions. Lectin microarray analysis revealed significant differences among the four fractions in terms of glycan binding to the lectins LCA, AAL, MPL, WGA and PWM in YTS1 cell, STL, Jacalin, VVA, LCA and WGA in KK47, and ConA, GNA, VVA and ACA in HCV29 cell. Among a total of 40, 32 and 15 N-glycans in four fractions of three cells detected by MS analysis, high-mannose and fucosylated structures were predominant, 10 N-glycans in YTS1, 5 N-glycans in KK47 and 7 N-glycans in HCV29 were present in all four fractions; and 10 N-glycans in YTS1, 16 N-glycans in KK47, and 3 N-glycans in HCV29 were present in only one fraction. Glycans in the latter category are considered potential markers for the corresponding organelles. The integrated strategy described here allows detailed examination of glycomes subcellular fraction with high resolution and sensitivity, and will be useful for elucidation of the functional roles of glycans and corresponding glycosylated proteins in distinct organelles.
Keywords: glycan, glycosylated protein
Introduction
Posttranslational modifications (PTMs), which include acetylation, phosphorylation, sulfation, methylation, hydroxylation, amidation, glycosylation, and ubiquitination, are key steps in protein biosynthesis. Glycosylation, one of the most common PTMs, is conserved in organisms ranging from yeast to humans, and is the predominant PTM in 50-70% of proteins in mammalian cells [1]. Major classes of glycosylation in eukaryotic cells are defined based on different linkages of glycans to the core regions on protein, i.e., N-linked glycan (N-(Asn) linked oligosaccharide), O-linked glycan (O-GalNAc linkage to Ser/Thr), and other types of “O-linked glycan” such as O-linked mannose and O-linked GlcNAc. N-linked oligosaccharides are found in >50% of glycosylated proteins [2, 3]. N-linked glycosylation facilitates protein folding, protects proteins from breakdown into smaller polypeptides (proteolysis), and helps direct protein trafficking [4-6]. Changes in glycan structures may modify or directly alter protein functions or physiochemical properties. Certain glycosylation changes in proteins are hallmarks of disease states, including sialyl Lewis x (sLex ), sialyl Tn (sTn), Globo H, Lewis y (Ley ) and polysialic acid (PSA) [7]. Many of these epitopes are observed in malignant tissues throughout the body, including the brain, breast, colon and prostate [8]. Thus, glycan composition is a form of coding for cellular physiology.
Increasing research effort has been paid toward development of novel methods of glycosylation analysis, including glycogene-based DNA microarrays [5], lectin microarrays [9], and mass spectrometry (MS) [5, 10]. Application of these approaches in protein analysis has not been perfected, and elucidation of glycan structures in proteins is often difficult and time-consuming [11]. Characterization of N-glycan structures will be facilitated by reducing complexity and increasing overall sensitivity of the methods through prefractionation and enrichment of glycans from complex mixtures, which include lectins, graphitized carbon, titanium dioxide, hydrazide chemistry and boronic acids method [12].
Subcellular components such as organelles and non-organelle structures in the cell interior have close relationships and also play important roles independent of each other in overall cell functioning [13]. In order to elucidate various cell functions, studies of protein composition in terms of tissue- and organelle-specific expression will be helpful for clarifying subcellular organization, structure, and functions [14, 15]. Proteomic marker ensembles of subcellular organelles have been identified in various cell types [16]. However, global patterns of glycan synthesis and subcellular localization in cell organelles and organelle systems remain poorly known. Identification of glycomes at the subcellular level is necessary to complement whole-cell glycome information.
Density gradient centrifugation and differential centrifugation technology have been widely applied for organelle isolation [17]. Two major steps are commonly performed to separate organelles: disruption of cellular organization (homogenization) and fractionation of the homogenate [18]. Subcellular fractionation methods enhance "detection coverage" of the proteome or other molecules through MS techniques [19-21]. MS techniques have also led to considerable progress in glycan identification and glycomic analysis [22, 23]. However, few MS studies to date have focused on subcellular glycomics. We describe here the application of an integrated strategy combining MS and lectin microarray methods for global glycan identification and differential glycan distribution analysis in subcellular fractions.
Materials and methods
Cells and culture
Normal bladder epithelia cell line HCV29, low grade nonmuscle invasive bladder cancer KK47 and metastatic bladder cancer cell line YTS1 cells were established by J. Masters and H. Kakizaki [24, 25] and kindly provided by Dr. S. Hakomori (The Biomembrane Institute/ Pacific Northwest Research Institute; Seattle, WA, USA) [26]. Cells were cultured in RPMI 1640 medium (HyClone; Logan, UT, USA) containing 10% fetal bovine serum (HyClone) and 1× penicillin/ streptomycin (Gibco; Carlsbad, CA, USA) at 37 °C in a 5% CO2 atmosphere.
Subcellular fractionation
Cells (~1×10⁷) were detached with trypsin and washed twice with ice-cold 1× PBS (0.01 M phosphate buffer containing 0.15 M NaCl, pH 7.4). Subcellular fractionation was performed as described previously [19, 27], with slight modification as shown schematically in Fig. 1. In brief, 500 μl of fractionation buffer (50 mM HEPES, pH 7.4, 3 mM MgCl2, 1 mM EGTA) was added to the cell pellet and sonicated (10 times, 3 sec each, 400 W) on ice (JY92-2 Sonication; Xinyi, Ningbo, China). The nuclear pellet was extracted by centrifugation at 720× g for 15 min. The supernatant was transferred into an Eppendorf tube marked as S1. The nuclear pellet was washed with 500 μl of 250 mM STMDPS buffer (250 mM sucrose, 50 mM Tris-HCL) and centrifuged at 720× g for 15 min. The supernatant was transferred into a new tube marked as S2. The nuclear pellet was resuspended in 2 M STMDPS buffer (2 M sucrose, 50 mM Tris-HCl (pH 7.4), 5 mM MgCl2, 1 mM dithiothreitol (DTT), 1 mM phenylmethanesulfonyl fluoride (PMSF), 25 mg/ml spermine, 25 mg/ml spermidine), sonicated briefly on ice, and centrifuged at 80,000× g for 35 min. The pellet was resuspended in 500 μl NE buffer (20 mM HEPES (pH 7.9), 1.5 mM MgCl2, 0.5 M NaCl, 0.2 mM EDTA, 20% glycerol) and centrifuged at 9000× g for 30 min. The supernatant, consisting mainly of nuclear membrane protein, was marked as SNuc'. The pellet was resuspended in NET buffer (20 mM HEPES (pH 7.9), 1.5 mM MgCl2, 0.5 M NaCl, 0.2 mM EDTA, 20% glycerol, 1% Triton-X 100, 1 mM DTT, 1 mM PMSF) and centrifuged at 9000× g for 30 min. The supernatant, consisting mainly of nuclear matrix protein, was marked as SNuc''. SNuc' and SNuc'' were combined and marked as nuclear protein fraction (Nuc).
Experimental design for subcellular fractionation of three bladder cells, and SDS-PAGE and Western blotting analysis of four fractions. (A) Schematic flowchart for isolation of microsomal (Mic), mitochondrial (Mito), nuclear (Nuc), and cytosolic (Cyto) protein fractions from YTS1, KK47 and HCV29 cells homogenate. (B) SDS-PAGE analysis of the four subcellular fractions from YTS1, KK47 and HCV29 cells. (C) Western blotting of the four fractions from YTS1, KK47 and HCV29 cells with antibodies directed respectively to LAMP2, VDAC1, H4, and β-actin (see M&M/ "SDS-PAGE and Western blotting").
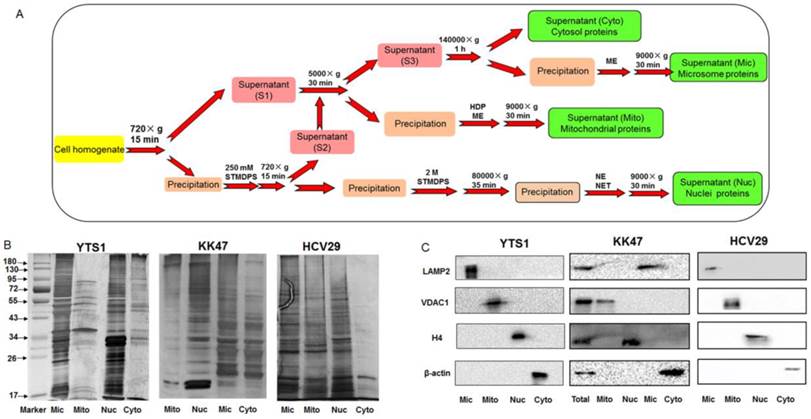
Supernatants S1 and S2 as above were mixed and centrifuged at 5000× g for 30 min. The resulting supernatant was transferred into a new tube and marked as S3. The pellet was washed with 500 μl fractionation buffer HDP (10 mM HEPES (pH 7.9), 1 mM DTT, 1 mM PMSF), and centrifuged at 9000×g for 30 min. The supernatant, consisting mainly of mitochondrial matrix protein, was marked as SMito'. The pellet was resuspended in ME buffer and centrifuged at 9000× g for 30 min. The supernatant, consisting mainly of mitochondrial membrane protein, was marked as SMito''. SMito' and SMito'' were combined and marked as mitochondrial protein fraction (Mito).
Supernatant S3 was centrifuged at 140,000× g for 1 h. The resulting supernatant was transferred into a new tube and marked as cytosolic protein fraction (Cyto). The pellet was washed with 500 μl ME buffer (20 mM Tris-HCl (pH 7.8), 0.4 M NaCl, 15% glycerol, 1 mM DTT, 1 mM PMSF, 1.5% Triton-X-100) and centrifuged at 9000× g for 30 min. The supernatant was marked as microsome fraction (Mic). Protein concentration of each of the subcellular fractions as above was determined by BCA assay (Beyotime; Haimen, China).
SDS-PAGE and Western blotting
Proteins of the four subcellular fractions (Nuc, Mito, Cyto, Mic) were detected and confirmed by SDS-PAGE and Western blotting with appropriate antibodies as described previously [28]: voltage-dependent anion channel 1 (VDAC1) for mitochondria (Abcam; Cambridge, MA, USA), histone H4 for nuclei (Santa Cruz Biotechnology; Dallas, TX, USA), lysosome-associated membrane protein 2 (LAMP2) for microsomes (Southern Biotechnology; Birmingham, AL, USA), and β-actin for cytosolic proteins (Sigma-Aldrich; St. Louis, MO, USA).
Lectin microarray analysis
Lectin microarrays including 37 commercial lectins from Vector Laboratories (Burlingame, CA, USA), Sigma-Aldrich, or Merck (Darmstadt, Germany), were analyzed as described previously [29]. Numerical data were extracted using the GenePix Pro 3.0 software program and normalized as described previously [30]. Statistical analyses were performed using the Prism 5.02 software program (GraphPad; La Jolla, CA, USA). Differences between two arbitrary datasets were evaluated by applying one-way analysis of variance (ANOVA) to each subcellular fraction, with p< 0.05 considered statistically significant.
Screening specific glycans of different organelles
Specific glycans of different organelles were screened by analysis of a subset of lectins that were detected in all four subcellular fractions and showed significant differences among them. We used a newly created subcellular fraction index (SFI), defined as the ratio of relative intensity of a glycopattern in a particular fraction to the sum of its relative intensities in all fractions, to evaluate a candidate specific lectin-binding glycopattern. SFI values were calculated by the following equation, using  as an example:

where  ,
,  ,
,  , and
, and  are relative intensities of the lectin in Mic, Mito, Nuc, and Cyto fractions.
Derivatization and separation of N-glycans
Sialylated N-linked glycans of glycoproteins were amidated by acetohydrazide and released in a size-exclusion spin ultrafiltration unit (Amicon Ultra-0.5 10 KD; Millipore; [Billerica, MA, USA]) as described previously [31]. In brief, the proteins (1.5 mg) from four subcellular fraction of the two cells were denatured with 8 M urea, then reduced and alkylated by 10 mM dithiothreitol and 10 mM iodacetamide, respectively. The proteins were redissolved with 100 µL of 1 M acetohydrazide, 20 µL of 1 M HCl, and 20 µL of 2 M EDC and incubated at room temperature for 4 h. The amidated glycans of glycoproteins were released with 2 µL PNGase F in 40 mM NH4HCO3 at 37 °C overnight. The released N-linked glycans were lyophilized and were clean-up using sepharose.The obtained N-glycans were characterized by matrix-assisted laser desorption ionization time-of-flight/ time-of-flight MS (MALDI-TOF/TOF-MS, UltrafleXtreme, Bruker Daltonics; Bremen, Germany) [30]. Lyophilized N-glycans were resuspended in 10 μL methanol/ water (1:1, v/v), then 1 μL aliquot and 20 mg/mL DHB was spotted onto an MTP AnchorChip sample target to crystallize. Mass calibration was performed using peptide calibration standards (250 calibration points; Bruker). Measurements were taken in positive-ion mode and the intense ions from MS spectra were subsequently selected and subjected to MS/MS. Representative MS spectra of N-glycans with signal-to-noise ratios > 4 were chose and annotated using the GlycoWorkbench program with the accuracy < 1.0 (www.eurocarbdb.org/applications/ms-tools). Relative intensities were analyzed and generated using the FlexAnalysis software program (Bruker Daltonics). Relative variation was calculated by dividing the relative intensity of a particular type of N-glycan by the sum of N-glycan relative intensity in one scan, as described previously [28].
Results
Characterization of subcellular fractions using conventional markers
We observed previously that sialylated glycans, terminal GalNAc and Gal, and high mannose-type N-glycans are more highly expressed in metastatic bladder cancer YTS1 and in low grade nonmuscle invasive bladder cancer KK47 than in normal bladder epithelial HCV29 [30]. Aberrant glycosylation in cells may be reflected by detailed glycan distributions in different organelles. We extracted subcellular proteins of HCV29, KK47 and YTS1 cells by differential centrifugation (Fig. 1A), followed by SDS-PAGE fractionation and coomassie brilliant blue R250 staining. Protein abundance and variety were lower in Mic and Nuc than in Mito and Cyto (Fig. 1B). Enrichment level and specificity of the method were assessed by western blotting with antibodies directed to “marker proteins” of various organelles. The protein markers LAMP2, VDAC1, H4, and β-actin were used to initially characterize composition of the fractions in the three cells. LAMP2, VDAC1, H4, and β-actin were detected exclusively in Mic, Mito, Nuc, and Cyto protein, respectively (Fig. 1C). These findings confirm that fractions of the respective organelles were extracted and identified correctly.
Protein glycopattern analysis of subcellular fractions
Distributions of organelle-specific glycans among subcellular fractions should theoretically reflect distributions of the corresponding organelles. To detect specific glycopatterns of YTS1, KK47 and HCV29 subcellular fractions, we performed lectin microarray analysis including 37 lectins, two negative controls (BSA), and one positive control (Cy3-BSA). The lectin microarray results were observed and showed in supplemental information (Fig. S1). Normalized relative signal intensities >1 were considered to be valid intensities. Organelle-specific glycans were detected based on SFI values and differences between four fractions were further clarified by ANOVA (Table 1). For YTS1, core fucosylated N-glycans (Fucα-1,6GlcNAc-Asn), characterized by binding to LCA (Lens culinaris agglutinin), were most abundant in all four subcellular fractions (Fig. 2A).
Lectin microarray analysis of differential glycopatterns in the four subcellular fractions.
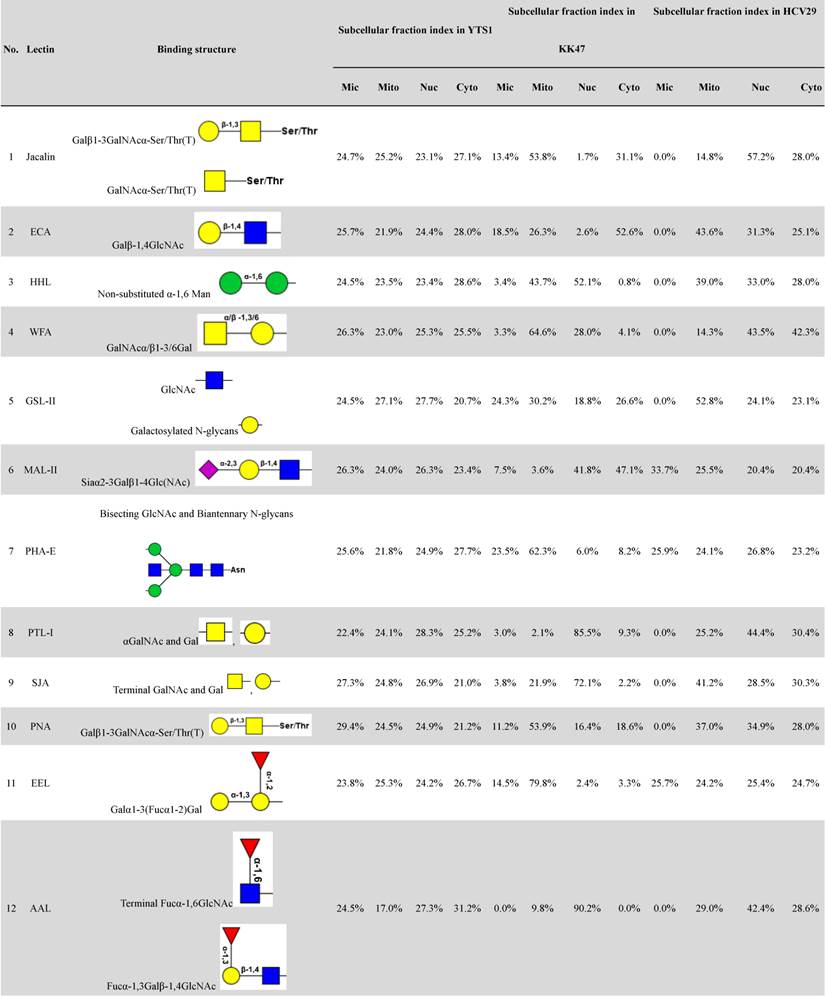
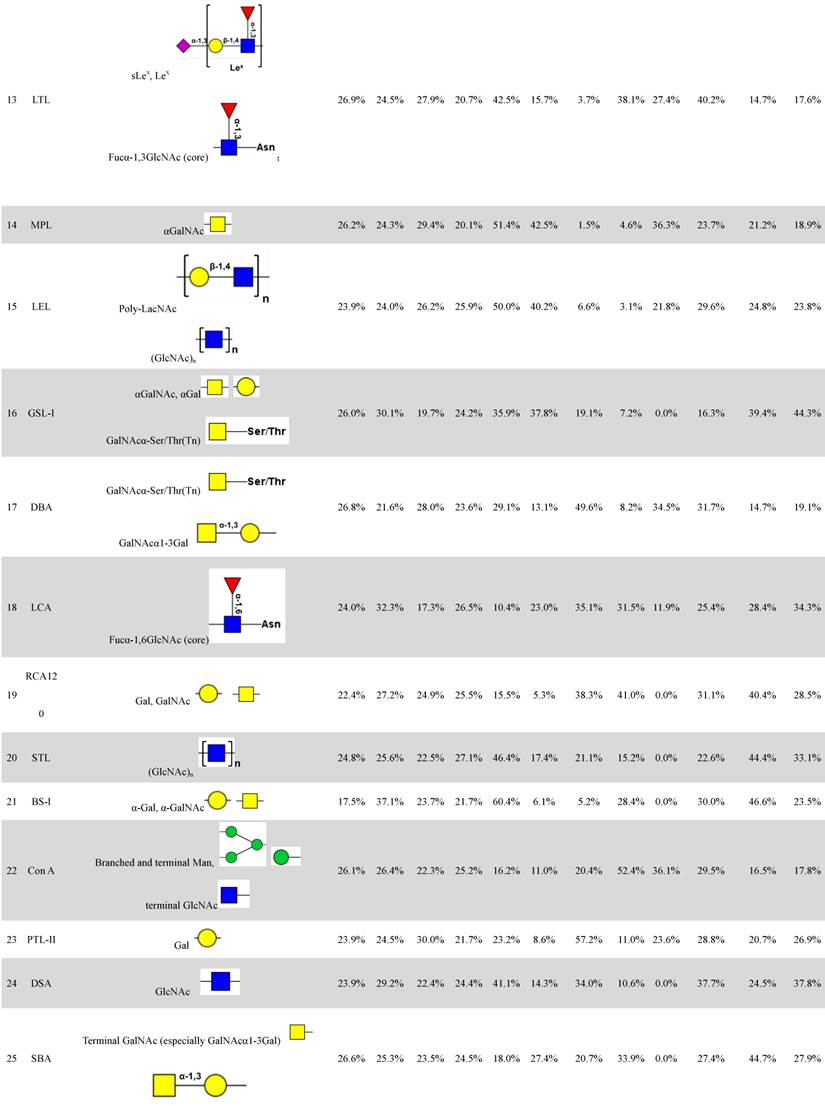
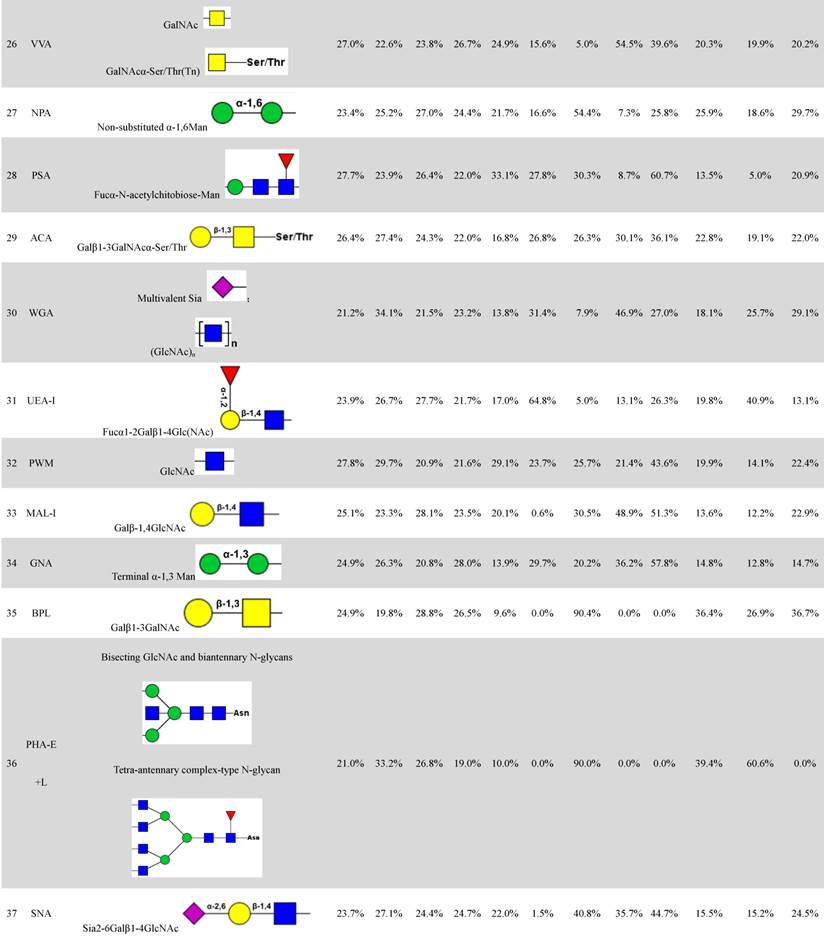
Lectin microarray analysis of glycopattern differences in subcellular fractions Mic, Mito, Nuc, and Cyto of three bladder cells. (A) Relative fluorescence intensities of 15 differentially expressed lectins in YTS1 cell. (B) Relative fluorescence intensities of 19 differentially expressed lectins in KK47 cell. (C) Relative fluorescence intensities of 15 differentially expressed lectins in HCV29 cell. *p< 0.05; **p< 0.01; ***p< 0.001.
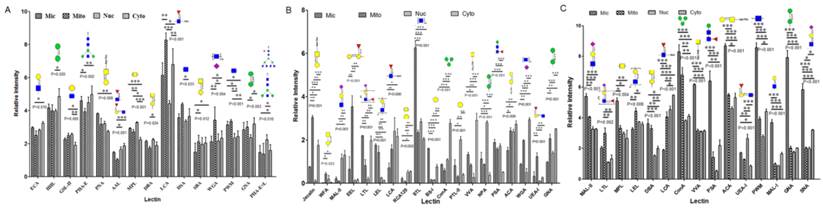
The four fractions showed significant differences in expression of fucosylated N-glycans (binding to LCA and Aleuria aurantia lectin (AAL)), αGalNAc (binding to Maclura pomifera lectin (MPL)), GlcNAc (binding to Pokeweed mitogen (PWM)), and multivalent sialic acid/ GlcNAc (binding to Triticum vulgaris agglutinin (WGA)). SFI values for LCA (SFILCA) in Mic, Mito, Nuc, and Cyto were 28.0%, 32.3%, 17.3% and 26.5%, respectively, indicating that core fucosylated N-glycans were located preferentially in Mito, Mic, and Cyto. SFI values for AAL (SFIAAL) in Mic, Mito, Nuc, and Cyto were 24.5%, 17.0%, 27.3% and 31.2%, respectively, indicating that terminal fucosylated N-glycans were located preferentially in Cyto, Nuc, and Mic. GlcNAc binding to WGA, PWM, and Datura stramonium agglutinin (DSA)) and bisecting GlcNAc N-glycans (binding to Phaseolus vulgaris agglutinin E (PHA-E)) were located preferentially in Mito and Cyto, respectively. For KK47, (GlcNAc)n glycans, binding to STL (Solanum tuberosum lectin), were most abundant in all four subcellular fractions (Fig. 2B). The four fractions showed significant differences in expression of (GlcNAc)n (binding to STL), O-glycan (binding to Jacalin, Vicia villosa lectin (VVA), fucosylated N-glycans (binding to LCA, Lotus tetragonolobus lectin (LTL), and Euonymus europaeus lectin (EEL)), and multivalent sialic acid/ GlcNAc (binding to WGA). SFI values for STL (SFISTL) in Mic, Mito, Nuc, and Cyto were 46.4%, 17.4%, 21.1% and 15.2%, indicating that multi-antenna N-glycans were located preferentially in Mic in KK47 cell. For HCV29 cell, high-mannose N-glycan, characterized by Concanavalin A (ConA) and Galanthus nivalis lectin (GNA), and O-glycan, characterized by VVA and Amaranthus caudatus lectin (ACA), were most abundant in all four subcellular fractions (Fig. 2C). SFI values for ConA SFIConA in Mic, Mito, Nuc, and Cyto were 36.1%, 29.5%, 16.5% and 17.8%, respectively. GNA SFIGNA in Mic, Mito, Nuc, and Cyto were 57.8%, 14.8%, 12.8% and 14.7% respectively, indicating that high-mannose N-glycans were located preferentially in Mic in HCV29 cell.
MS analysis of N-glycan profiles of subcellular fractions
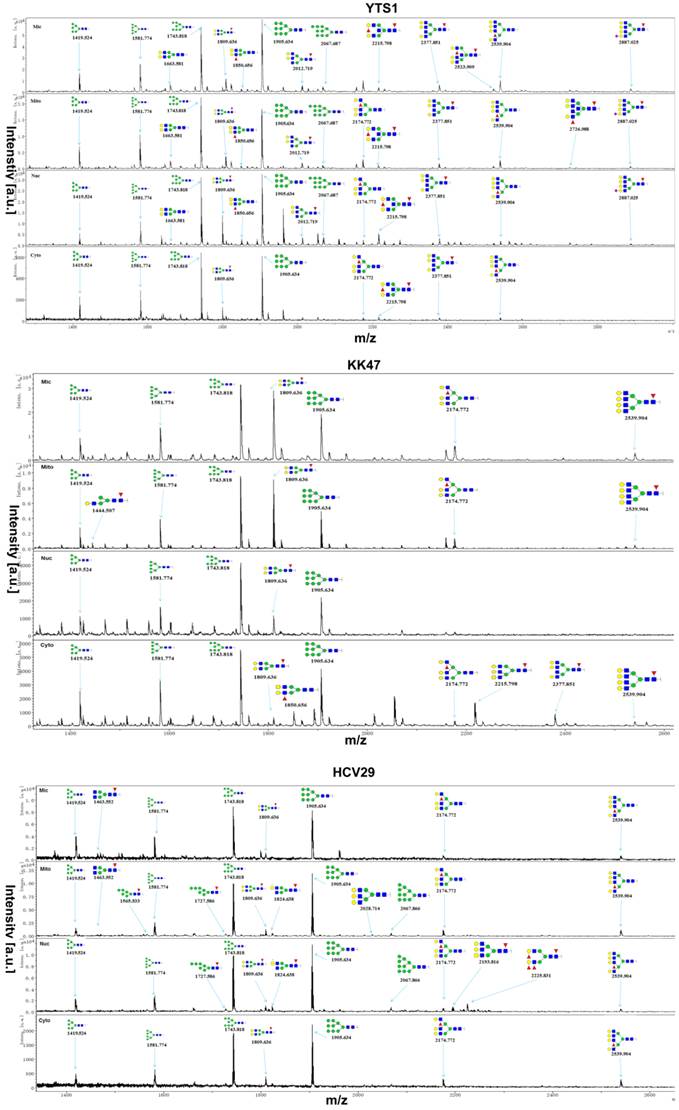
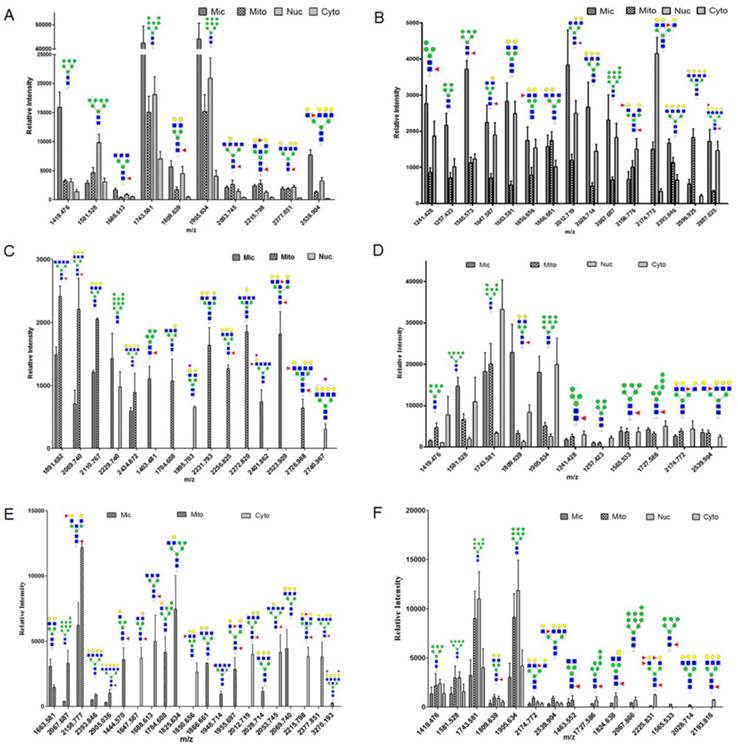
To confirm protein glycopattern analyses of subcellular fractions as above, N-glycans released from glycoproteins in the four fractions from three bladder cells were characterized by MALDI-TOF/TOF-MS. Glycans were treated with acetohydrazide in an ultrafiltration unit to obtain more information on sialylated glycans. Labeled glycans were released and detected. Representative MS spectra of N-glycans with signal-to-noise ratios >4 were annotated using the GlycoWorkbench program. A total of 40, 32 and 15 N-glycans were identified from the four fractions in YTS1, KK47 and HCV29 cells, respectively. Their MS profiles and proposed structures were shown in Fig. 3. The structures of identified glycans were annotated by the MS/MS data and partial results were shown in the supplemental information (Fig. S2). Of these 40 glycans in YTS1 cell, 10 were present in all four subcellular fractions (Fig. 4A), 15 were observed in three subcellular fractions (Fig. 4B), five were detected in two subcellular fractions (Fig. 4C), and 10 were observed in only one subcellular fraction (Fig. 4C). Of these 32 N-glycans in KK47 cells, five were present in all four subcellular fractions (Fig. 4D), six were observed in three subcellular fractions (Fig. 4D), five were detected in two subcellular fractions (Fig. 4E), and 16 were observed in only one subcellular fraction (Fig. 4E). Of these 15 N-glycans in HCV29 cell, seven were present in all four subcellular fractions, five were detected in two subcellular fractions, and three were observed in only one subcellular fraction (Fig. 4F). In conclusion, MS profiling revealed clear differences among N-glycans in the four subcellular fractions, with high resolution and sensitivity.
MALDI-TOF/TOF-MS profiling of total N-glycans in the four subcellular fractions of YTS1, KK47 and HCV29 cells. Glycan structures were analyzed using the GlycoWorkbench program. Representative spectra are shown.
N-glycan distributions in the four subcellular fractions of three bladder cells. Relative intensities and structures observed in all four fractions (A), in three fractions (B), in two fractions and in only one fraction (C) of YTS1 cell. Relative intensities and structures observed in all four and three fractions (D), in two fractions and in only one fraction (E) of KK47 cell. Relative intensities and structures observed in four subcellular fractions of HCV29 cell (F).
Differences of relative proportions of specific structures in the four subcellular fractions
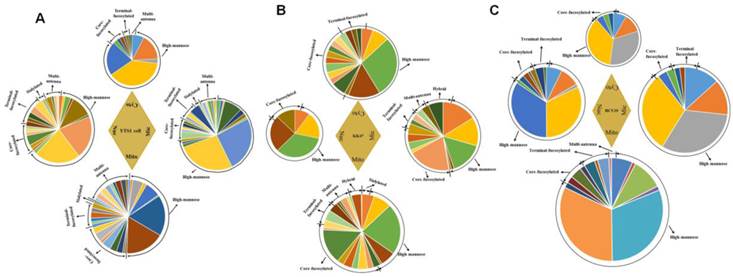
Glycan profiles of the four subcellular fractions, based on relative intensities of N-glycans and their substructures, are shown in Fig. 5. Pie charts at top, bottom, left, and right represent the N-glycan profiles of the four fractions in three cells. Areas of the circles reflect glycan amounts. To indicate relative abundances and normalize peak intensities, relative proportions of N-glycans and their substructures are shown. For N-glycans of YTS1 cell, high-mannose glycans (mass-to-charge ratio (m/z) 1419.476 ((Man)3+(Man)3(GlcNAc)2), 1581.528 ((Man)4+(Man)3(GlcNAc)2), 1743.581 ((Man)5+(Man)3(GlcNAc)2), 1905.634 ((Man)6+(Man)3(GlcNAc)2)) were more abundant in Mic and Nuc. Core-fucosylated glycans (m/z 1688.613 ((Fuc)1(GlcNAc)3+(Man)3(GlcNAc)2), 1809.639 ((Fuc)1(Gal)2(GlcNAc)2+(Man)3(GlcNAc)2), 1891.692 ((Fuc)1(GlcNAc)4+(Man)3(GlcNAc)2), 2053.745 ((Fuc)1(Gal)1(GlcNAc)4+(Man)3(GlcNAc)2), 2069.740 ((Fuc)1(Gal)3(GlcNAc)3+(Man)3(GlcNAc)2), 2215.798 ((Fuc)2(Gal)2(GlcNAc)3+(Man)3(GlcNAc)2)) were more abundant in Mic and Mito. Glycan structures with m/z 1403.481((Fuc)1(Man)2+(Man)3(GlcNAc)2)), 2401.862 ((Neu5Ac)1(Fuc)1(Gal)1(GlcNAc)4+(Man)3(GlcNAc)2)), and 2523.909 ((Fuc)2(Gal)3(GlcNAc)4+(Man)3(GlcNAc)2)) were detected only in Mic, structures with m/z 1704.608 ((Gal)1(GlcNAc)3+(Man)3(GlcNAc)2)), 2231.793 ((Gal)3(GlcNAc)4+(Man)3(GlcNAc)2)), 2256.825 ((Fuc)1(Gal)1(GalNAc)2(GlcNAc)3+(Man)3(GlcNAc)2)), 2272.820 ((Gal)2(GlcNAc)5+(Man)3(GlcNAc)2)), and 2726.988 ((Fuc)2(Gal)3(GlcNAc)5+(Man)3(GlcNAc)2)) were detected only in Mito, and structures with m/z 1995.703 ((Neu5Ac)1(Gal)1(GalNAc)1(GlcNAc)2+(Man)3(GlcNAc)2)) and 2740.967 ((Neu5Ac)1(Gal)4(GlcNAc)4+(Man)3(GlcNAc)2)) were detected only in Nuc. Such glycans that appear in only one fraction are potential candidate glycan markers for the corresponding organelles. Relative proportion of high-mannose glycans, the most abundant N-glycan, was 74.5% in Mic, 54.6% in Mito, 65.6% in Nuc, and 87.1% in Cyto. Relative proportion of fucosylated glycans was 20.3% in Mic, 31.4% in Mito, 26.5% in Nuc, and 11.7% in Cyto for YTS1 (Fig. 5A). For N-glycans of KK47 cell, high-mannose glycans (m/z 1419.476, 1581.528, 1743.581, 1905.634 were more abundant in Mic and Cyto. Fucosylated glycans (m/z 1647.587 ((Fuc)1(Gal)1(GlcNAc)2+(Man)3(GlcNAc)2), 1955.697 ((Fuc)2(Gal)2(GlcNAc)2+(Man)3(GlcNAc)2), 2174.772 ((Fuc)1(Gal)3(GlcNAc)3+(Man)3(GlcNAc)2)), 2539.904 ((Fuc)1(Gal)4(GlcNAc)4+(Man)3(GlcNAc)2)), 2905.036 ((Fuc)1(Gal)5(GlcNAc)5+(Man)3(GlcNAc)2) were more abundant in Mito and Cyto. Relative proportion of high-mannose glycans, the most abundant N-glycan, was 54.0% in Mic, 51.4% in Mito, 87.3% in Nuc, and 66.0% in Cyto for KK47 cell. For N-glycans of HCV29 cell, high-mannose glycans (m/z 1419.476, 1581.528, 1743.581, 1905.634) were more abundant in Nuc. Fucosylated glycans (m/z 1463.552 ((Fuc)1(GlcNAc)2+(Man)3(GlcNAc)2)), 1809.639, 1824.638 ((SO3)1(Fuc)1(GalNAc)1(GlcNAc)2+(Man)3(GlcNAc)2)), 2174.772, 2225.831 ((Fuc)4(Gal)2(GlcNAc)2+(Man)3(GlcNAc)2)) were more abundant in Mito and Nuc. Relative proportion of high-mannose glycans, the most abundant N-glycan, was 91.2% in Mic, 87.6% in Mito, 88.0% in Nuc, and 88.7% in Cyto. Relative proportion of fucosylated glycans was 10.8% in Mic, 16.0% in Mito, 12.0% in Nuc, and 11.3% in Cyto for HCV29 (Fig. 5B). As our previous finding that expression of sialylated glycans was much higher in YTS1 than in HCV29 cells [30], relative proportions of sialylated glycans were also higher in all four subcellular fractions of YTS1 than in HCV29 cell. Also, the N-glycan complexity of bladder cancer YTS and KK47 cells were increased.
Comprehensive N-glycan profiles of the four subcellular fractions of YTS1, KK47 and HCV29 cells. Pie charts at top, bottom, left, and right represent the N-glycan profiles of Cyto, Mito, Nuc, and Mic, respectively. Areas of the circles reflect glycan amounts. (A), YTS1 cell. (B), KK47 cell. (C), HCV29 cell.
Discussion
Complexity of cells can be increased in two ways: differentiation and compartmentalization [32]. By increasing degree of complexity, organisms broaden their repertoire of options for dealing with environmental challenges. Such complexity makes it difficult to elucidate molecular functions in cells. Prefractionation strategies to isolate or enrich a particular subset of molecules facilitate detailed analysis of proteins and glycans, and magnify the dynamic range of detected molecules in serum or tissue samples [33]. Studies of comparative distribution of glycans in cell organelles require a glycoprotein prefractionation strategy to purify/ enrich a particular subproteome and its binding glycans.
Lectin-based methods are capable of revealing glycopatterns of any type of glycoconjugate. A major advantage of lectin microarray approaches is the simultaneous quantitative analysis of N- and O-linked glycans on intact biological structures without release or derivatization of glycans [34]. MS is a rapid, sensitive technique for component analysis, and has become the central tool for glycomic analysis [35]. In the present study, an integrated strategy using lectin microarray and MS analysis led to several novel findings in regard to glycan distribution in subcellular fractions of bladder epithelial cells. (i) High mannose-type and fucosylated glycans were the most abundant in Mic, Mito, Nuc, and Cyto fractions. (ii) For bladder cancer YTS1 cell, the four fractions differed in composition of fucosylated N-glycans (binding to LCA and AAL), αGalNAc (binding to MPL), GlcNAc (binding to PWM), and multivalent sialic acid/ GlcNAc (binding to WGA). The most striking differences were observed for LCA-binding structures in Mito vs. Nuc, AAL-binding structures in Mito vs. Cyto, and MPL-binding structures in Nuc vs. Cyto. For KK47, the four fractions showed significant differences in expression of (GlcNAc)n (binding to STL), O-glycan (binding to Jacalin, VVA), fucosylated N-glycans (binding to LCA, LTL and EEL), and multivalent sialic acid/ GlcNAc (binding to WGA). For bladder HCV29 cell, the four fractions differed in composition of high-mannose N-glycan, characterized by ConA and GNA, and O-glycan, characterized by VVA and ACA. The most striking differences were observed for Con A-binding structures in Mic. (iii) Five N-glycans were detected in all four fractions, and were considered the fundamental glycan structures in the three cells. Fifteen and six N-glycans were detected in three fractions of YTS1 and KK47 cells, and five different glycans were separately detected in two fractions of the three cells; these presumably play important roles in certain organelles. Ten, sixteen and three N-glycans were detected in only one fraction of the three cells, respectively, and are considered markers of the corresponding organelles.
In conclusion, the combination of lectin microarray and MS analysis allowed detailed examination of glycomes in four subcellular fractions of three bladder cells with high resolution and sensitivity. To our knowledge, this is the first reported application of glycomics technology for global analysis of glycans in different subcellular fractions. This integrated approach will be useful for further elucidation of the functional roles of glycans and corresponding glycosylated proteins in distinct organelles.
Supplementary Material
Supplementary figures.
Acknowledgements
This study was supported by the National Science Foundation for Young Scientists of China (grants No. 81402115, 81201572), the Natural Science Foundation of Jiangsu Province, China (No. BK20140172), and the 111 Project of China (No.111-2-06). The authors are grateful to Dr. S. Anderson for English editing of the manuscript.
Competing Interests
The authors have declared that no competing interest exists.
References
1. Ruhaak LR, Miyamoto S, Lebrilla CB. Developments in the identification of glycan biomarkers for the detection of cancer. Mol Cell Proteomics. 2013;12:846-55
2. Kolhekar AS, Quon ASW, Berard CA. et al. Post-translational N-glycosylation of a truncated form of a peptide processing enzyme. J Biol Chem. 1998;273:23012-8
3. Lee HS, Qi Y, Im W. Effects of N-glycosylation on protein conformation and dynamics: Protein Data Bank analysis and molecular dynamics simulation study. Sci Rep. 2015;5:8926
4. Zhou YB, Liu F, Zhu ZD. et al. N-glycosylation is required for efficient secretion of a novel human secreted glycoprotein, hPAP21. FEBS Lett. 2004;576:401-7
5. Raman R, Raguram S, Venkataraman G. et al. Glycomics: an integrated systems approach to structure-function relationships of glycans. Nat Methods. 2005;2:817-24
6. Helenius A. Intracellular functions of N-linked glycans. Science. 2001;291:2364-9
7. Dube DH, Bertozzi CR. Glycans in cancer and inflammation — potential for therapeutics and diagnostics. Nat Rev Drug Discov. 2005;4:477-88
8. Orntoft TF, Vestergaard EM. Clinical aspects of altered glycosylation of glycoproteins in cancer. Electrophoresis. 1999;20:362-71
9. Zheng T, Peelen D, Smith LM. Lectin arrays for profiling cell surface carbohydrate expression. J Am Chem Soc. 2005;127:9982-3
10. Goldberg D, Sutton-Smith M, Paulson J. et al. Automatic annotation of matrix-assisted laser desorption/ionizationN-glycan spectra. Proteomics. 2005;5:865-75
11. Thaysen-Andersen M, Thøgersen IB, Nielsen HJ. et al. Rapid and individual-specific glycoprofiling of the low abundance N-glycosylated protein tissue inhibitor of metalloproteinases-1. Mol Cell Proteomics. 2007;6:638-47
12. Kondo A, Thaysen-Andersen M, Hjernø K. et al. Characterization of sialylated and fucosylated glycopeptides of β2-glycoprotein I by a combination of HILIC LC and MALDI MS/MS. J Sep Sci. 2010;33:891-902
13. Gatto L, Vizcaino JA, Hermjako H. et al. Organelle proteomics experimental designs and analysis. Proteomics. 2010;10:3957-69
14. Kislinger T, Cox B, Kannan A. et al. Global survey of organ and organelle protein expression in mouse_ combined proteomic and transcriptomic profiling. Cell. 2006;125:173-86
15. Larance M, Ahmad Y, Kirkwood KJ. et al. Global subcellular characterization of protein degradation using quantitative proteomics. Mol Cell Proteomics. 2013;12:638-50
16. Andreyev AY, Shen Z, Guan Z. et al. Application of proteomic marker ensembles to subcellular organelle identification. Mol Cell Proteomics. 2010;9:388-402
17. Zhao H, Ruberu K, Li H. et al. Analysis of subcellular [57Co] cobalamin distribution in SH-SY5Y neurons and brain tissue. J Neurosci Methods. 2013;217:67-74
18. Pasquali C, Fialka I, Huber LA. Subcellular fractionation, electromigration analysis and mapping of organelles. J Chromatogr B. 1999;722:89-102
19. Cox B, Emili A. Tissue subcellular fractionation and protein extraction for use in mass-spectrometry-based proteomics. Nat Protoc. 2006;1:1872-8
20. Fabre B, Lambour T, Delobel J. et al. Subcellular distribution and dynamics of active proteasome complexes unraveled by a workflow combining in vivo complex cross-linking and quantitative proteomics. Mol Cell Proteomics. 2013;12:687-99
21. Delobel J, Prudent M, Rubin O. et al. Subcellular fractionation of stored red blood cells reveals a compartment-based protein carbonylation evolution. J Proteomics. 2012;76:181-93
22. North SJ, Hitchen PG, Haslam SM. et al. Mass spectrometry in the analysis of N-linked and O-linked glycans. Curr Opin Struct Biol. 2009;19:498-506
23. Allam H, Aoki K, Benigno BB. et al. Glycomic analysis of membrane glycoproteins with bisecting glycosylation from ovarian cancer tissues reveals novel structures and functions. J Proteome Res. 2015;14:434-46
24. Masters JR, Hepburn PJ, Walker L. et al. Tissue culture model of transitional cell carcinoma: characterization of twenty-two human urothelial cell lines. Cancer Res. 1986;46:3630-6
25. Kakizaki H, Numasawa K, Suzuki K. Establishment of a new cell line (YTS-1) derived from a human urinary bladder carcinoma and its characteristics. Jpn J Urol. 1986;77:1790-1795
26. Todeschini AR, Dos Santos JN, Handa K. et al. Ganglioside GM2/GM3 complex affixed on silica nanospheres strongly inhibits cell motility through CD82/cMet-mediated pathway. Proc Natl Acad Sci U S A. 2008;105:1925-30
27. Paulo JA, Gaun A, Kadiyala V. et al. Subcellular fractionation enhances proteome coverage of pancreatic duct cells. Biochim Biophys Acta. 2013;1834:791-7
28. Tan Z, Lu W, Li X. et al. Altered N-Glycan expression profile in epithelial-to-mesenchymal transition of NMuMG cells revealed by an integrated strategy using mass spectrometry and glycogene and lectin microarray analysis. J Proteome Res. 2014;13:2783-95
29. Yu H, Zhu M, Qin Y. et al. Analysis of glycan-related genes expression and glycan profiles in mice with liver fibrosis. J Proteome Res. 2012;11:5277-85
30. Yang G, Tan Z, Lu W. et al. Quantitative glycome analysis of N-glycan patterns in bladder cancer vs normal bladder cells using an integrated strategy. J Proteome Res. 2015;14:639-53
31. Yang G, Ma T, Li Z. Enrichment and characterization of total N-linked glycans from glycoproteins by ultrafiltration units and mass spectrometry. Sheng Wu Hua Xue Yu Sheng Wu Wu Li Jin Zhan. 2014;41:403-8
32. von Hagen J, Michelsen U. Cellular fractionation-mammalian cells. Methods Enzymol. 2013;533:25-30
33. Murray CI, Barrett M, Van Eyk JE. Assessment of proteoExtract subcellular fractionation kit reveals limited and incomplete enrichment of nuclear subproteome from frozen liver and heart tissue. Proteomics. 2009;9:3934-8
34. Fry SA, Afrough B, Lomax-Browne HJ. et al. Lectin microarray profiling of metastatic breast cancers. Glycobiology. 2011;21:1060-70
35. An HJ, Kronewitter SR, de Leoz MLA. et al. Glycomics and disease markers. Curr Opin Chem Bio. 2009;13:601-7
Author contact
![]() Corresponding author: Dr. Feng Guan, The Key Laboratory of Carbohydrate Chemistry & Biotechnology, Ministry of Education, School of Biotechnology, Jiangnan University, 1800 Lihu Avenue, Wuxi, Jiangsu 214122, China. Tel: 86-510-85918126; Fax: 86-510-85918126; E-mail: fengguanedu.cn.
Corresponding author: Dr. Feng Guan, The Key Laboratory of Carbohydrate Chemistry & Biotechnology, Ministry of Education, School of Biotechnology, Jiangnan University, 1800 Lihu Avenue, Wuxi, Jiangsu 214122, China. Tel: 86-510-85918126; Fax: 86-510-85918126; E-mail: fengguanedu.cn.