Impact Factor ISSN: 1449-2288
- Issue 12; 2026
- Issue 11; 2026
- Issue 10; 2026
- Issue 9; 2026
- Issue 8; 2026
- Volume 22; 2026
- Past Issues
- Advance Articles
- Editorial Board
- Cover Images
- Index & Coverage
- Cover Suggestion
- Special Issues
Introduction
Materials and methods
Results and discussion
Conclusion
Supplementary Material
References

 Global reach, higher impact
Int J Biol Sci 2016; 12(10):1168-1180. doi:10.7150/ijbs.15189 This issue Cite
Research Paper
A Metabolomic Approach (1H HRMAS NMR Spectroscopy) Supported by Histology to Study Early Post-transplantation Responses in Islet-transplanted Livers
Kevin Vivot1, Malika A. Benahmed2,3,4, Elodie Seyfritz1, William Bietiger1, Karim Elbayed2, Elisa Ruhland2,4, Allan Langlois1, Elisa Maillard1, Michel Pinget1,5, Nathalie Jeandidier1,5, Jean-Pierre Gies6, Izzie-Jacques Namer2,3,4, Séverine Sigrist1 ![]() , Nathalie Reix2,4,7
, Nathalie Reix2,4,7
1. UMR DIATHEC, EA 7294, Centre Européen d'Etude du Diabète, Université de Strasbourg, Fédération de Médecine Translationnelle de Strasbourg (FMTS), Bld René Leriche, 67200 Strasbourg, France
2. ICube UMR 7357, Université de Strasbourg, CNRS, IMIS, 4 rue Kirschleger, 67085 Strasbourg, France
3. Service de Biophysique et Médecine Nucléaire, Hôpitaux Universitaires de Strasbourg, 1 avenue Molière, 67100 Strasbourg, France
4. Fédération de Médecine Translationnelle de Strasbourg (FMTS), Faculté de médecine, Strasbourg, France
5. Service d'Endocrinologie - Diabète et Maladies métaboliques, Hôpitaux Universitaires de Strasbourg, 1 place de l'Hôpital, 67091 Strasbourg, France
6. UMR 7034 CNRS, Faculté de Pharmacie, Université de Strasbourg, 67 401 Illkirch, France
7. Laboratoire de biochimie et biologie moléculaire, Hôpitaux Universitaires de Strasbourg, 1 place de l'Hôpital, 67091 Strasbourg, France.
Received 2016-2-3; Accepted 2016-6-28; Published 2016-9-14
Abstract

Intrahepatic transplantation of islets requires a lot of islets because more than 50% of the graft is lost during the 24 hours following transplantation. We analyzed, in a rat model, early post-transplantation inflammation using systemic inflammatory markers, or directly in islet-transplanted livers by immunohistochemistry. 1H HRMAS NMR was employed to investigate metabolic responses associated with the transplantation. Inflammatory markers (Interleukin-6, α2-macroglobulin) are not suitable to follow islet reactions as they are not islet specific. To study islet specific inflammatory events, immunohistochemistry was performed on sections of islet transplanted livers for thrombin (indicator of the instant blood-mediated inflammatory reaction (IBMIR)) and granulocytes and macrophages. We observed a specific correlation between IBMIR and granulocyte and macrophage infiltration after 12 h. In parallel, we identified a metabolic response associated with transplantation: after 12 h, glucose, alanine, aspartate, glutamate and glutathione were significantly increased. An increase of glucose is a marker of tissue degradation, and could be explained by immune cell infiltration. Alanine, aspartate and glutamate are inter-connected in a common metabolic pathway known to be activated during hypoxia. An increase of glutathione revealed the presence of antioxidant protection. In this study, IBMIR visualization combined with 1H HRMAS NMR facilitated the characterization of cellular and molecular pathways recruited following islet transplantation.
Keywords: 1H NMR, metabolomics, histology, islet transplantation, liver.
Introduction
Intrahepatic transplantation of pancreatic islets [1, 2, 3] is considered as a promising treatment for patients with type 1 diabetes mellitus who have life-threatening hypoglycaemic episodes. It allows for the replacement of β-cells by a minimally invasive method, which consists of a portal vein injection of islets performed under local anaesthetic. Since the Edmonton protocol in 20002, 44% of transplanted individuals require no exogenous insulin three years post-transplantation to maintain euglycaemia [3]. However, in current practices, at least two donor pancreata per recipient are required. Yet, in a normal pancreas, it is estimated that only 10 to 20% of islets appear to be necessary to maintain euglycaemia [4]. The requirement of so much islet tissue for transplantation is due to the loss of more than 50% of the graft during the first hours following surgery [5]. Indeed, rapidly after islet infusion, islets suffer from an inflammatory reaction, the instant blood-mediated inflammatory reaction (IBMIR) [6,7], combined with hypoxia as vascular connections of islets are broken [4, 8, 9]. Developing approaches to study the phenomena occurring after transplantation will be essential to better characterize the mechanisms involved and to propose therapeutic solutions limiting the premature loss of islets.
Metabolomics with high-resolution magic angle spinning nuclear magnetic resonance (HRMAS NMR) spectroscopy is an approach that produces highly resolved spectra used to identify and quantify multiple metabolites directly on small pieces of untreated intact tissues (< 20 mg) [10]. Providing a more realistic insight into metabolic profiles, this original technique has been successfully applied to address a variety of questions related to organ transplantation. Indeed, metabolomics is a useful tool to assess the quality of transplants from biopsy samples at the donor stage [11], to improve the preservation and storage of the graft before transplantation [12], and to monitor organ function after transplantation by following metabolic perturbations in biofluids such as blood and urine [13]. The literature presents some examples of metabolomic applications mainly with NMR in the specific field of islet transplantation, from the preservation of the donor pancreas to the detection of islet rejection. Scott et al. [14] investigated the efficacy of donor pancreas preservation protocols before islet isolation by monitoring the amount of ATP, an indicator of organs oxygenation, using 31P NMR spectroscopy. Furthermore, NMR has been used for the assessment of the quality of isolated islets before transplantation [15]. Indeed, the stress induced by the isolation procedure causes irreversible damage on islets and therefore compromises the success of the transplantation. It appeared that both lactate and the lactate/alanine ratio are good markers of islet quality and oxygenation status, as they increase during hypoxia [15], and that phosphocholine and mobile lipids are markers of apoptosis [15]. According to Hesse et al., the phosphate diester/phosphate monoester ratio is decreased in damaged and necrotic islets, and therefore is an indicator of islet viability prior to transplantation [16]. In order to detect islet graft rejection, metabolomics was used to evaluate the role of nitric oxide (NO) metabolites as markers of the early phase of islet rejection after transplantation [17]. Together, these studies support the idea that metabolomics is a useful tool to assess and optimize all steps of islet transplantation.
With regards to the understanding of early post-transplantation responses in islet-transplanted livers, the studies reported to date are mostly based on immunohistochemistry, molecular analysis, proteomics, microscopy or blood level determination of analytes [6, 18, 19]. These analytical methods focus on transcriptomics and proteomics but to our knowledge, metabolomics has not been applied to study events occurring during the few hours following islet infusion in liver. However, the complementarity of all these -omics [20] could offer a large view of complex processes occurring after islet transplantation. As HRMAS NMR can rapidly (in ~ 20 min) provide a metabolic profile that is potentially as informative as results obtained with more time-consuming techniques, we applied this tool to hepatic tissue transplanted with islets to obtain profiles of islet metabolism during the first 24 hours after transplantation. In parallel, to have an overview of phenomena associated with metabolic events, we investigated cellular events by immunohistochemistry, in particular, the kinetics of inflammatory cell recruitment in islet-transplanted livers which has not been previously reported. We also quantified systemic molecules to highlight potential biomarkers of acute inflammation that are specific to islets and directly accessible in the blood.
Materials and methods
Animals and study design
Animals were treated in accordance with the European Union guide for the care and the use of animals in research (commission June 18th 2007, 2007/526/CE). The protocol was approved by the Institutional Animal Care and Use Committee CREMEAS (n°AL/06/35/12/12).
The study was conducted using inbred rats to exclude rejection reactions and to focus on early islet destruction in the immediate post-transplantation period. Inbred male Lewis rats weighing 225 ± 25 g were purchased from Depré Breeding (Elevage Depré, St Doulchar, France). Animals were housed in a controlled environment (temperature, humidity, and a 12 h light/12 h dark cycle) and were fed with a standard laboratory rodent diet in pellet form (Safe, Augy, France). Water and food were available ad libitum.
A total of 116 rats were divided into 4 experimental groups and an islet donor group (n = 34). The first experimental group was composed of 7 non-diabetic rats (ND). Diabetes was induced in 75 rats by intraperitoneal injection of streptozotocin (Sigma-Aldrich, St. Louis, MO) at 75 mg/kg freshly dissolved in citrate buffer (0.1 M, pH 4.5). After 2 days, blood glucose levels were determined with a glucometer (Accu-Chek Go, Roche Diagnostics, Melan, France) by monitoring the blood taken from the tail vein. Animals were considered diabetic at minimal blood glucose levels of 3 g/L on two consecutive readings. As hyperglycaemia induces an inflammatory process [21], and islet cells are extremely sensitive to the toxic effects of the inflammatory mediators, insulin therapy was established in these diabetic rats in order to limit glucotoxicity on transplanted islets. These rats were treated once a day with 4 IU of insulin (Umuline® NPH, Lilly, Fegersheim, France). After 1 week of diabetes under insulin therapy, these rats were divided into 3 groups: 1) 7 rats without any other treatment than insulin therapy (D), 2) rats transplanted with beads (bead group, n = 34), and 3) rats transplanted with islets of Langerhans (islet group, n = 34). The protocols for bead and islet transplantation are described below (see § 2.2 and 2.3).
Rats were sacrificed under isoflurane anesthesia by exsanguination; the blood was collected from the portal vein in heparinized tubes. For bead and islet groups, the sacrifice occurred just after transplantation (time 0) and 2, 4, 8, 12 and 24 h later (n = 5 or 6 rats per group). Caudate lobes of livers were removed. For the rats sacrificed at time 0, the blood and caudate lobes were removed just after suture and reopening of the abdomen while under anesthesia. Caudate lobes of livers were divided in 2 parts: 1) one was immersed in embedding medium (Tissue-Tek, OCT compound, Miles, Elkhart, IN) and snap frozen in liquid nitrogen and stored at - 80°C until cryostat sectioning and immunohistochemical staining (protocol § 2.5), 2) the other part was frozen immediately in the operating room (in less than 5 min to obtain relevant metabolic informations) and stored at - 80°C until NMR analysis (protocol § 2.6),
Islet isolation, purification and culture
Islets were isolated from pancreata of the islet donor rats using collagenase digestion and purification as previously described [22]. Islets were maintained in culture during 24 h before transplantation at 37°C in an atmosphere of 5% CO2 in M199 medium with 10% fetal calf serum (FCS, Lonza) supplemented with 1% antibacterial-antimycotic solution (Sigma-Aldrich). This culture step allows to remove the nonviable islets and to decrease tissue factor expression that can lead to nonspecific inflammation [23].
Intraportal islet or bead transplantation
Seven days after diabetes induction, diabetic animal recipients from the islet and bead groups received an islet isograft or inert, non-degradable, islet-sized dextran beads (mean diameter of 150 µm, the mean size of an islet, Sigma-Aldrich), respectively. Beads were used as control.
First, rats were anaesthetized with inhaled isoflurane (CSP, Cournon d'Auvergne, France). The peritoneal cavity was accessed through a midline incision. The liver and the portal vein were visualized. Veins of the right and left lobes were clamped with microvascular clamps, directing all the portal blood into the caudate lobes. Five hundred islet equivalents or 500 beads resuspended in 1 mL of CMRL1066 medium (Sigma-Aldrich) were infused into the portal vein to embolize into caudate lobes of the liver. Clamps were removed and manual compression of the injection site following the removal of the needle was performed to minimize the risk of bleeding. Rats were then stitched and placed under a heating lamp until they awakened.
Serum analyses
Concentrations of Interleukin-6 (IL-6), α2-macroglobulin and C-peptide in the plasma of blood samples collected from the portal vein were determined by ELISA assays (R&D systems, Minneapolis, MN; GenWay, Euromedex, France; Mercodia, Uppsala, Sweden; respectively).
Immunohistochemistry
Seven-micrometer-thick cryostat sections of embedded liver samples were mounted on SuperFrost Plus slides (Labonord, Templemars, France) and fixed in acetone at - 20°C for 3 minutes. Prior to incubation with primary antibodies, slides were preincubated with a blocking solution containing 5% normal goat serum and 0.5% Triton-X100 in PBS.
For insulin and thrombin, macrophage and granulocyte staining, sections were incubated over-night in a humidified chamber at 4°C with an anti-insulin antiserum from rabbit or mouse depending on the nature of other labeling antibodies (Ozyme, Saint-Quentin-en-Yvelines, France, diluted 1:100 in blocking solution) and with a rabbit anti-thrombin antiserum (Abcam, Paris, France, diluted 1:200 in blocking solution), or with a mouse anti-macrophages (ED1) antiserum (Abcam, Paris, France, diluted 1:100 in blocking solution), or with a mouse anti-granulocytes (HIS48) antiserum (AbDserotec, Colmar, France, diluted 1:20 in blocking solution). After washing in PBS for 10 min, sections were incubated with secondary antibodies: a goat anti-rabbit or anti-mouse IgG conjugated to Cy3 for insulin staining (Molecular Probes, Thermo Fisher Scientific, USA, diluted 1:1000 in blocking solution) and either a goat anti-rabbit IgG conjugated to Alexa 488 (Molecular Probes, diluted 1:200 in blocking solution) or a goat anti-mouse IgG conjugated to Alexa 488 (Molecular Probes, Thermo Fisher Scientific, USA, diluted 1:200 in blocking solution). After a last wash in PBS, sections were mounted in an aqueous mounting medium (Fluorsave, Merck-Millipore, Molsheim, France).
1H and 13C HRMAS NMR spectroscopic analyses
NMR experiments on the liver samples of each 4 groups (D, ND and the islet and bead groups) were carried out on a Bruker Avance III 500 spectrometer (Bruker, Karlsruhe, Germany) operating at a proton frequency of 500 MHz.
Each liver sample studied by HRMAS NMR was from the lower half of the caudate process of the caudate lobe. A biopsy of 15 to 20 mg of tissue was prepared at - 20°C as previously described [24].
For all samples, a one-dimensional proton spectrum using a one-pulse experiment followed by a Carr-Purcell-Meiboom-Gill (CPMG) pulse sequence with water presaturation were acquired as previously reported [24]. The CPMG sequence is adequate to attenuate macromolecular metabolites and other substances with short T2 such as proteins and lipids and flatten the baseline [25]. The inter-pulse delay between the 180° pulses of the CPMG pulse train was synchronized with the sample rotation and set to 285 µs in order to eliminate signal losses due to B1 inhomogeneities. The number of loops was set to 328, giving the CPMG pulse train a total length of 93 ms. For each spectrum, 128 free induction decays were collected into 32 K data points using a spectral width of 14.2 ppm, a relaxation delay of 2 s, and an acquisition time of 2.3 s. The acquisition of one spectrum lasted 10 min. Resulting data were Fourier transformed after multiplying by an exponential weighting function corresponding to a line broadening of 0.3 Hz. All the spectra were referenced by setting the CH3 signal of lactate to δ 1.33 ppm.
In order to confirm metabolite identification, two-dimensional heteronuclear spectra were also acquired on 4 samples according to Benahmed et al [24]. 1H-13C phase-sensitive detection (echo/antiecho) Heteronuclear Single Quantum Correlation (HSQC) was performed using a 73 ms acquisition time with Globally optimised Alternating phase Rectangular Pulse 13C decoupling and a 1.5 s relaxation delay. A total of 116 transients were averaged for each of the 256 t1 increments, corresponding to a total acquisition time of 15 h. Such a long duration leads to tissue degradation and consequently to an increase in the concentration of some metabolites. For this reason, 2D experiments were only used for resonance assignment.
All NMR spectra were phased and baseline-corrected using an automatic baseline correction routine employing a simple linear correction to obtain a baseline level that is exactly at 0 using Bruker Biospin TOPSPIN software (version 2.1). 1H NMR spectra were assigned using previously reported literature values [24, 26] and data from the Human Metabolome Database (http://www.hmdb.ca/). Assigned resonances in 1D spectrum were confirmed with 2D HSQC spectra. Thirty metabolites were identified and are listed in Table 1.
Resonance assignments of metabolites in HRMAS NMR spectra of rat liver tissue. Metabolites in bold characters were quantified. Asterisks indicate the center of the integration range used for quantification. Total choline was quantified with the integration range from 3.20 to 3.25 ppm. GPC: Glycerophosphocholine, TMAO: Trimethylamine-N-oxide, s: singlet, d: doublet, dd: doublet of doublet, t: triplet, m: multiplet, ppm: part per million.
| Metabolite | Group | Multiplicity | 1H chemical shift (ppm) | 13C chemical shift (ppm) | Metabolite | Group | Multiplicity | 1H chemical shift (ppm) | 13C chemical shift (ppm) | |||
|---|---|---|---|---|---|---|---|---|---|---|---|---|
| 1 | Acetate | CH3 | s | *1.92 | 25.99 | 20 | Lactate | CH3 | d | 1.33 | 22.74 | |
| 2 | Alanine | ßCH3 | d | *1.48 | 18.88 | CH | q | *4.12 | 71.21 | |||
| αCH | q | 3.78 | 53.23 | 21 | Leucine | δCH3 | t | 0.96 | 23.56 | |||
| 3 | Arginine | αCH2 | m | 1.71 | 26.95 | γCH2 | m | 1.66 | 26.78 | |||
| ßCH2 | m | 1.92 | 29.89 | ßCH2 | m | 1.71 | 42.53 | |||||
| δCH2 | t | 3.23 | 43.21 | αCH | m | 3.73 | 56.06 | |||||
| 4 | Ascorbate | C4H | d | *4.52 | 81.02 | 22 | Lysine | γCH2 | m | 1.47 | 24.3 | |
| 5 | Aspartate | ßCH2 | d | 2.71 | 39.17 | δCH2 | m | *1.71 | 29.29 | |||
| ßCH2 | d | 2.81 | 39.17 | ßCH2 | m | 1.90 | 32.69 | |||||
| αCH | dd | *3.87 | 54.93 | 23 | Myo-inositol | C5H | t | 3.24 | 76.86 | |||
| 6 | Betaine | CH3 | s | 3.26 | 56 | C1H,C3H | dd | 3.54 | 74.23 | |||
| CH2 | s | 3.64 | 65.11 | C4H,C6H | t | 3.61 | 74.27 | |||||
| 7 | Choline | N+(CH3)3 | s | 3.21 | 56.64 | C2H | t | 4.05 | 74.89 | |||
| ßCH2 | dd | 3.52 | 70.00 | 24 | Phosphocholine | N+(CH3)3 | s | 3.23 | 56.33 | |||
| CH2(OH) | ddd | 4.06 | 58.38 | NCH2 | m | 3.60 | 69.05 | |||||
| 8 | Creatine | CH3 | s | *3.03 | 39.52 | CH2 | m | 4.17 | 60.9 | |||
| CH2 | s | 3.93 | 61.06 | 25 | Proline | ßCH2 | m | 2.34 | 31.76 | |||
| 9 | Fatty Acids | CH3 | t | *0.9 | 19.93 | δCH2 | dt | 3.42 | 48.69 | |||
| (CH2)n | m | 1.29 | 34.61 | αCH | dd | 4.1 | 64.39 | |||||
| CH3-CH2-CH2 | m | 1,31 | 25,36 | 26 | Scyllo-inositol | CH | s | *3.36 | 76.32 | |||
| CH=CH-CH2-CH2 | m | 2.05 | 24.84 | 27 | Serine | αCH | dd | 3.83 | 59.12 | |||
| CH=CH-CH2- | m | 2.77 | 28.3 | ßCH2 | m | 3.97 | 62.56 | |||||
| CH=CH-CH2- | m | 5.33 | 132.2 | 28 | Taurine | CH2(NH3) | t | 3.27 | 50.3 | |||
| CH=CH- | m | 5.33 | 130.72 | CH2(SO3) | t | 3.41 | 38.77 | |||||
| CH2-CH2-C=O | m | 1.58 | 27.49 | 29 | TMAO | N(CH3)3 | s | 3.27 | 62.19 | |||
| 10 | α-glucose | C4H | m | 3.40 | 72.23 | 30 | Valine | γCH3 | d | 0.99 | 19.38 | |
| CH | m | 3.84 | 63.2 | γ'CH3 | d | *1.04 | 20.76 | |||||
| C1H | d | 5.23 | 94.72 | ßCH | m | 2.3 | 31.8 | |||||
| 11 | ß-glucose | C3H,C5H | m | 3.46 | 78.59 | |||||||
| C6H | dd | 3.89 | 63.42 | |||||||||
| C1H | d | *4.65 | 98.7 | |||||||||
| 12 | Glutamate | ßCH2 | m | 2.05 | 29.89 | |||||||
| γCH2 | m | *2.34 | 36.04 | |||||||||
| αCH | dd | 3.77 | 57 | |||||||||
| 13 | Glutamine | ßCH2 | m | 2.14 | 29.03 | |||||||
| γCH2 | m | *2.44 | 33.53 | |||||||||
| αCH | t | 3.77 | 57.01 | |||||||||
| 14 | Glutathione | CH2(CONH) | m | 2.55 | 33.97 | |||||||
| CH(NH2) | m | 3.78 | 45.99 | |||||||||
| CH(NH2) | q | 4.57 | 58.6 | |||||||||
| CH2(SH) | dd | *2.96 | 28.36 | |||||||||
| 15 | Glycerol | 1,3CH2(OH) | m | 3.56 | 65.07 | |||||||
| 1,3CH2(OH) | m | 3.66 | 65.11 | |||||||||
| 16 | Glycine | αCH2 | s | 3.56 | 44.12 | |||||||
| 17 | Glycogen | C2H | dd | 3.43 | 72.16 | |||||||
| C4H | q | 3.58 | 74.38 | |||||||||
| C5H | q | 3.77 | 63.27 | |||||||||
| C6H | d | 3.85 | 63.27 | |||||||||
| C1H(α1→4) | d | *5.43 | 102.26 | |||||||||
| 18 | GPC | N(CH3)3 | s | 3.23 | 56.61 | |||||||
| γCH2 | m | 3.61 | 63.36 | |||||||||
| ßCH2 | m | 3.90 | 73.31 | |||||||||
| αCH2(P) | m | 4.32 | 62.07 | |||||||||
| 19 | Isoleucine | δCH3 | t | 0.94 | 14.05 | |||||||
| γCH3 | d | 1.00 | 17.04 | |||||||||
| γCH2 | m | 1.51 | 27.19 | |||||||||
| αCH | d | 3.65 | 60.18 |
Metabolites were quantified as previously described [10] by using the 1D CPMG spectra except for fatty acid quantitation for which the one-pulse sequence was employed. MATLAB software version 7.0 (Mathworks, Natick, MA) was used. Spectra were normalized according to each sample weight. The spectral region between 4.7 ppm and 0.5 ppm of 1D spectra was automatically bucketed into regions of 0.01 ppm width (AMIX 3.8 software (Bruker GmbH, Rheinstetten, Germany)). Calibration was done with the signal intensity of a reference solution containing a known amount of lactate, acquired under exactly the same conditions used to measure the biopsy samples. Peak area integration was employed to calculate the concentration. Peak integration was compared to the one obtained with the lactate reference and was corrected according to the number of protons. Quantification results were expressed as nmol/mg of tissue. Metabolites were quantified when the integration peaks were well resolved, when the signal could be distinguished from background noise, and when there was no signal overlap. The signal from ethanol, related to an external contamination from surgery materials, was removed from the quantitation at the stage of bucketing by excluding the corresponding spectral region (1.23 - 1.14 ppm) from the bucketing process.
Statistical analyses
Data were analyzed with GraphPad Prism 4.03 (GraphPad Software, San Diego, CA). Results are expressed as mean ± SEM.
Differences between groups (ND vs D, D vs bead group at time 0, D vs islet group at time 0, and bead vs islet groups at time 0) were assessed by a Mann-Whitney test.
ANOVA I with Newman-Keuls post-hoc test were performed to evaluate the effect of time after transplantation. Comparison of islet- and bead-transplanted groups over time was analyzed by an ANOVA II with Bonferroni post-hoc test. Differences were considered significant at p < 0.05.
The spectral region between 4.7 to 0.5 ppm of each 1D HRMAS NMR spectrum was automatically binned into buckets of 0.1 ppm using the AMIX 3.8 software (Bruker GmBH, Germany). Each bucket was integrated and normalized with respect to the total integral of the spectrum. This process generated an X data matrix imported into the SIMCA P software (Umetrics AB, Umea, Sweden) and analyzed using principal component analysis (PCA). PCA serves to evaluate the quality of the data and to detect outliers. After PCA, a partial least square discriminant analysis (PLS-DA) was carried out to build a statistical model that optimized the separation between groups after transplantation of islets or beads.
Results and discussion
Systemic inflammation during the 24 h after islet transplantation
During acute inflammation, the release of IL-6 combined with others chemokines allows the neutrophil recruitment at the site of inflammation [27]. Interestingly, the IL-6 production has been well documented after islet transplantation [28]. It is also well known that IL-6 induces the secretion of proteins of the acute inflammatory phase, which include α2-macroglobulin [29]. Furthermore, previous investigations have demonstrated that the release of α2-macroglobulin is a good marker for inflammation in the laboratory rat [30]. Hence, we examined changes in the serum levels of these two systemic inflammatory mediators (Fig. 1) in order to compare systemic inflammation in rats transplanted with beads and rats transplanted with islets of Langerhans. We found that the serum levels of IL-6 increased significantly after infusion of either beads or islets (Fig. 1.A) with a maximum after 4 h (p < 0.01 compared to time 0) and decreased to return to the baseline levels after 24 h (non-significant difference versus time 0). No difference was observed between bead and islet groups over time. The production of α2-macroglobulin was significantly increased in both bead and islet groups 8 h after surgery (Fig. 1.B) (p < 0.001 for both groups) and further increased to reach a maximum after 24 h. α2-macroglobulin levels were comparable over time between bead and islet groups.
(A) Interleukin-6 (IL-6) and (B) α2-macroglobulin (α 2-M) levels after bead or islet transplantation in diabetic rats. ANOVA I, Newman-Keuls post-hoc test: #: p < 0.05, ##: p < 0.01, ###: p < 0.001 versus time 0 for bead group, and *: p < 0.05, **: p < 0.01, ***: p < 0.001 versus time 0 for islet group. ANOVA II for comparison of groups within time: not significant.
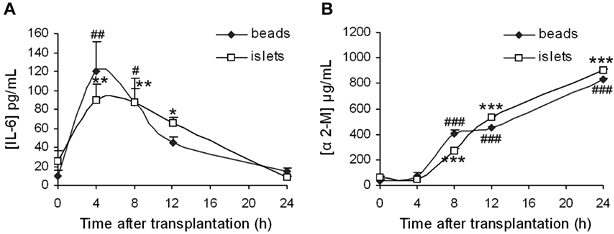
Thus, our results indicate the occurrence of an inflammatory process following transplantation. However, since there is no variation in mediator levels between bead and islet groups, it appears that the surgical procedure significantly contributes to this systemic inflammation and hence cannot be used as an indicator of IBMIR. Indeed, it has been demonstrated that the production of α2-macroglobulin can increase 25 times after surgery in rats [31].
C-peptide evolution after islet transplantation
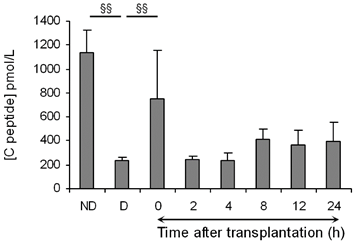
As the lysis of islets is characterized by an increase in plasma C-peptide concentration [6, 35], we analyzed the level of this islet specific marker (Fig. 2). In the islet group and at time 0 after transplantation, C-peptide concentrations were higher than in the diabetic non-transplanted control group (p < 0.01). C-peptide concentrations decreased 2 h after transplantation and then almost doubled after 8 h. C-peptide levels between 2 and 24 h were significantly higher in the islet transplanted group compared to the non-transplanted group (p < 0.05). Thus, we highlighted two periods of C-peptide release after transplantation: at time 0 and 8 h post-transplantation. The first and intense peak of C-peptide, immediately after transplantation (at time 0), indicates that injected islets are damaged probably because of the isolation procedure and the passage through the needle of injection. The second peak appearing after 8 h may have several origins: either implantation of islets or their physiological production of C-peptide, or cellular damage of islets connected to the premature loss of islet viability after transplantation.
Mean (± SEM) of plasmatic C-peptide concentrations in non-diabetic (ND) and diabetic (D) rats, and in diabetic rats after islet transplantation. Mann-Whitney tests between ND and D, and between D and time 0 post-transplantation: §§: P < 0.01. An ANOVA I was performed to evaluate the time effect after transplantation (from 2 to 24 h) on C-peptide levels and was significant (p < 0.05).
In situ characterization of inflammatory responses
To have an overview of islet specific inflammatory events, we focused this study on responses occurring in the liver, at the site of islet transplantation.
It is known that an innate inflammatory reaction, the IBMIR, is elicited when islets are exposed to blood [7]. The IBMIR has been described as a clotting reaction culminating in disruption of islet morphology and is a plausible cause for loss of tissue during the early post-transplant period. Characterization of IBMIR indicates that thrombin is the driving force in the reaction [36]. Thrombin acts as a chemoattractant and promotes migration and activation of neutrophils and monocytes [37], cell types that may exert direct cytotoxic effects.
In order to establish the kinetics of IBMIR during the first 24 h after transplantation, we monitored, by immunohistochemistry, thrombin generation together with granulocyte and macrophage recruitments during the first 24 hours following transplantation in islet and bead groups.
Immunohistochemical analysis revealed that thrombin was not generated spontaneously after transplantation with beads but appeared after 4 h and gathered around beads after 12 h (Fig. 3.A). In the islet group, thrombin was produced 2 hours after transplantation, and remained detectable during the first 24 hours after islet transplantation (Fig. 3.D). As presented by another study describing IBMIR, our results confirm the coincidence of IBMIR and thrombin generation [38].
Double immunofluorescence staining of insulin (in red) and thrombin (A,D) or inflammatory cells: macrophages (B,E) or granulocytes (C,F) (in green) in sections of livers transplanted with islet-sized dextran beads (left panel) or with islets (right panel). Livers were removed immediately, 2, 4, 8, 12 and 24 hours after transplantation Magnification: x 40. In bead-transplanted livers: Thrombin was not generated spontaneously after transplantation with dextran beads (A); 24 hours after beads transplantation, we visualized that only macrophages were recruited (B) not granulocytes (C, the ring around the transplanted bead was attributed to the autofluorescence of beads as the fluorescence distribution is uniform all around the beads and as no granulocytes was visible in hepatic tissue during the kinetic). In islet-transplanted-livers: Thrombin was generated 2 h after transplantation (D); Macrophages clustered around islets 8 hours after transplantation (E); Then, a massive infiltration of macrophages and granulocytes took place 12 hours after transplantation (E,F); After 24 hours, the transplanted islets are completely infiltrated by inflammatory cells (E,F).
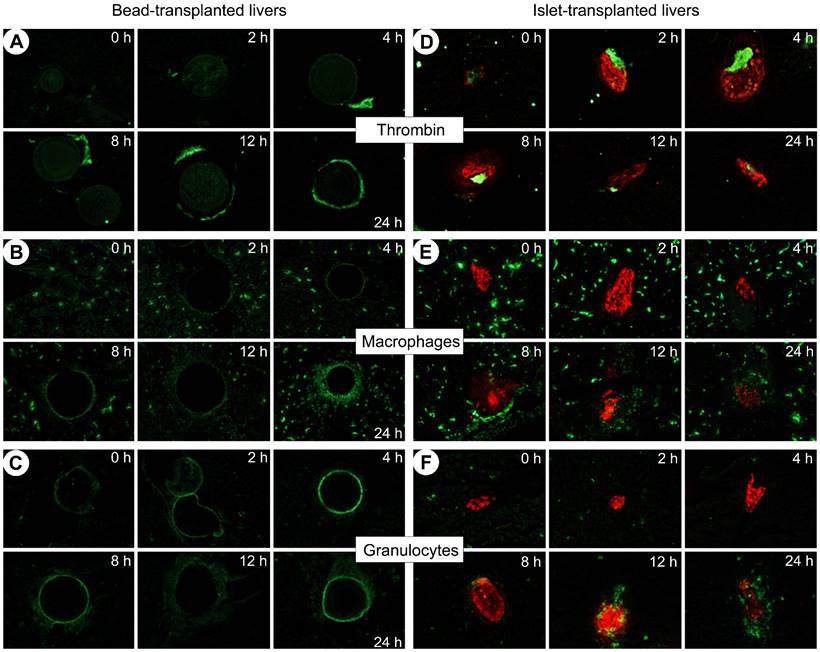
Macrophages were initially ubiquitous in the liver in both bead and islet groups (B and E respectively). Macrophages were recruited at the surface of the beads 24 h after transplantation (B). During the first 4 hours after transplantation, macrophages were still far from the transplanted islets (E) but after 8 hours they began clustering around the islets and infiltrated them from the twelfth hour. Twenty-four hours after transplantation, the transplanted islets were completely infiltrated.
Regarding granulocytes, Figure 3.C shows the autofluorescence of beads and reveals that granulocytes were not recruited over 24 h (C). In the islet group, very few cells were detectable in the liver of animals immediately after transplantation. In a manner comparable to the infiltration of macrophages, granulocytes appeared 8 hours after islet transplantation and heavily invaded the graft after 12 hours. Neutrophils are the leaders of the family of granulocytes and are the first line of defense in the innate immunity [39]. Neutrophils contribute significantly to the activation and recruitment of macrophages at the site of acute inflammation. Upon activation, they generate various chemotactic factors which attract monocytes and macrophages [40]. Due to their common origin, neutrophils and macrophages share several features such as phagocytic ability [41].
Our observations contrast with studies led by Moberg et al. [42] who observed that neutrophils are the predominant cell type infiltrating the islets. Based on their observations, the cells infiltrate the islets after 15 minutes, and infiltration peaks after 2 hours. Differences can be explained by the experimental procedure: the authors used an in vitro tubing loop model in which islets were injected in loops with fresh blood whereas we worked with an animal model of intrahepatic islet transplantation. Our in vivo model takes into account the influence of the hepatic microenvironment on islet engraftment. This is important as the liver has a very low oxygen tension [43] and possesses cellular components which serve as mediators of non-specific inflammatory events. In particular, resident macrophages (Kupffer cells) and vascular endothelial cells play an important role as demonstrated by the pretreatment of animal liver with antimacrophages agents which inhibits inflammatory responses and significantly prolongs the survival of islets after transplantation [19]. To our knowledge, this is the first histological analysis of IBMIR integrating the diabetic context with insulin therapy and the liver environment during transplantation.
Since no infiltration of macrophages and granulocytes was observed in livers of bead groups, we confirmed that the beads are inert and constitute a good control of surgery, microembolization and limited inflammatory reactions allowing for the assessment of the impact of transplanted islets on the early post-transplantation responses.
Metabolic profiles of post-transplantation events
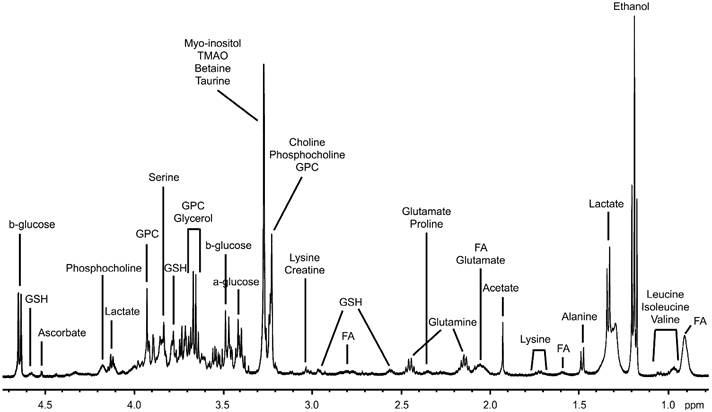
HRMAS NMR was used to characterize the metabolic changes in livers transplanted with islets during the first 24 hours post-transplantation. A representative 1H HRMAS NMR metabolic profile of liver is shown in Figure 4 (further spectra are presented in Fig. S1 in the Supporting Information). All spectra showed a good resolution with narrow line-widths similarly to those observed in Figure 4. Sixteen metabolites were quantified as shown in Figure 5.
Representative 1D 1H HRMAS NMR CPMG spectrum of liver tissue from a non-diabetic rat. Ethanol is a pollution resulting from the surgical material. FA: Fatty acids, GPC: Glycerophosphocholine, GSH: Glutathione, TMAO: Trimethylamine-N-oxide.
Quantitative analysis of metabolites from CPMG spectra. Mean (± SEM) of metabolite concentrations are expressed as nmol/mg of tissue. ND: Non-diabetic rats, D: Diabetic rats, and 0 to 24: time post-transplantation (in hours). Mann-Whitney test was used to evaluate differences between non diabetic and diabetic rats, diabetic rats and rats transplanted with beads at time 0, diabetic rats and rats transplanted with islets of Langerhans at time 0, and rats transplanted with beads and islets at time 0 (§: p < 0.05; §§: p < 0.01). * symbolizes statistical differences from time 2 h in the group (bead or islet group) (ANOVA I with Newman-Keuls post-hoc test; *: p < 0.05; **: p < 0.01; ***: p < 0.001). # symbolizes the comparison of metabolite concentrations between the bead- and islet-transplanted groups at a specific time point (ANOVA II, Bonferroni post-hoc comparison of groups within time; #: p < 0.05; ##: p < 0.01).

The comparison of spectral profiles performed on both ND and D rats showed that 2 metabolites had significantly lower levels in D than in ND group: creatine and fatty acids (p < 0.05) (Fig. 5). Glucose and glycogen concentrations were not significantly different between ND and D groups (Fig. 5), which suggests no difference in glycaemia, glycogenolysis or gluconeogenesis between the 2 groups. Consequently, we deduced that, following insulin therapy, diabetes had only a minor metabolic effect on rats, and allowed us to focus on the role of the liver as recipient in the immediate hours following islet transplantation.
At time 0, the comparison of liver profiles between islet and bead groups indicated an increase in glycogen in rats transplanted with islets (p < 0.01). The literature has reported that rat islets cultured in the presence of glucose accumulate glycogen in a time- and concentration-dependent manner [44, 45]. As the culture medium used for the 24 h islet culture contained glucose, we hypothesized that this increase was probably due to an accumulation of glycogen in islets during the culture period.
Major changes in metabolite levels occurred 12 hours after islet transplantation. PLS-DA of the entire metabolomic data set confirmed the importance of the 12 h time point in the islet group with a good fitness and predictability (R²Y = 0.995 and Q² = 0.937) (Table 2, see also Fig. S2 & Fig. S3 in the supporting Information).
Summary of parameters for assessment of the quality of PLS-DA models. Pairwise PLS-DA analysis was performed to compare the metabolome of livers transplanted with islets (T) and beads (B) from 2 to 24 h after transplantation. Data highlighted the significant importance of the 12 h time point in the islet-transplanted group with a good fitness and predictability (T2 versus T12: R²Y = 0.995 and Q² = 0.937). The number of components of PLS-DA models was determined by cross-validation. The R²Y value indicates the goodness of fit, while the Q² value is a measure of the predictability of the model. The maximal theoretical value for Q² is equal to 1 for a perfect prediction. T: group transplanted with islets; B: group infused with beads.
| Comparisons | Number of components | R²Y | Q² |
|---|---|---|---|
| T2 vs T4 | 3 | 0.986 | 0.656 |
| T2 vs T8 | 3 | 0.964 | 0.552 |
| T2 vs T12 | 3 | 0.995 | 0.937 |
| T2 vs T24 | 3 | 0.997 | 0.782 |
| T2 vs B2 | 3 | 0.990 | 0.858 |
| T4 vs B4 | 3 | 0.936 | 0.715 |
| T8 vs B8 | 3 | 0.987 | 0.842 |
| T12 vs B12 | 3 | 0.979 | 0.519 |
| T24 vs B24 | 3 | 0.883 | 0.339 |
After 12 h, glucose was significantly increased in the islet group compared to the bead group (p < 0.01, Fig. 5). The variation of glucose levels is a commonly used marker to detect tissue degradation [10]. In intact tissues, macromolecules such as enzymes are bound to small polar molecules generating wide signals in NMR due to their low mobility [10]. When tissue degradation occurs, these macromolecules release their ligands, mainly glucose, which become mobile and visible in NMR [10]. Our study previously demonstrated intense infiltration of immune cells 12 h after transplantation with a loss of islet integrity. Glucose elevation was correlated with the presence of IL-6 previously described (Fig. 2.A). It has been suggested that IL-6 can contributes to the hyperglucagonemia in inflammation state which can lead to the production of glucose by liver [46]. As proposed by Ellingsgaard et al., IL-6 could be a major contributor of metabolism adaptation to supply the immune system demand [33]. However, we didn't attributed glucose increase to IL-6 as IL-6 was higher at time 4 and 8 h than at time 12 h after islet transplantation without any impact on glucose concentration. Hence, we attributed the increase in glucose levels specifically observed in the islet group to islet damage.
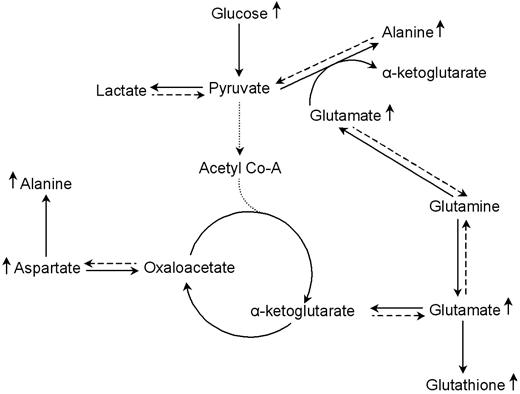
Furthermore, the analysis of metabolic changes revealed a significant increase in alanine, aspartate and glutamate in the islet group compared to the bead group 12 h post transplantation (Fig. 5). Glutamine was significantly elevated after 12 h in the islet group compared to time 2 h in the same group. These metabolites are all inter-connected as shown in Figure 6. Studies indicate that glutamate and aspartate can become preferential fuels in the setting of hypoxia as shown in myocardial ischemia and reperfusion [47]. Alanine, an anaerobic end product of glutamate and aspartate metabolism, increases in hypoxic injury [47]. Indeed, glutamate and pyruvate may undergo transamination forming α-ketoglutarate and alanine (Fig. 6) [15, 48, 49]. Thus, this reaction first reduces lactate production by shunting pyruvate to alanine in oxygen limited conditions (Fig. 6). Our results indicate that islet hypoxia can be marked by such an increase in alanine and not in lactate. Thus, glutamine metabolism via the glucose-independent TCA cycle supports cellular bioenergetics for cell survival under hypoxic conditions.
Simplified representation of the alanine-aspartate-glutamate metabolic pathways involves 12 hours after islet transplantation. In oxygen limited conditions, glutamate and aspartate become preferential fuels for cellular energy production. Glutamate produces α-ketoglutarate by transforming pyruvate into alanine; and aspartate can produce oxaloacetate, another intermediate in the TCA cycle. Thus, the alanine-aspartate-glutamate metabolism supports cellular bioenergetics for cell survival under hypoxic conditions via the glucose-independent TCA cycle.
Hypoxia of the transplanted islets is the consequence of a loss of the original islet vasculature during the process of islet isolation and to insufficient islet neovascularisation in the post-transplantation period [43]. Pancreatic insulin-producing beta-cells are known to be highly susceptible to hypoxia [50]. Accordingly, oxygen limitation is one of the main causes of islet death. Moreover, the occurrence of IBMIR with thrombotic reactions formed around implanted islets further aggravates hypoxia by increasing the oxygen diffusion distance from the circulating portal blood to the core of islets. It is known that hypoxia induces generation of oxidative stress species that have a deleterious impact on beta-cells equipped with an extremely low level of antioxidant enzymes [51]. We observed a significant increase of glutathione in the islet group compared to the bead group 12 h post-transplantation (p < 0.05) (Fig. 5). The oxidized form, glutathione disulfide (GSSG), was not present in 1H and 13C spectra of this study. The explanation might be that the oxidation process mainly produces protein-linked GSSG, which is difficult to observe with this method because the CPMG sequence suppresses the signals from macromolecules such as proteins. Consequently, an increase in GSH suggests an anti-oxidative protection in islet transplanted livers at time 12 h. Glutathione is the most important intracellular antioxidant product from glutamate, which was also increase at time 12 h. A study of Bottino et al. [19] revealed a peak of NO, which has direct toxic effects on islets, 12 hours after islet transplantation. In the same study, no release of NO was observed in animals receiving intraportal infusion of microbeads. Consequently, our data indicating the importance of time 12 h in post-transplantation events are in accordance with this study.
Changes in these 4 metabolite levels in the islet group were only seen 12 h after transplantation, and were not sustained at 24 h. IHC revealed that dramatic events occurred 12 h after transplantation. Reactions were acute and resulted in major changes in metabolite level that were detected by HRMAS NMR. However, after 24 h, islets were substantially damaged and the limited sensitivity of magnetic resonance detection provided no information concerning the specific metabolic profiles after 24 h.
Conclusion
The main goal of the present investigation was to characterize the metabolic and the inflammatory events of early post-transplantation loss of islet viability combining 1H HRMAS NMR and immunohistochemistry.
It was the first time that IBMIR was clearly described in vivo using an immunological approach. We identified that the first 24 h post-transplantation revealed thrombin generation around islets, macrophage and granulocyte recruitments followed by intense islet infiltration by these cells. These immune reactions participated in the generation of a cytotoxic environment around the islets consistent with early post-transplant inflammation (IBMIR). Cellular damages were concomitant to modifications of metabolite levels correlated to hypoxia and oxidative stress. We have demonstrated that HRMAS NMR spectroscopy was reliable to monitor metabolism of transplanted islet. We support the idea that such a technique could be useful to study the impact of treatments targeting the liver and/or islets before transplantation to improve islet engraftment.
Supplementary Material
Supplementary figures.
Competing Interests
The authors have declared that no competing interest exists.
References
1. Hirshberg B, Rother KI, Harlan DM. Islet transplantation: where do we stand now? Diabetes Metab Res Rev. 2003;19(3):175-8
2. Shapiro AM, Lakey JR, Ryan EA, Korbutt GS, Toth E, Warnock GL. et al. Islet transplantation in seven patients with type 1 diabetes mellitus using a glucocorticoid-free immunosuppressive regimen. N. Engl. J. Med. 2000;343(4):230-8
3. Barton FB, Rickels MR, Alejandro R, Hering BJ, Wease S, Naziruddin B. et al. Improvement in outcomes of clinical islet transplantation: 1999-2010. Diabetes Care. 2012;35(7):1436-45
4. Emamaullee JA, Shapiro AM. Factors influencing the loss of beta-cell mass in islet transplantation. Cell Transplant. 2007;16(1):1-8
5. Eich T, Eriksson O, Sundin A, Estrada S, Brandhorst D, Brandhorst H. et al. Positron emission tomography: a real-time tool to quantify early islet engraftment in a preclinical large animal model. Transplantation. 2007;84(7):893-8
6. Moberg L, Johansson H, Lukinius A, Berne C, Foss A, Källen R. et al. Production of tissue factor by pancreatic islet cells as a trigger of detrimental thrombotic reactions in clinical islet transplantation. Lancet. 2002;360(9350):2039-45
7. Bennet W, Sundberg B, Groth CG, Brendel MD, Brandhorst D, Brandhorst H. et al. Incompatibility between human blood and isolated islets of Langerhans: a finding with implications for clinical intraportal islet transplantation? Diabetes. 1999;48(10):1907-14
8. Lau J, Henriksnäs J, Svensson J, Carlsson PO. Oxygenation of islets and its role in transplantation. Curr Opin Organ Transplant. 2009;14(6):688-93
9. Lau J, Kampf C, Mattsson G, Nyqvist D, Köhler M, Berggren PO. et al. Beneficial role of pancreatic microenvironment for angiogenesis in transplanted pancreatic islets. Cell Transplant. 2009;18(1):23-30
10. Piotto M, Moussallieh FM, Imperiale A, Benahmed MA, Detour J, Bellocq JP. et al. Reproducible sample preparation and spectrum acquisition techniques for metabolic profiling of human tissues by 1H HRMAS NMR. In Methodologies in metabolomics: experimental strategies and techniques for metabolomics research. Lutz NW, Sweedler JV, Wevers RA Eds. Cambridge, UK: Cambridge University Press. 2012:496-524
11. Duarte IF, Stanley EG, Holmes E, Lindon JC, Gil AM, Tang H. et al. Metabolic assessment of human liver transplants from biopsy samples at the donor and recipient stages using high-resolution magic angle spinning 1H NMR spectroscopy. Anal Chem. 2005;77(17):5570-8
12. Benahmed MA, Santelmo N, Elbayed K, Frossard N, Noll E, Canuet M. et al. The assessment of the quality of the graft in an animal model for lung transplantation using the metabolomics 1H high-resolution magic angle spinning NMR spectroscopy. Magn Reson Med. 2012;68(4):1026-38
13. Wishart DS. Metabolomics: the principles and potential applications to transplantation. Am J Transplant. 2005;5(12):2814-20
14. Scott WE, Weegman BP, Ferrer-Fabrega J, Stein SA, Anazawa T, Kirchner VA. et al. Pancreas oxygen persufflation increases ATP levels as shown by nuclear magnetic resonance. Transplant. Proc. 2010;42(6):2011-5
15. Papas KK, Colton CK, Gounarides JS, Roos ES, Jarema MA, Shapiro MJ. et al. NMR spectroscopy in beta cell engineering and islet transplantation. Ann. N. Y. Acad. Sci. 2001;944:96-119
16. Hesse UJ, Schmitz-Rode M, Danis J, Tunggal B, Meyer G, Weyer J. et al. In vitro and in vivo viability assessment of unpurified pancreatic islet tissue. J. Surg. Res. 1994;57(5):556-62
17. Casanova D, Martino E, Perojo I, Ramos C, Erce C, Rodriguez A. et al. Is the high level of nitric oxide metabolites a marker in early rejection after experimental islet pancreas transplantation? Transplant. Proc. 1998;30(2):639-40
18. Maillard E, Juszczak MT, Clark A, Hughes SJ, Gray DR, Johnson PR. Perfluorodecalin-enriched fibrin matrix for human islet culture. Biomaterials. 2011;32(35):9282-9
19. Bottino R, Fernandez LA, Ricordi C, Lehmann R, Tsan MF, Oliver R. et al. Transplantation of allogeneic islets of Langerhans in the rat liver: effects of macrophage depletion on graft survival and microenvironment activation. Diabetes. 1998;47(3):316-23
20. Hollywood K, Brison DR, Goodacre R. Metabolomics: current technologies and future trends. Proteomics. 2006;6(17):4716-23
21. Maedler K, Sergeev P, Ris F, Oberholzer J, Joller-Jemelka HI, Spinas G. et al. Glucose-induced beta cell production of IL-1beta contributes to glucotoxicity in human pancreatic islets. J. Clin. Invest. 2002;110(6):851-60
22. Sutton R, Peters M, McShane P, Gray DW, Morris PJ. Isolation of rat pancreatic islets by ductal injection of collagenase. Transplantation. 1986;42(6):689-691
23. Johansson H, Lukinius A, Moberg L, Lundgren T, Berne C, Foss A. et al. Tissue factor produced by the endocrine cells of the islets of Langerhans is associated with a negative outcome of clinical islet transplantation. Diabetes. 2005;54(6):1755-62
24. Benahmed MA, Santelmo N, Elbayed K, Frossard N, Noll E, Canuet M. et al. The assessment of the quality of the graft in an animal model for lung transplantation using the metabolomics 1H high-resolution magic angle spinning NMR spectroscopy. Magn. Reson. Med. 2012;68(4):1026-38
25. Piotto M, Moussallieh FM, Dillmann B, Imperiale A, Neuville A, Brigand C. et al. Metabolic characterization of primary human colorectal cancers using high resolution magic angle spinning 1H magnetic resonance spectroscopy. Metabolomics. 2009;5(3):292-301
26. Benahmed MA, Elbayed K, Daubeuf F, Santelmo N, Frossard N, Namer IJ. NMR HRMAS spectroscopy of lung biopsy samples: Comparison study between human, pig, rat, and mouse metabolomics. Magn. Reson. Med. 2014;71(1):35-43
27. Scheller J, Chalaris A, Schmidt-Arras D, Rose-John S. The pro- and anti-inflammatory properties of the cytokine interleukin-6. Biochim Biophys Acta. 2011. 1813(5):878-88
28. Barshes NR, Wyllie S, Goss JA. Inflammation-mediated dysfunction and apoptosis in pancreatic islet transplantation: implications for intrahepatic grafts. J. Leukoc. Biol. 2005;77(5):587-97
29. Bode JG, Albrecht U, Häussinger D, Heinrich PC, Schaper F. Hepatic acute phase proteins-regulation by IL-6- and IL-1-type cytokines involving STAT3 and its crosstalk with NF-κB-dependent signaling. Eur. J. Cell Biol. 2012;91(6-7):496-505
30. Giffen PS, Turton J, Andrews CM, Barrett P, Clarke CJ, Fung KW. et al. Markers of experimental acute inflammation in the Wistar Han rat with particular reference to haptoglobin and C-reactive protein. Arch. Toxicol. 2003;77(7):392-402
31. Jinbo T, Motoki M, Yamamoto S. Variation of serum alpha2-macroglobulin concentration in healthy rats and rats inoculated with Staphylococcus aureus or subjected to surgery. Comp. Med. 2001;51(4):332-5
32. Donath MY, Böni-Schnetzler M, Ellingsgaard H, Halban PA, Ehses JA. Cytokine production by islets in health and diabetes: cellular origin, regulation and function. Trends Endocrinol Metab. 2010;21(5):261-7
33. Ellingsgaard H, Hauselmann I, Schuler B, Habib AM, Baggio LL, Meier DT. et al. Interleukin-6 enhances insulin secretion by increasing glucagon-like peptide-1 secretion from L cells and alpha cells. Nat Med. 2011;17(11):1481-9
34. Cressman DE, Greenbaum LE, DeAngelis RA, Ciliberto G, Furth EE, Poli V. et al. Liver failure and defective hepatocyte regeneration in interleukin-6-deficient mice. Science. 1996;274(5291):1379-83
35. Nilsson B, Ekdahl KN, Korsgren O. Control of instant blood-mediated inflammatory reaction to improve islets of Langerhans engraftment. Curr. Opin. Organ Transplant. 2011;16(6):620-6
36. Moberg L. The role of the innate immunity in islet transplantation. Ups J Med Sci. 2005;110(1):17-55
37. Wilson JT, Chaikof EL. Thrombosis and inflammation in intraportal islet transplantation: a review of pathophysiology and emerging therapeutics. J. Diabetes Sci. Technol. 2008;2(5):746-59
38. Bennet W, Groth CG, Larsson R, Nilsson B, Korsgren O. Isolated human islets trigger an instant blood mediated inflammatory reaction: implications for intraportal islet transplantation as a treatment for patients with type 1 diabetes. Ups. J. Med. Sci. 2000;105(2):125-33
39. Kaufmann SH. Immunology's foundation: the 100-year anniversary of the Nobel Prize to Paul Ehrlich and Elie Metchnikoff. Nat. Immunol. 2008;9(7):705-12
40. Chertov O, Ueda H, Xu LL, Tani K, Murphy WJ, Wang JM. et al. Identification of human neutrophil-derived cathepsin G and azurocidin/CAP37 as chemoattractants for mononuclear cells and neutrophils. J. Exp. Med. 1997;186(5):739-47
41. Silva MT. When two is better than one: macrophages and neutrophils work in concert in innate immunity as complementary and cooperative partners of a myeloid phagocyte system. J. Leukoc. Biol. 2010;87(1):93-106
42. Moberg L, Korsgren O, Nilsson B. Neutrophilic granulocytes are the predominant cell type infiltrating pancreatic islets in contact with ABO-compatible blood. Clin. Exp. Immunol. 2005;142(1):125-31
43. Carlsson PO, Palm F, Andersson A, Liss P. Markedly decreased oxygen tension in transplanted rat pancreatic islets irrespective of the implantation site. Diabetes. 2001;50(3):489-95
44. Doherty M, Malaisse WJ. Glycogen accumulation in rat pancreatic islets: in vitro experiments. Endocrine. 2001;14(3):303-9
45. Malaisse WJ, Marynissen G, Sener A. Possible role of glycogen accumulation in B-cell glucotoxicity. Metabolism. 1992;41(8):814-9
46. Barnes TM, Otero YF, Elliott AD, Locke AD, Malabanan CM, Coldren AG. et al. Interleukin-6 amplifies glucagon secretion: coordinated control via the brain and pancreas. Am J Physiol Endocrinol Metab. 2014;307(10):E896-905
47. Arsenian M. Potential cardiovascular applications of glutamate, aspartate, and other amino acids. Clin. Cardiol. 1998;21(9):620-4
48. Le A, Lane AN, Hamaker M, Bose S, Gouw A, Barbi J. et al. Glucose-independent glutamine metabolism via TCA cycling for proliferation and survival in B cells. Cell Metab. 2012;15(1):110-21
49. Lutz NW. Contributions of metabol(om)ic NMR spectroscopy to the investigation of apoptosis. C.R. Chimie. 2006;9:445-51
50. Lazard D, Vardi P, Bloch K. Induction of beta-cell resistance to hypoxia and technologies for oxygen delivery to transplanted pancreatic islets. Diabetes Metab. Res. Rev. 2012;28(6):475-84
51. Lenzen S. Oxidative stress: the vulnerable beta-cell. Biochem. Soc. Trans. 2008;36:343-7
Author contact
![]() Corresponding author: Séverine Sigrist, UMR DIATHEC, EA 7294, Centre Européen d'Etude du Diabète, Université de Strasbourg, Fédération de Médecine Translationnelle de Strasbourg (FMTS), Bld René Leriche, 67200 Strasbourg, France Phone: +33 3 90 20 12 12, Fax: +33 3 90 20 12 19, e-mail: s.sigristorg.
Corresponding author: Séverine Sigrist, UMR DIATHEC, EA 7294, Centre Européen d'Etude du Diabète, Université de Strasbourg, Fédération de Médecine Translationnelle de Strasbourg (FMTS), Bld René Leriche, 67200 Strasbourg, France Phone: +33 3 90 20 12 12, Fax: +33 3 90 20 12 19, e-mail: s.sigristorg.