Impact Factor ISSN: 1449-2288
- Issue 12; 2026
- Issue 11; 2026
- Issue 10; 2026
- Issue 9; 2026
- Issue 8; 2026
- Volume 22; 2026
- Past Issues
- Advance Articles
- Editorial Board
- Cover Images
- Index & Coverage
- Cover Suggestion
- Special Issues
Introduction
Materials and Methods
Results
Discussion
Abbreviations
Supplementary Material
Acknowledgements
References

 Global reach, higher impact
Int J Biol Sci 2016; 12(12):1415-1426. doi:10.7150/ijbs.16823 This issue Cite
Research Paper
Catalpol Protects Pre-Myelinating Oligodendrocytes against Ischemia-induced Oxidative Injury through ERK1/2 Signaling Pathway
Qiyan Cai, Teng Ma, Chengren Li, Yanping Tian, Hongli Li ![]()
Chongqing Key Laboratory of Neurobiology, Department of Histology and Embryology, College of Basic Medicine, The Third Military Medical University, Chongqing, China.
Received 2016-7-12; Accepted 2016-9-6; Published 2016-10-26
Abstract

The vulnerability of pre-myelinating oligodendrocytes (PreOLs) to ischemic injury plays an important role in the pathogenesis and progression of perinatal white matter injury. Although oxidative stress is thought to be a major pathogenic mechanism predisposing the PreOLs to injury, no effective therapies have been identified to date. The present study aimed to investigate the direct protective effects of catalpol, a potent antioxidant and free radical scavenger, on ischemia-induced oxidative damage in PreOLs and to explore whether the ERK1/2 signaling pathway contributed to the protection provided by catalpol. Primary cultures of PreOLs exposed to oxygen-glucose deprivation (OGD) followed by reperfusion were used as an in vitro model of ischemia. Pretreatment with 0.5 mM catalpol for 1 h prior to OGD treatment significantly reversed ischemia-induced apoptosis in PreOLs and myelination deficits by inhibiting intracellular Ca2+ increase, reducing mitochondrial damage, and ameliorating overproduction of reactive oxygen species (ROS). The expression levels of phosphorylated ERK1/2 (p-ERK1/2) and activated poly-ADP-ribose polymerase-1 (PARP-1) were also markedly decreased by catalpol treatment. Blocking the ERK1/2 signaling pathway with the MEK inhibitor U0126 and catalpol significantly protected PreOLs from ROS-mediated apoptosis under OGD. Taken together, these results suggest that catalpol protects PreOLs against ischemia-induced oxidative injury through ERK1/2 signaling pathway. Catalpol may be a candidate for treating ischemic white matter damage.
Keywords: catalpol, pre-myelinating oligodendrocytes, oxidative stress, ERK1/2, oxygen-glucose deprivation
Introduction
Mature myelinating oligodendrocytes (OLs) develop from early oligodendrocyte progenitor cells (OPCs) through a number of successive stages [1]. During the period of high risk for perinatal white matter injury, immature white matter is populated predominantly by developing OLs, termed pre-myelinating oligodendrocytes (PreOLs) [2]. Increasing evidence supports that the heightened vulnerability of OL lineage cells to ischemic injury is maturation-dependent and that PreOLs are more susceptible than earlier or later stage cells [1, 3]. The preferential damage of PreOLs in response to ischemic injury accounts for subsequent deficits in OL maturation and myelination [4, 5].
Several maturation-dependent downstream mechanisms, such as microglial activation, excitotoxicity, and oxidative stress, have been implicated as contributing factors to the vulnerability of PreOLs to cerebral ischemic injury [6-8]. Among these mechanisms, oxidative stress resulting from the generation of reactive oxygen species (ROS) is thought to be the principal final common pathway that predisposes PreOLs to injury [9]. Excess ROS may directly impair mitochondrial function in PreOLs, resulting in subsequent translocation of apoptosis-inducing factors from the mitochondria to the nuclei and eventually leading to cell death [10]. Therefore, scavenging of abundant ROS, suppression of ROS levels by antioxidants, or blockade of the final common pathway leading to PreOL impairment may be effective in preventing oxidative cell death following ischemic injury.
Catalpol, an iridoid glycoside extracted from Rehmannia root, produces anti-ischemic effects both in vivo and in vitro [11-14]. Catalpol can protect rat pheochromocytoma cells and primary cultured astrocytes against ischemia-induced damage by suppressing free radical production and increasing antioxidant capacity [13, 14]. In addition, catalpol can protect mesencephalic neurons from oxidative damage and mitochondrial dysfunction induced by MPTP [15]. Recently, we demonstrated that catalpol inhibits OL death and myelin damage in rats with chronic cerebral hypoperfusion [16, 17]. However, the direct protective effects of catalpol on developing OLs and the underlying molecular mechanisms during ischemic injury remain unclear.
We previously reported that the PI3K inhibitor LY294002 failed to completely block catalpol-mediated neuroprotection against caspase-3 activation [17]. This suggests that, in addition to Akt-dependent mechanism, other pathways may also contribute to the effects of catalpol on OLs. Oxidative stress elicited by ROS generation is often linked to activation of the extracellular signal-regulated kinase 1/2 (ERK1/2) signaling pathway, and cellular oxidative damage in several paradigms requires sustained ERK1/2 phosphorylation [18, 19]. Recent studies have revealed that the ERK1/2 signaling pathway is activated during ischemic damage and contributes to ischemia-induced OL death [20]. It has also been reported that catalpol-mediated suppression of ERK1/2 is a pivotal mechanism explaining its neuroprotection against rotenone-induced oxidative stress in mesencephalic neurons [21]. These findings suggest that ERK1/2 pathway may be involved in the protective mechanisms of catalpol in OL lineage cells subjected to ischemia.
In the present study, we aimed to investigate the protective effects of catalpol against oxygen-glucose deprivation (OGD)-induced oxidative damage in cultured PreOLs and to explore the possible mechanisms involved with regard to the ERK1/2 signaling pathway. Catalpol was found to effectively protect PreOLs from OGD-induced apoptosis and myelination deficits by inhibiting Ca2+ overload, mitochondrial damage, and ROS production, and the ERK1/2 signaling pathway was shown to contribute to these effects. These data suggest that catalpol may be an effective agent for both prevention and intervention of disorders involving damage to white matter PreOLs caused by oxidative stress.
Materials and Methods
Oligodendrocyte progenitor cell culture
Rat OPCs were propagated as previously described [22]. Briefly, mixed cells were isolated from the cerebral cortices of P1-P3 Sprague Dawley rat pups in accordance with the guidelines set. All experimental protocols were approved by the Laboratory Animal Welfare and Ethics Committee of the Third Military Medical University. The cells were enriched through two passages in OPC-growth medium. For experiments, the purified OPCs were seeded onto cover slips or dishes coated with poly-D-lysine. After 12 h of incubation in OPC-growth medium, the OPCs were induced to differentiate using OPC-differentiation medium (DMEM/F12 + 1% N2 supplement + 1% fetal bovine serum + 5 mg/ml insulin). Cultures were routinely characterized by immunocytochemical detection of the expression levels of developmental stage-specific OL markers. On day 3 of differentiation, the cultures that contained >90% O4+ PreOLs were used for experiments. The purity of oligodendroglial cultures was assessed by examining cell morphology using a phase-contrast microscope and was confirmed by immunostaining with cell type-specific antibodies; only cultures with >94% purity were used. The cells were used for various experiments at the indicated time points.
Oxygen-glucose deprivation and drug treatment
PreOL cultures were divided into the following five groups: control group (CTL), OGD-treated group (OGD), catalpol-treated group (CAT), U0126-treated group (U0126) and U0126 + catalpol-treated group (U0126+CAT). OGD was used as an in vitro model of cerebral ischemia. OGD was produced using glucose-free DMEM medium (Gibco, Grand Island, NY, USA) supplemented with 8 mM Na2S2O4 (Sigma-Aldrich, St Louis, MO, USA), which scavenges O2 molecules in solution and reduces the oxygen tension to zero: the PreOLs were incubated in this medium at 37°C for 30 min. Following this, the cells were incubated with glucose-containing medium under normal growth conditions for an additional 12 h.
Catalpol was purchased from the National Institute for the Control of Pharmaceutical and Biological Products (Beijing, China). U0126 was purchased from Calbiochem (San Diego, CA, USA). In previous tests, 0.5 mM catalpol was shown to be the most effective concentration for increasing the cell viability of PreOLs subjected to OGD by MTT assay (Figure S1). Thus, 0.5 mM catalpol was used in the subsequent experiments. Cells in the CAT and U0126 groups were preincubated with 0.5 mM catalpol or 10 μM U0126, respectively, for 1 h prior to OGD. Cells in the U0126+CAT group were simultaneously preincubated with 0.5 mM catalpol and 10 μM U0126 for 1 h prior to OGD. Cells in the CTL group were kept under normal growth conditions without OGD, catalpol, or U0126 treatment.
Immunocytochemistry
PreOL cultures on 24-well plates (4.5×10⁴ cells/well) were fixed in ice-cold methanol for 20 min at -20°C, followed by three washes in phosphate-buffered saline (PBS). The cells were then blocked in PBS containing 5% bovine serum albumin (BSA) and 0.4% Triton X-100 for 30 min at 37°C. Afterwards, the cells were incubated with primary antibodies against the OL lineage markers O4 (1:100, Sigma-Aldrich) and 2',3'-cyclic nucleotide 3'-phosphodiesterase (CNPase) (1:100, Boster, Wuhan, China) overnight at 4°C. After washing, the cells were incubated for 2 h at room temperature with an Alexa Fluor 568-coupled secondary antibody (1:1000, Invitrogen, Carlsbad, CA, USA) and then washed again in PBS and mounted in VectaShield with 4',6-diamidino-2-phenylindole (DAPI) (0.1 μg/ml in PBS, Sigma-Aldrich) for 5 min to visualize nuclei. Finally, the cells were sealed and observed with a laser scanning confocal microscope (Olympus, Japan). Negative controls were prepared by omitting the primary antibodies.
Western blot analysis
Cells grown in 60 mm dishes (3.0×10⁵ cells/ml) were rinsed with PBS and then centrifuged at 12,000 g for 30 min at 4°C. After suspension in RIPA lysis buffer (Millipore, Billerica, MA, USA) for 30 min on ice, protein concentrations were determined by Bradford assay. Following the addition of loading buffer and boiling for 5 min, equal amounts of protein from each sample were subjected to SDS-PAGE, and the proteins were transferred to polyvinylidene difluoride membranes (Millipore). The membranes were first blocked with 1% non-fat dried milk in 10 mM PBS with 0.05% Tween-20 (PBST) for 2 h at room temperature and then incubated overnight at 4°C with antibodies targeting the following proteins: CNPase (1:500, Boster), myelin basic protein (MBP) (1:500, Santa Cruz Biotechnology, CA, USA), phosphorylated ERK1/2 (p-ERK1/2) (1:500, Cell Signaling Technology, Beverly, MA, USA), ERK1/2 (1:500, Cell Signaling), activated poly-ADP-ribose polymerase-1 (PARP-1) (1:500, Santa Cruz), and glyceraldehyde-3-phosphate dehydrogenase (GAPDH) (1:2000, Bioworld Technology, Inc., USA). After washing with PBST, the membranes were incubated with the appropriate horseradish peroxidase-conjugated secondary antibodies (1:5000, Santa Cruz) at 37°C for 3 h. Protein bands were detected by the enhanced chemiluminescence method (ECL kit, Amersham, UK).
Flow cytometric analysis of apoptotic cells
Flow cytometric analysis was used to assay DNA damage. At the end of the OGD and drug treatments, cells cultured in dishes were harvested by trypsinization and washed with PBS, followed by fixation in 70% ice-cold ethanol at 4°C overnight. The cells were washed twice with PBS, resuspended in 1 ml PBS containing 1
 mg/ml RNase (Sigma) and 50
 μg/ml PI (Sigma), and incubated at 37°C for 30
 min in the dark. The stained cells were analyzed via fluorescence-activated cell sorting (FACS) on a flow cytometer equipped with an argon ion laser (488 nm wavelength). The numbers of apoptotic cells were quantitatively estimated by observing sub-G1 cells that emitted DNA fluorescence in subdiploid regions, which were well separated from the normal G1 peak.
Measurement of intracellular ROS
Intracellular ROS generation was investigated using a dichlorodihydrofluorescein diacetate (DCFH-DA) assay. After 12 h of reperfusion, cells seeded in 60 mm dishes were harvested and treated with 10 μM DCFH-DA (Beyotime Institute of Biotechnology, Nangtong, China) at 37 °C for 20 min. Then, the cells were washed three times with serum-free culture medium. DCFH-DA reacts with ROS to form the fluorescent product DCF, which was measured with a fluorescent plate reader (Bio-TEK, USA) at excitation and emission wavelengths of 488 nm and 525 nm, respectively. The fluorescence intensity indicates the level of ROS.
12-Lipoxygenase activity assay
The activity of 12-lipoxygenase (12-LOX), a key generator of ROS in PreOLs, was measured by quantifying the major metabolic product 12-HETE using an ELISA Kit (R&D Systems, USA) according to the manufacturer's instructions. At the end of OGD and drug treatment, cells in 60 mm dishes were rinsed with PBS, followed by centrifugation at 12,000 g for 30 min at 4°C. Samples were suspended in RIPA lysis buffer, and protein concentrations were determined by Bradford assay. The supernatants were incubated with a biotinylated anti-rat 12-HETE antibody in microtiter wells for 60 min at 37°C and then with HRP-conjugated streptavidin for 30 min at 37°C. Next, substrate solution was added to each well and incubated for 15 min in darkness, followed by a termination procedure. Finally, the absorbance of each well was measured at a wavelength of 450 nm. The concentration of 12-HETE in each sample was calculated based on standard curves and normalized based on the amount of protein in the sample.
Measurement of malondialdehyde levels
Collected cells were homogenized in ice-cold phosphate buffer, and the homogenate (10%) was centrifuged at 4000 rpm at 4 °C for 10 min. After the amount of total protein was detected, the supernatant was used for spectrophotometric determination of the level of malondialdehyde (MDA) according to the procedure provided with the assay kit (Nanjing Jiancheng Bioengineering Institute, Nanjing, China). MDA, the degradation production of preoxidation lipids, reacts with thiobarbituric acid to form a pink chromogen that can be measured at a wavelength of 532 nm. MDA level reflects the degree of cell destruction by free radicals.
Mitochondrial membrane potential assay
Mitochondrial transmembrane potential was detected using a JC-1 mitochondrial membrane potential assay kit (Beyotime) according to the manufacturer's protocol. Briefly, cells cultured in 24-well plates were incubated with an equal volume of JC-1 staining solution (5 μg/ml) at 37 °C for 20 min and rinsed twice with JC-1 staining buffer. Mitochondrial membrane potential was monitored by determining the relative dual emission profiles from mitochondrial JC-1 monomers and aggregates using an Olympus fluorescent microscope. Each group of PreOLs was measured for mitochondrial membrane potential based on the ratio of red (i.e., aggregates in mitochondria) to green (i.e., monomers in cytosol) fluorescence. Increased green fluorescence and decreased red fluorescence indicated the loss of mitochondrial membrane potential.
Measurement of mitochondrial membrane permeability transition pore opening
Mitochondrial membrane permeability transition (MPT) pore opening was evaluated using a fluorescence detection kit (GENMED, USA) according to the manufacturer's instructions. Pore opening was measured directly using a combination of calcein AM and cobalt chloride. After entering mitochondria, calcein AM can be hydrolyzed by lactonase to release fluorescent calcein. Calcein that escapes from mitochondria following MPT pore opening is then quenched by cobalt chloride. The fluorescence intensities of stained mitochondria were measured using a microplate reader at excitation and emission wavelengths of 488 nm and 527 nm, respectively. The extent of MPT pore opening was estimated based on the difference in fluorescence intensity.
Transmission electron microscopy
After detachment from culture dishes, cells were centrifuged at 800 rpm for 5 min and then fixed in 2.5% glutaraldehyde at 4°C for 24 h. After washing three times with 6.8% Sabatini's solution (PBS with 6.8% sucrose), the samples were post-fixed in 1% osmium tetroxide for 2 h at 4°C. Then, the specimens were dehydrated in a graded series of ethanol (30, 50, 70, 90 and 100%) and cold acetone (90 and 100%) for 15 min each. Thereafter, the specimens were embedded in propylene oxide, which was polymerized overnight at 80°C. Semi-thin and ultra-thin sections were cut with a Leica Ultracut ultramicrotome and then stained with lead citrate and uranyl citrate for 10 min each. Finally, the samples were examined and photographed using a Philips TECNAI10 electron microscope.
Confocal Ca2+ imaging
Cells were grown in glass-bottomed dishes, treated with drugs, subjected to OGD, and then incubated in imaging wash buffer (135 mM NaCl, 2 mM glucose, 8 mM HEPES, 2 mM MgCl2, 3 mM KCl, and 2.2 mM CaCl2; pH 7.4) containing 5 μM Fluo-3/AM (Beyotime) for 20 min at 37°C. At the end of the incubation, the cells were maintained for at least 20 min at room temperature in fresh imaging wash buffer to allow complete dye de-esterification. They were then placed on a confocal laser scanning microscope to qualitatively evaluate intracellular Ca2+ levels. Fluorescence images were acquired and measured using a confocal laser scanning microscope (Olympus) and FluoView image-processing software (v2.1).
TUNEL staining
TUNEL staining was performed using an In Situ Cell Death Detection Kit, POD (Roche, Germany) according to the manufacturer's instructions. After washing with PBS, cells were incubated with 3% H2O2 in methanol for 10 min at room temperature to block endogenous peroxidases. Next, they were placed in permeabilization solution containing 0.1% Triton X-100 in 0.1% sodium citrate for 2 min on ice. The cells were then incubated with TUNEL reaction mixture for 60 min at 37°C. After washing with PBS, the cells were mounted in DAPI (0.1 μg/ml in PBS, Sigma) for 5 min to visualize nuclei. A negative control was created using Label Solution instead of the TUNEL reaction mixture.
Statistical analysis
All values are expressed as the mean ± SEM. One-way analysis of variance was performed, followed by Tukey's multiple comparison tests. Statistical analysis was performed using SPSS 12.0 for Windows. The significance level was set at P < 0.05.
Results
Catalpol attenuates morphological degeneration and apoptosis in PreOLs
To detect the effects of catalpol treatment on OGD-mediated morphological degeneration in PreOLs, phase-contrast microscopic observation and immunocytochemical staining for O4, a specific cell surface marker for PreOLs, were performed. After 3 d of differentiation, the majority of CTL cultures contained cells with complex, multibranched morphologies, extending an elaborate network of lacy processes (Figure 1A). The cells that acquired O4 immunoreactivity in the CTL group were larger and had multiple branches (Figure 1D). In contrast, cultures exposed to OGD did not exhibit an arbor-like network. Most of the OGD-treated cells retained a relatively simple morphology with few processes (Figure 1B) and with O4 immunoreactivity restricted to the cell body (Figure 1E). However, the administration of catalpol significantly reversed the morphological degeneration caused by OGD, as shown by increased process outgrowth (Figure 1C) and O4 immunostaining in cell processes (Figure 1F). These results verify that catalpol attenuates the degenerative morphological changes induced by OGD in PreOLs.
Effects of catalpol on morphological degeneration and apoptosis in PreOLs under OGD. (A-C) Representative phase-contrast images of cultured PreOLs in the CTL (A), OGD (B), and CAT (C) groups. (D-F) Representative O4 staining (red) patterns in the CTL (D), OGD (E), and CAT (F) groups. Cell nuclei were counterstained with DAPI (blue). (G-I) Representative flow cytometric DNA analysis in the CTL (G), OGD (H), and CAT (I) groups. (J) Quantification of apoptotic PreOLs in the CTL, OGD, and CAT groups. Data are expressed as percentages of the values in the CTL group and are shown as the means ± SEM (n = 6 in each group). **p < 0.01; ***p < 0.001. Bar = 50 μm (for A-F).
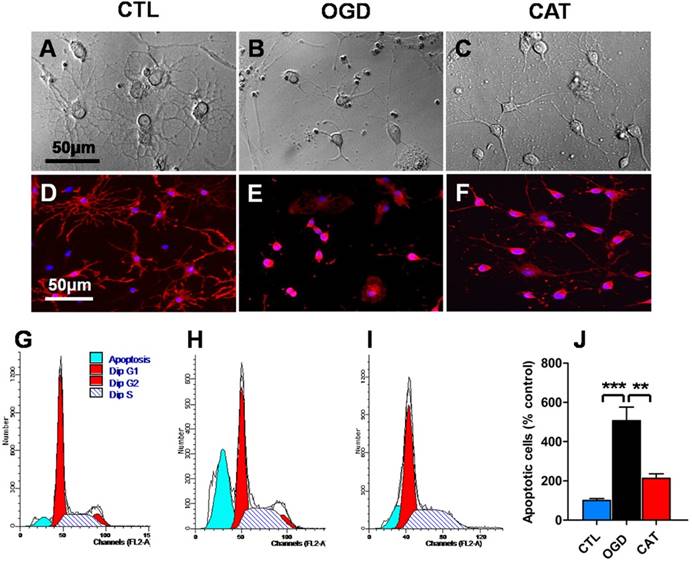
To investigate the effect of catalpol on OGD-induced apoptosis, flow cytometric analysis of PI staining was used to quantitatively estimate apoptotic cell populations. The percentage of sub-G1-phase PreOLs was low in the CTL group (Figures 1G and J); however, the fraction of sub-G1-phase cells significantly increased upon OGD stimulation compared to the control conditions (P < 0.001), and this increase was effectively prevented by treatment with catalpol (P < 0.01) (Figures 1H-J). These results suggest that catalpol significantly suppresses OGD-induced apoptosis in PreOLs.
Catalpol restores the expression of myelin proteins
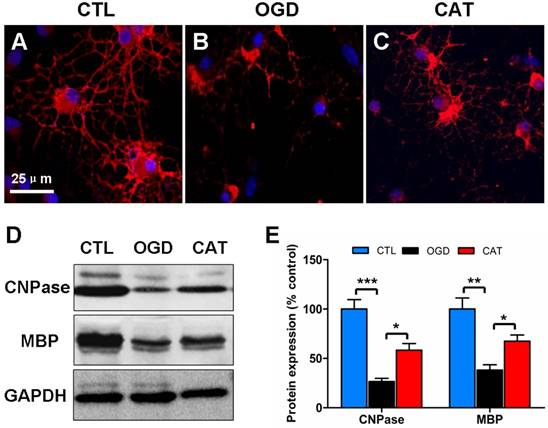
Previous studies have demonstrated that hypoxia/ischemia or OGD-induced injury impairs OPC maturation [23, 24]. To further define the function of catalpol on PreOL maturation after OGD, we examined the expression levels of CNPase (a marker of myelinating OLs) and MBP (a marker of mature OLs) in PreOL cultures on day 6 of differentiation using immunofluorescence staining and Western blot analysis. There were abundant CNPase-positive OLs in the CTL group, and these cells had complex networks of cellular processes (Figure 2A). The CNPase-positive cells in the OGD group appeared more immature, with fewer processes emanating from the cell body (Figure 2B). However, the delayed maturation was less evident following catalpol treatment, as shown by the presence of more complex processes (Figure 2C). Likewise, Western blot analysis showed a conspicuous reduction in CNPase and MBP protein expression in the OGD group compared to the CTL group (P < 0.001 and P < 0.01, respectively). Catalpol treatment markedly abrogated the decreased expression of CNPase and MBP relative to the OGD group (P < 0.05) (Figures 2D and E). These results suggest that catalpol preserves the developmental capacity of PreOLs to mature after OGD.
Effects of catalpol on myelin protein expression in PreOLs after OGD. (A-C) Representative CNPase staining (red) patterns in the CTL (A), OGD (B), and CAT (C) groups after 6 d of differentiation. Cell nuclei were counterstained with DAPI (blue). (D) Western blot showing CNPase and MBP expression in the CTL, OGD, and CAT groups. GAPDH was used as a loading control. The blot shown is representative of six independent experiments. (E) Quantification of CNPase and MBP protein expression levels from Western blot analysis. Data are expressed as percentages of the values in the CTL group and are shown as the means ± SEM (n = 6 in each group). *p < 0.05; **p < 0.01; ***p < 0.001. Bar = 25 μm (for A-C).
Catalpol reduces oxidative stress
To examine whether catalpol suppresses ODG-induced ROS generation, a DCFH-DA assay was performed to measure the levels of intracellular ROS after 3 d of differentiation. PreOLs in the OGD group demonstrated a robust increase in intracellular ROS generation compared to the CTL group (P < 0.01). These increased ROS levels were significantly reduced following treatment with catalpol (P < 0.05) (Figure 3A).
Effects of catalpol on ROS, 12-HETE and MDA levels in PreOLs under OGD. (A) Quantification of ROS levels in the CTL, OGD, and CAT groups. (B) Quantification of 12-HETE levels in the CTL, OGD, and CAT groups. (C) Quantification of MDA levels in the CTL, OGD, and CAT groups. Data are expressed as percentages of the values in the CTL group and are shown as the means ± SEM (n = 6 in each group). *p < 0.05; **p < 0.01; ***p < 0.001.
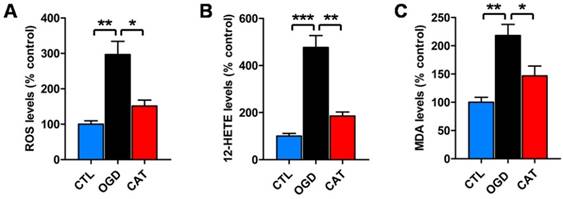
To further examine whether catalpol prevented ROS generation by inhibiting 12-LOX activity, we used a correlated ELISA kit to analyze the levels of 12-HETE, the stable reaction product of 12-LOX, in cultures subjected to OGD and catalpol treatment. The levels of 12-HETE were much higher in the cultures from the OGD group than in those from the CTL group (P < 0.001). However, in the CAT group, the levels of 12-HETE were significantly reduced compared to those in the OGD group (P < 0.01) (Figure 3B).
In addition, we detected the levels of lipid peroxidation in PreOLs, as indicated by MDA content. MDA levels were significantly increased in the OGD group in comparison with the CTL group (P < 0.01), and administration of catalpol resulted in a marked reduction in MDA levels (P < 0.05) (Figure 3C). These data collectively indicate that catalpol exerts protective effects on PreOLs subjected to OGD by reducing intracellular oxidative stress.
Catalpol prevents mitochondrial damage
Impairment of mitochondrial activity, typically reflected by a loss of mitochondrial membrane potential, can contribute to ROS generation. To monitor mitochondrial membrane potential, we quantified the signal emitted by the fluorescent probe JC-1 in different groups. PreOLs in the CTL group emitted red fluorescence in mitochondria in addition to faint green fluorescence (Figure 4A). OGD markedly induced the emission of green fluorescence and decreased mitochondrial membrane potential, as shown by the reduced red fluorescence when compared to normal PreOLs in the CTL group (P < 0.01) (Figures 4B and D). In contrast, catalpol treatment relieved the OGD-induced mitochondrial depolarization, as shown by the significant increase in the red fluorescence ratio (P < 0.05) (Figures 4C and D).
Effects of catalpol on mitochondrial damage in PreOLs under OGD. (A-C) Representative JC-1 staining patterns in the CTL (A), OGD (B), and CAT (C) groups. (D) Quantification of the red/green fluorescence ratios in the CTL, OGD, and CAT groups. The ratio of red/green fluorescence intensity represents the mitochondrial membrane potential. (E-G) Mitochondrial ultrastructure in the CTL (E), OGD (F), and CAT (G) groups. (H) Quantification of MPT pore opening in the CTL, OGD, and CAT groups. Data are expressed as percentages of the values in the CTL group and are shown as the means ± SEM (n = 6 in each group). *p < 0.05; **p < 0.01. Bar = 25 μm (for A-C); 0.5 μm (for E-G).
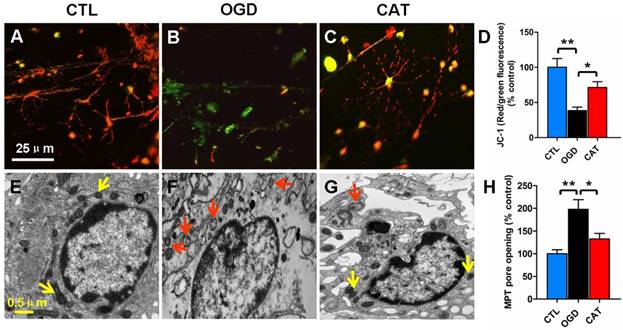
The loss of mitochondrial membrane potential results from the opening of MPT pores, which is an important event leading to programmed cell death [25, 26]. Thus, we investigated MPT pore opening using calcein AM and cobalt chloride. We found that the extent of MPT pore opening significantly increased in ODG-injured PreOLs compared with the CTL group (P < 0.01), and catalpol treatment markedly inhibited the extent of MPT pore opening (P < 0.05) (Figure 4H). These results confirm that catalpol prevents mitochondrial damage in PreOLs by maintaining mitochondrial membrane integrity.
Furthermore, electron microscopy was used to evaluate ultrastructural changes in mitochondria in PreOLs after OGD and catalpol treatment. The results showed that the PreOLs in the CTL group contained small, morphologically normal, round or oval mitochondria with a dark matrix and regular distribution of cristae (Figure 4E). In contrast, the PreOLs in the OGD group contained enlarged or swollen mitochondria with a pale matrix and few cristae (Figure 4F); catalpol treatment significantly attenuated this degenerative profile (Figure 4G).
Catalpol inhibits the intracellular calcium increase
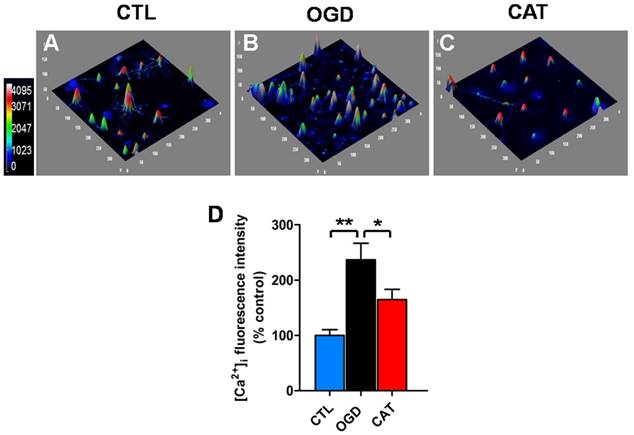
It has been suggested that ischemia-induced intracellular Ca2+ overload may cause mitochondrial dysfunction, increase oxidative stress, and even induce cell death. We therefore investigated the effect of catalpol on intracellular Ca2+ levels in PreOLs exposed to OGD using the Ca2+-specific fluorescent probe Fluo-3/AM. Intracellular Ca2+ levels were markedly elevated in PreOLs subjected to OGD, as demonstrated by a significantly elevated average fluorescence intensity of Fluo-3 when compared to that measured for the CTL group (P < 0.01) (Figures 5A, B and D). In contrast, administration of catalpol significantly reduced intracellular Ca2+ levels in PreOLs, as indicated by a decrease in the average fluorescent intensity of Fluo-3 in comparison to the untreated OGD group (P < 0.05) (Figures 5B-D). These data suggest that catalpol attenuates OGD-induced injury in PreOLs by normalizing intracellular Ca2+ concentration.
Effects of catalpol on intracellular calcium levels in PreOLs under OGD. (A-C) Representative Fluo-3 staining in the CTL (A), OGD (B), and CAT (C) groups. Intracellular Ca2+ levels (Fluo-3 staining) are indicated with a pseudocolor range (left side, color scale 0 to 4095). (D) Quantification of the average fluorescence intensity of Fluo-3 in the CTL, OGD, and CAT groups. Data are expressed as percentages of the values in the CTL group and are shown as the means ± SEM (n = 6 in each group). *p < 0.05; **p < 0.01.
Catalpol blocks the ERK1/2 pathway
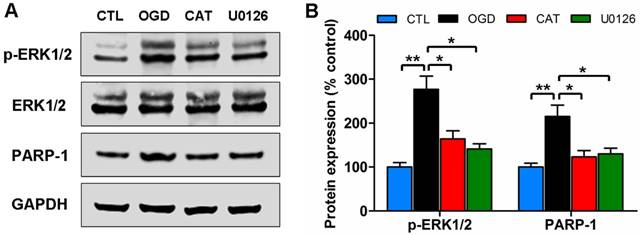
To determine whether the ERK1/2 signaling pathway is involved in the protective effects mediated by catalpol on PreOLs following OGD-induced injury, we assessed the activation of the pathway by Western blot analysis to measure the levels of phosphorylated ERK1/2 (p-ERK1/2) and PARP-1, an ERK1/2 target involved in cell death. The p-ERK1/2 protein levels were low in the CTL group, but they significantly increased in response to OGD (P < 0.01), and this increase was effectively prevented by administration of catalpol (P < 0.05). Blocking the ERK1/2 pathway with the MEK inhibitor U0126 substantially decreased the p-ERK1/2 protein levels compared with the untreated OGD group (P < 0.05), which showed no significant difference from the CAT group. Similar to p-ERK1/2, PARP-1 protein levels were significantly higher following OGD than those in the CTL group (P < 0.01), and catalpol treatment significantly inhibited this elevation (P < 0.05). Following ERK1/2 inhibition using U0126, the increased PARP-1 protein levels were also markedly reduced compared to those in the OGD group (P < 0.05), similar to what was observed with catalpol treatment (Figures 6A and B). These data indicate that the protective effects mediated by catalpol on PreOLs are correlated with reduced ERK1/2 activity.
Effects of catalpol on the activation of the ERK1/2 pathway in PreOLs under OGD. (A) Western blot analysis for p-ERK1/2 and PARP-1 expression in the CTL, OGD, CAT, and U0126 groups. Total ERK1/2 and GAPDH were used as loading controls. The blot shown is representative of six independent experiments. (B) Quantification of p-ERK1/2 and PARP-1 protein expression levels from Western blot analysis. Data are expressed as percentages of the values in the CTL group and are shown as the means ± SEM (n = 6 in each group). *p < 0.05; **p < 0.01.
Blocking the ERK1/2 pathway inhibits the oxidative injury of PreOLs
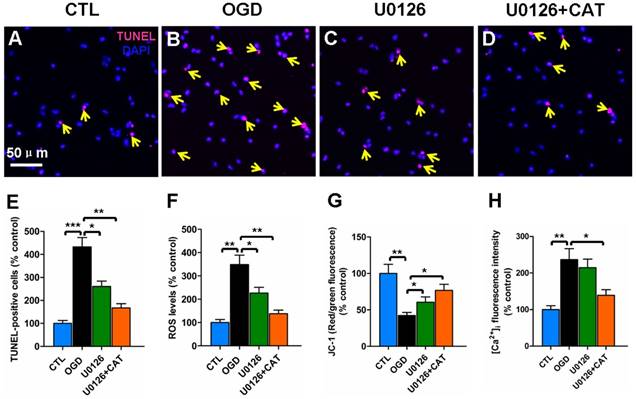
To further investigate the contribution of ERK1/2 signaling pathway to catalpol-mediated cytoprotection, we evaluated changes in apoptosis, ROS generation, mitochondrial membrane potential, and intracellular Ca2+ levels in PreOLs in the presence of U0126 and catalpol. Very few TUNEL-labeled apoptotic cells were found in the CTL group (Figure 7A). In contrast, the number of apoptotic cells in the OGD group was significantly higher than in the CTL group (P < 0.001), and this increase in apoptosis was significantly prevented by administration of U0126 (P < 0.05) or co-application of U0126 and catalpol (P < 0.01) (Figures 7B-E). ROS levels after OGD were also significantly increased compared with those in the CTL group (P < 0.01), and this effect was partly inhibited by applying U0126 (P < 0.05) or U0126 plus catalpol (P < 0.01) (Figure 7F). Likewise, U0126 or the co-application of U0126 and catalpol markedly inhibited OGD-induced mitochondrial depolarization (P < 0.05) (Figure 7G). U0126 alone did not appear to significantly reduce the OGD-induced increase in intracellular Ca2+ levels; however, the application of U0126 plus catalpol partly inhibited this increase (P < 0.05) (Figure 7H).
Effects of blocking ERK1/2 pathway on the oxidative injury of PreOLs under OGD. (A-D) Representative TUNEL staining (red) patterns in the CTL (A), OGD (B), U0126 (C), and U0126+CAT (D) groups. Cell nuclei were counterstained with DAPI (blue). (E) Quantification of TUNEL-positive cells in the CTL, OGD, U0126, and U0126+CAT groups. (F) Quantification of ROS levels in the CTL, OGD, U0126, and U0126+CAT groups. (G) Quantification of red/green fluorescence ratios after JC-1 staining in the CTL, OGD, U0126, and U0126+CAT groups. (H) Quantification of the average fluorescence intensities of Fluo-3 in the CTL, OGD, U0126, and U0126+CAT groups. Data are expressed as percentages of the values in the CTL group and are shown as the means ± SEM (n = 6 in each group). *p < 0.05; **p < 0.01; ***p < 0.001. Bar = 50 μm (for A-D).
Discussion
White matter PreOLs in the immature brain are especially vulnerable to oxidative stress because of a series of maturation-dependent events [1, 9]. Hypoxia-ischemia, a primary risk factor for white matter damage, has been demonstrated to cause widespread death of PreOLs and subsequent failure of myelination [24, 27, 28], principally via oxidative mechanisms [5]. Submitting cultured cells to OGD creates a useful in vitro model of hypoxia-ischemia that mimics the key mechanisms of cell damage that are caused by hypoxia-ischemia [24, 29]. Our experiments using defined, stage-specific cultures demonstrated that OGD induces intracellular Ca2+ overload, increases mitochondrial damage, and enhances ROS generation, which leads to the activation of the ERK1/2 signaling pathway, resulting in PreOL death and arrested cell maturation. Catalpol exerts direct protective effects against OGD toxicity in PreOLs, partially by inhibiting the activation of the ERK1/2 signaling pathway.
Arrested maturation of OPCs has been observed in chronic perinatal white matter injury and in primary cultures exposed to OGD [4, 24]. French et al. [30] indicated that oxidative stress inhibits OL differentiation and maturation. In the current study, PreOL maturation and myelination were also affected by ischemic injury, as demonstrated by a marked reduction in the morphological complexity of these cells and their reduced expression of myelin proteins following OGD. The decreased myelination might result from the loss of PreOLs due to increased apoptosis. It may also be the consequence of delayed development or malfunction of PreOLs. Mechanisms potentially contributing to ischemia-induced myelin loss include reduced synthesis of mRNA and increased degradation of myelin proteins [31]. Activation of specific proteases, such as calpain, following hypoxic-ischemic injury may also contribute to the degradation of myelin proteins [32]. The beneficial effects of catalpol on PreOL maturation are supported by the increased expression of CNPase and MBP observed following catalpol treatment after OGD. These effects of catalpol may be achieved partly by promoting cell survival and improving the function of PreOLs.
Excessive ROS generation due to oxidative stress is considered a major factor in the pathogenesis and progression of perinatal white matter injury [9]. ROS accumulation may cause cell damage either directly, by destroying biomolecules such as lipids, proteins and DNA, or indirectly, by affecting intracellular signal transduction pathways [33]. Mitochondria are considered the major site of intracellular ROS production, and mitochondrial damage promotes the massive release of ROS [34]. It is generally accepted that the decrease of mitochondrial membrane potential affects the opening of MPT pore, which ultimately leads to mitochondria-dependent cell death [25, 26]. Therefore, preventing mitochondrial damage may effectively inhibit oxidative cell damage. Many studies of both cells and animals have shown that catalpol is capable of scavenging ROS and enhancing antioxidant abilities by improving mitochondrial functions that protect against oxidative attack [13-15, 35]. Consistent with previous findings, our study supports that catalpol acts as an oxidant scavenger and thereby protects PreOLs against OGD-induced oxidative toxicity. These protective effects are likely associated with improved mitochondrial function, as shown by increased mitochondrial membrane potential and decreased MPT pore opening.
An elevation in cytosolic free Ca2+ has been recognized as a trigger for cell death [36]. Under normal physiological conditions, intracellular Ca2+ homeostasis is very important for maintaining numerous cellular processes, including proliferation, migration, differentiation, and survival. When intracellular Ca2+ homeostasis is perturbed by neurotransmitters, hormones, growth factors or cytokines, Ca2+ overload occurs. This massive Ca2+ influx excessively activates Ca2+-dependent signaling pathways, contributing to cell damage or death [37, 38]. Studies have shown that ischemia induces an elevation in intracellular Ca2+ levels arising from either intracellular stores or the entry of Ca2+ from extracellular space [39]. Alterations in intracellular Ca2+ homeostasis disrupt mitochondrial Ca2+ equilibrium, resulting in depolarization of this organelle, as well as ROS formation and eventually cell death [39, 40]. In the present study, intracellular Ca2+ levels in PreOLs were significantly elevated following OGD injury, and catalpol treatment markedly decreased this OGD-induced Ca2+ overload. These observations clearly indicate that catalpol has a role in restoring Ca2+ balance following ischemia and thereby supports cell survival.
Previous reports have shown that the ERK1/2 signaling pathway is activated during oxidative stress and that ERK1/2 phosphorylation plays a key role in mediating cell survival/cell death, depending on stimulus duration and cell type [41, 42]. This dual role of the ERK1/2 signaling pathway has also been observed in OLs. A rapid and transient increase in ERK1/2 phosphorylation secondary to AMPA receptor activation inhibits OL death [39], whereas delayed and sustained ERK1/2 phosphorylation following ischemia and reperfusion induces OL death [20]. Herein, we found that OGD-induced activation of ERK1/2 clearly resulted in PreOL damage, because blockade of this pathway by U0126 significantly inhibited PreOL death, reduced ROS generation, and ameliorated mitochondrial dysfunction. These results indicate that ROS generation is both an upstream and a downstream event of ERK1/2 activation, demonstrating the existence of a positive feedback loop that mediates ROS generation. It has been reported that Ca2+-sensitive signal transduction pathways are associated with ROS-mediated activation of ERK1/2 [43]. Such Ca2+ permeability pathways increase intracellular Ca2+ levels, which in turn activates several Ca2+-dependent protein kinases that trigger ERK phosphorylation [44]. U0126 did not significantly inhibit ischemia-induced cytosolic Ca2+ overload in PreOLs, suggesting that the factors driving Ca2+ increases are upstream of ERK1/2 activation. The inhibitory effects of catalpol on OGD-induced ERK1/2 activation suggest that catalpol protects PreOLs against ischemia-induced oxidative injury partially through the ERK1/2 signaling pathway. In addition, we observed that co-application of U0126 and catalpol produced additive effects on PreOL survival. This finding supports that catalpol exerts its effects through multiple pathways during ischemia.
The nuclear enzyme PARP-1 is an ERK1/2 target that is involved in cell death. Phosphorylated ERK1/2, particularly ERK2, can activate PARP-1 through a direct interaction that is unrelated to DNA binding or DNA damage [45]. PARP-1 has been implicated in caspase-independent cell death due to its role in cellular NAD depletion, which further induces energy failure, mitochondrial depolarization, MPT pore opening, and apoptosis-inducing factor translocation in response to stress [46, 47]. A recent study indicated that PARP-1 plays important roles in OL death [48]. In an in vitro model of ischemia, ERK1/2-mediated PARP-1 activation was involved in OL death in a caspase-independent manner [20]. Consistent with this, our data showed that OGD treatment over-activated PARP-1 and that this effect was markedly inhibited by U0126 or catalpol. These observations suggest that PARP-1 activation occurs downstream of ERK1/2 activation and that the ERK/PARP pathway is involved in catalpol-mediated cytoprotection. PARP-1 activation is associated with the degeneration of OL processes and mediates OL loss and demyelination in experimental models of multiple sclerosis [48, 49]. These morphological degeneration were also observed in PreOLs in our ischemic model, as shown by reduced process complexity and decreased myelination, further confirming the role of PARP-1 activation in PreOL injury.
In conclusion, catalpol effectively protected PreOLs from OGD-induced cell death and myelination deficits by suppressing Ca2+ influx, reducing mitochondrial damage, and inhibiting ROS overproduction, followed by attenuation of ERK1/2 and PARP-1 activation. These results indicate that catalpol may be a useful preventive or therapeutic drug for ischemic white matter damage.
Abbreviations
PreOL: pre-myelinating oligodendrocyte; OL: oligodendrocyte; OPC: oligodendrocyte progenitor cell; OGD: oxygen-glucose deprivation; ROS: reactive oxygen species; ERK1/2: extracellular signal-regulated kinase 1/2; PARP-1: poly-ADP-ribose polymerase-1; CNPase: 2',3'-cyclic nucleotide 3'-phosphodiesterase; MBP: myelin basic protein; DAPI: 4',6-diamidino-2-phenylindole; GAPDH: glyceraldehyde-3-phosphate dehydrogenase; 12-LOX: 12-lipoxygenase; 12-HETE: 12-hydroxyeicosatetraenoic acid; MDA: malondialdehyde; MPT: membrane permeability transition.
Supplementary Material
Supplementary figure S1.
Acknowledgements
This study was supported by grants from the National Natural Science Foundation of China (NSCF 31500969, 31271467), Natural Science Foundation Project of Chongqing (CSTC2011jjA10026) and Youth Talent Innovation Foundation of the Third Military Medical University, China (2011XQN01).
Competing Interests
The authors have declared that no competing interest exists.
References
1. Back SA, Han BH, Luo NL, Chricton CA, Xanthoudakis S, Tam J. et al. Selective vulnerability of late oligodendrocyte progenitors to hypoxia-ischemia. J Neurosci. 2002;22:455-463
2. Back SA, Luo NL, Borenstein NS, Levine JM, Volpe JJ, Kinney HC. Late oligodendrocyte progenitors coincide with the developmental window of vulnerability for human perinatal white matter injury. J Neurosci. 2001;21:1302-1312
3. Riddle A, Luo NL, Manese M, Beardsley DJ, Green L, Rorvik DA. et al. Spatial heterogeneity in oligodendrocyte lineage maturation and not cerebral blood flow predicts fetal ovine periventricular white matter injury. J Neurosci. 2006;26:3045-3055
4. Segovia KN, McClure M, Moravec M, Luo NL, Wan Y, Gong X. et al. Arrested oligodendrocyte lineage maturation in chronic perinatal white matter injury. Ann Neurol. 2008;63:520-530
5. Volpe JJ. Neurology of the newborn (5th ed.). Philadelphia, USA: Saunders Elsevier. 2008
6. Falahati S, Breu M, Waickman AT, Phillips AW, Arauz EJ, Snyder S. et al. Ischemia-induced neuroinflammation is associated with disrupted development of oligodendrocyte progenitors in a model of periventricular leukomalacia. Dev Neurosci. 2013;35:182-196
7. Matute C, Alberdi E, Domercq M, Sánchez-Gómez MV, Pérez-Samartín A, Rodríguez-Antigüedad A. et al. Excitotoxic damage to white matter. J Anat. 2007;210:693-702
8. Miyamoto N, Maki T, Pham LD, Hayakawa K, Seo JH, Mandeville ET. et al. Oxidative stress interferes with white matter renewal after prolonged cerebral hypoperfusion in mice. Stroke. 2013;44:3516-3521
9. Volpe JJ, Kinney HC, Jensen FE, Rosenberg PA. The developing oligodendrocyte: key cellular target in brain injury in the premature infant. Int J Dev Neurosci. 2011;29:423-440
10. Baud O, Li J, Zhang Y, Neve RL, Volpe JJ, Rosenberg PA. Nitric oxide-induced cell death in developing oligodendrocytes is associated with mitochondrial dysfunction and apoptosis-inducing factor translocation. Eur J Neurosci. 2004;20:1713-1726
11. Li DQ, Bao YM, Li Y, Wang CF, Liu Y, An LJ. Catalpol modulates the expressions of Bcl-2 and Bax and attenuates apoptosis in gerbils after ischemic injury. Brain Res. 2006;1115:179-185
12. Zhu HF, Wan D, Luo Y, Zhou JL, Chen L, Xu XY. Catalpol increases brain angiogenesis and up-regulates VEGF and EPO in the rat after permanent middle cerebral artery occlusion. Int J Biol Sci. 2010;6:443-453
13. Wang Z, An LJ, Duan YL, Li YC, Jiang B. Catalpol protects rat pheochromocytoma cells against oxygen and glucose deprivation-induced injury. Neurol Res. 2008;30:106-112
14. Li Y, Bao Y, Jiang B, Wang Z, Liu Y, Zhang C. et al. Catalpol protects primary cultured astrocytes from in vitro ischemia-induced damage. Int J Dev Neurosci. 2008;26:309-317
15. Bi J, Wang XB, Chen L, Hao S, An LJ, Jiang B. et al. Catalpol protects mesencephalic neurons against MPTP induced neurotoxicity via attenuation of mitochondrial dysfunction and MAO-B activity. Toxicol In Vitro. 2008;22:1883-1889
16. Cai QY, Chen XS, Zhan XL, Yao ZX. Protective effects of catalpol on oligodendrocyte death and myelin breakdown in a rat model of chronic cerebral hypoperfusion. Neurosci Lett. 2011;497:22-26
17. Cai QY, Yao ZX, Li HL. Catalpol promotes oligodendrocyte survival and oligodendrocyte progenitor differentiation via the Akt signaling pathway in rats with chronic cerebral hypoperfusion. Brain Res. 2014;1560:27-35
18. Luo Y, DeFranco DB. Opposing roles for ERK1/2 in neuronal oxidative toxicity: distinct mechanisms of ERK1/2 action at early versus late phases of oxidative stress. J Biol Chem. 2006;281:16436-16442
19. Subramaniam S, Unsicker K. ERK and cell death: ERK1/2 in neuronal death. FEBS J. 2010;277:22-29
20. Domercq M, Mato S, Soria FN, Sánchez-gómez MV, Alberdi E, Matute C. Zn2+-induced ERK activation mediates PARP-1-dependent ischemic-reoxygenation damage to oligodendrocytes. Glia. 2013;61:383-393
21. Bi J, Jiang B, Hao S, Zhang A, Dong Y, Jiang T. et al. Catalpol attenuates nitric oxide increase via ERK signaling pathways induced by rotenone in mesencephalic neurons. Neurochem Int. 2009;54:264-270
22. Niu J, Mei F, Li N, Wang H, Li X, Kong J. et al. Haloperidol promotes proliferation but inhibits differentiation in rat oligodendrocyte progenitor cell cultures. Biochem Cell Biol. 2010;88:611-620
23. Back SA, Riddle A, McClure MM. Maturation-dependent vulnerability of perinatal white matter in premature birth. Stroke. 2007;38:724-730
24. Schmitz T, Endesfelder S, Chew LJ, Zaak I, Bührer C. Minocycline protects oligodendroglial precursor cells against injury caused by oxygen-glucose deprivation. J Neurosci Res. 2012;90:933-944
25. Toninello A, Salvi M, Colombo L. The membrane permeability transition in liver mitochondria of the great green goby Zosterisessor ophiocephalus (Pallas). J Exp Biol. 2000;203:3425-3434
26. Javadov S, Karmazyn M, Escobales N. Mitochondrial permeability transition pore opening as a promising therapeutic target in cardiac diseases. J Pharmacol Exp Ther. 2009;330:670-678
27. Volpe JJ. Brain injury in premature infants: a complex amalgam of destructive and developmental disturbances. Lancet Neurol. 2009;8:110-124
28. Cengiz P, Uluc K, Kendigelen P, Akture E, Hutchinson E, Song C. et al. Chronic neurological deficits in mice after perinatal hypoxia and ischemia correlate with hemispheric tissue loss and white matter injury detected by MRI. Dev Neurosci. 2011;33:270-279
29. van der Kooij MA, Groenendaal F, Kavelaars A, Heijnen CJ, van Bel F. Neuroprotective properties and mechanisms of erythropoietin in in vitro and in vivo experimental models for hypoxia/ischemia. Brain Res Rev. 2008;59:22-33
30. French HM, Reid M, Mamontov P, Simmons RA, Grinspan JB. Oxidative stress disrupts oligodendrocyte maturation. J Neurosci Res. 2009;87:3076-3087
31. Liu Y, Silverstein FS, Skoff R, Barks JD. Hypoxic-ischemic oligodendroglial injury in neonatal rat brain. Pediatr Res. 2002;51:25-33
32. Blomgren K, Hallin U, Andersson AL, Puka-Sundvall M, Bahr BA, McRae A. et al. Calpastatin is up-regulated in response to hypoxia and is a suicide substrate to calpain after neonatal cerebral hypoxia-ischemia. J Biol Chem. 1999;274:14046-14052
33. Fulda S, Gorman AM, Hori O, Samali A. Cellular stress responses: cell survival and cell death. Int J Cell Biol. 2010;2010:214074
34. Nohl H, Gille L, Staniek K. Intracellular generation of reactive oxygen species by mitochondria. Biochem Pharmacol. 2005;69:719-723
35. Zhang XL, Jiang B, Li ZB, Hao S, An LJ. Catalpol ameliorates cognition deficits and attenuates oxidative damage in the brain of senescent mice induced by D-galactose. Pharmacol Biochem Behav. 2007;88:64-72
36. McConkey DJ, Orrenius S. The role of calcium in the regulation of apoptosis. Biochem Biophys Res Commun. 1997;239:357-366
37. Berridge MJ, Bootman MD, Roderick HL. Calcium signalling: dynamics, homeostasis and remodelling. Nat Rev Mol Cell Biol. 2003;4:517-529
38. Clapham DE. Calcium signaling. Cell. 2007;131:1047-1058
39. Domercq M, Perez-Samartin A, Aparicio D, Alberdi E, Pampliega O, Matute C. P2X7 receptors mediate ischemic damage to oligodendrocytes. Glia. 2010;58:730-740
40. Orrenius S, Zhivotovsky B, Nicotera P. Regulation of cell death: the calcium-apoptosis link. Nat Rev Mol Cell Biol. 2003;4:552-565
41. Dinicola S, Mariggiò MA, Morabito C, Guarnieri S, Cucina A, Pasqualato A. et al. Grape seed extract triggers apoptosis in Caco-2 human colon cancer cells through reactive oxygen species and calcium increase: extracellular signal-regulated kinase involvement. Br J Nutr. 2013;110:797-809
42. Ulbrich F, Kaufmann KB, Coburn M, Lagrèze WA, Roesslein M, Biermann J. et al. Neuroprotective effects of argon are mediated via an ERK-1/2 dependent regulation of heme-oxygenase-1 in retinal ganglion cells. J Neurochem. 2015;134:717-727
43. Wang JQ, Fibuch EE, Mao L. Regulation of mitogen-activated protein kinases by glutamate receptors. J Neurochem. 2007;100:1-11
44. Xu B, Chen S, Luo Y, Chen Z, Liu L, Zhou H. et al. Calcium signaling is involved in cadmium-induced neuronal apoptosis via induction of reactive oxygen species and activation of MAPK/mTOR network. PLoS One. 2011;6:e19052
45. Cohen-Armon M. PARP-1 activation in the ERK signaling pathway. Trends Pharmacol Sci. 2007;28:556-560
46. Wang Y, Dawson VL, Dawson TM. Poly (ADP-ribose) signals to mitochondrial AIF: a key event in parthanatos. Exp Neurol. 2009;218:193-202
47. Wang S, Yang X, Lin Y, Qiu X, Li H, Zhao X. et al. Cellular NAD depletion and decline of SIRT1 activity play critical roles in PARP-1-mediated acute epileptic neuronal death in vitro. Brain Res. 2013;1535:14-23
48. Veto S, Acs P, Bauer J, Lassmann H, Berente Z, Setalo G Jr. et al. Inhibiting poly-(ADP-ribose) polymerase: a potential therapy against oligodendrocyte death. Brain. 2010;133:822-834
49. Wu J, Ohlsson M, Warner EA, Loo KK, Hoang TX, Voskuhl RR. et al. Glial reactions and degeneration of myelinated processes in spinal cord gray matter in chronic experimental autoimmune encephalomyelitis. Neuroscience. 2008;156:586-596
Author contact
![]() Corresponding author: lihongliedu.cn.
Corresponding author: lihongliedu.cn.