Impact Factor ISSN: 1449-2288
- Issue 12; 2026
- Issue 11; 2026
- Issue 10; 2026
- Issue 9; 2026
- Issue 8; 2026
- Volume 22; 2026
- Past Issues
- Advance Articles
- Editorial Board
- Cover Images
- Index & Coverage
- Cover Suggestion
- Special Issues
Introduction
Materials and Methods
Results
Discussion
Supplementary Material
Acknowledgements
References

 Global reach, higher impact
Int J Biol Sci 2017; 13(1):32-45. doi:10.7150/ijbs.16287 This issue Cite
Research Paper
Deformed Skull Morphology Is Caused by the Combined Effects of the Maldevelopment of Calvarias, Cranial Base and Brain in FGFR2-P253R Mice Mimicking Human Apert Syndrome
Fengtao Luo†, Yangli Xie†, Wei Xu, Junlan Huang, Siru Zhou, Zuqiang Wang, Xiaoqing Luo, Mi Liu, Lin Chen ![]() , Xiaolan Du
, Xiaolan Du ![]()
Department of Rehabilitation Medicine, Center of Bone Metabolism and Repair, State Key Laboratory of Trauma, Burns and Combined Injury, Trauma Center, Research Institute of Surgery, Daping Hospital, Third Military Medical University, Chongqing 400042, China.
† The first two authors contributed equally to this work.
Received 2016-5-25; Accepted 2016-9-24; Published 2017-1-1
Abstract

Apert syndrome (AS) is a common genetic syndrome in humans characterized with craniosynostosis. Apert patients and mouse models showed abnormalities in sutures, cranial base and brain, that may all be involved in the pathogenesis of skull malformation of Apert syndrome. To distinguish the differential roles of these components of head in the pathogenesis of the abnormal skull morphology of AS, we generated mouse strains specifically expressing mutant FGFR2 in chondrocytes, osteoblasts, and progenitor cells of central nervous system (CNS) by crossing Fgfr2+/P253R-Neo mice with Col2a1-Cre, Osteocalcin-Cre (OC-Cre), and Nestin-Cre mice, respectively. We then quantitatively analyzed the skull and brain morphology of these mutant mice by micro-CT and micro-MRI using Euclidean distance matrix analysis (EDMA). Skulls of Col2a1-Fgfr2+/P253R mice showed Apert syndrome-like dysmorphology, such as shortened skull dimensions along the rostrocaudal axis, shortened nasal bone, and evidently advanced ossification of cranial base synchondroses. The OC-Fgfr2+/P253R mice showed malformation in face at 8-week stage. Nestin-Fgfr2+/P253R mice exhibited increased dorsoventral height and rostrocaudal length on the caudal skull and brain at 8 weeks. Our study indicates that the abnormal skull morphology of AS is caused by the combined effects of the maldevelopment in calvarias, cranial base, and brain tissue. These findings further deepen our knowledge about the pathogenesis of the abnormal skull morphology of AS, and provide new clues for the further analyses of skull phenotypes and clinical management of AS.
Keywords: Apert syndrome, Fgfr2+/P253R mouse, Tissue specific activation, Skull morphology, Euclidean distance matrix analysis.
Introduction
Skull is composed of calvarial bones, craniofacial bones and cranial base. They are formed through distinct development modes[1]. The calvarial bones are formed through intramembranous ossification, in which the mesenchymal precursor cells between the opposing osteogenic fronts of sutures directly differentiate into bone-forming osteoblasts driving the growth of calvarial bones. Bones of the cranial base are formed through endochondral ossification. Endochondral ossification of the synchondroses is responsible for the growth and expansion of cranial base[2].
In the early development of skulls, the calvarial sutures remain open, holding the calvarial bones loosely together, which allows the coordinated development of the expanding skull and the underlying developing brain[3]. Craniosynostosis is characterized by premature fusion of one or more calvarial sutures. To date, craniosynostoses have been found in over 100 distinct genetic syndromes, occurring in approximately 1 in 3000 individuals[4]. Apert syndrome (AS), a genetic craniosynostosis, is caused by one of two missense mutations in adjacent amino acids, Ser252Trp(S252W) and Pro253Arg(P253R), of fibroblast growth factor receptor 2 (FGFR2) [5, 6]. AS is characterized with precocious closure of cranial sutures, midfacial hypoplasia and syndactyly of hands and feet[7, 8]. Additionally, patients with AS usually have raised intracranial pressure and mental retardation[9], whether it's related to the abnormal skull development is not clear presently.
We and other groups have previously generated Fgfr2+⁄S252W and Fgfr2+⁄P253R mouse models mimicking human AS using knock-in approach[10-13]. Generally, these mouse models showed global skull phenotypes similar to that in Apert patients including dome-shaped skulls, underdeveloped midface, premature fusion of cranial base synchondrosis, malformed brain and brachycephaly, [10, 14] etc. Quantitative analyses revealed that the skulls of Fgfr2+⁄P253R mice were shortened along the rostrocaudal (RC) direction, especially in their face[15], but the breadth along the mediolateral (ML) axis of the frontal bone and the neurocranium were increased [16].
Although we have detailed description about the skull morphology of AS, the reasons for the characteristic skull shape of AS are not fully clarified presently. Head as an integrated structure unit is mainly composed of brain and skull bone which includes calvarias, craniofacial bones and cranial base. Normal development of skull requires mechanisms to ensure a proper coordination among the rates of suture closure, cranial base fusion and cerebral development. Theoretically, maldevelopment in anyone of these three parts can be involved in the pathogenesis of the abnormal skull shape in AS.
It's generally considered that premature fusion of sutures is the original reason for the abnormal skull shape of CS patients. The premature closure of coronal suture is most commonly exhibited in AS patients, which is also observed in the mouse models mimic AS[10-13]. Individuals with AS are reported to have cartilaginous abnormalities in their cranial base, including premature fusion of the spheno-ethmoidal synchondrosis and the spheno-occipital synchondrosis, suggesting an important role of endochondral ossification in the skull malformation of AS [17, 18]. Similarly, dysmorphology of the cranial base is one of the significant skeletal abnormalities in mice with ubiquitous or chondrocyte-specific expression of FGFR2 with Pro253Arg mutation[19]. Therefore, it is speculated that the disturbed cartilaginous development may also play an important role in the malformation of skulls of AS patients or AS mouse models.
Besides skull maldevelopment, AS patients also have abnormalities in nervous system such as mental retardation and brain dysmorphology [20-23].There are controversies about the reasons for the abnormal brain morphology of AS patients. Brain malformation in AS is generally considered as the result, at least in part, of the premature fusion of cranial sutures [24, 25]. Aldridge et al, however, by finding that the brain dysmorphology was developed before the fusion of calvarial sutures of AS mice, proposed that brain is primarily affected, rather than secondarily responding to skull dysmorphogenesis in AS mouse model [14].
To date, the pathogenesis of the skull abnormalities of AS is still not fully clarified. It is important to understand the accurate role of these individual composing parts of head in the malformation of AS skulls. Since in previous studies[10-13], the mutant FGFR2 is ubiquitously expressed in the mutant mice, we cannot clearly dissect the direct role of mutant FGFR2 in the abnormal development of calvarias, brain and cranial base. For example, it is difficult to distinguish the direct and/or indirect role of mutant FGFR2 in brain maldevelopment, and to know whether the abnormal brain development is the cause or result of the skull malformation.
In this study, we used Cre/loxp approach to obtain mutant mice with expression of activated FGFR2 (Pro253Arg) in chondrocytes, osteoblasts, and CNS progenitor cells, and quantitatively analyzed the skull morphology of these mutants at postnatal 4- and 8-week using three-dimensional micro-CT and morphometric assay. We also analyzed the brain morphology of mice with specific activation of FGFR2 in CNS progenitors (Nestin-253) at 8 weeks using micro-MRI based EDMA. We found that skulls of all three mutant strains and the brain of Nestin-253 mice are maldeveloped. Our data thus suggest that abnormal development in calvarias, cranial base and brain are all involved in the pathogenesis of the deformed skulls in AS mice, and there is direct effect of mutant FGFR2 on brain development. This study provides new insight for the mechanistic understanding and clinical management of Apert syndrome.
Materials and Methods
Mice and preparation of skeletons
Fgfr2+⁄P253R-neo mice were kindly provided by Dr Chuxia Deng of NIDDK. Col2a1-Cre [26]and OC-Cre[27] mice were kindly provided by Dr Xiao Yang of the Academy of Military Medical Sciences of China. Nestin-Cre mice were purchased from Jackson laboratory. All mice were inbred to C57BL/6J mice. Col2a1-Fgfr2+⁄P253R (Col2a1-253), OC-Fgfr2+⁄P253R (OC-253) and Nestin-Fgfr2+⁄P253R (Nestin-253) mice were generated by crossing male offspring of Fgfr2+⁄P253R-neo and female offspring of Col2a1-Cre, OC-Cre and Nestin-Cre mice respectively. All procedures were approved by the Institutional Animal Care and Use Committee of Daping Hospital. Mice were genotyped using PCR method. 4-week-old and 8-week-old mice with tissue-specific activating Fgfr2+⁄P253R and wild-type (WT) mice from the same litter were used. After being sacrificed, the mouse skulls were skinned and fixed in 70% ethanol as described previously [10].
Skeletal analysis and histology
Skulls were subjected to high-resolution X-ray examination using Faxitron MX20. The whole-skeleton staining with Alizarin red and Alcian blue was performed as described [28]. For histological analysis, the calvarias of mutant and control mice were fixed in 4% paraformaldehyde in 0.01M PBS (pH 7.4), decalcified in 15% EDTA (pH 7.4) and embedded in paraffin as described [29]. Six micrometer-thick sections were sliced for sutures and staining with Hematoxylin and Eosin (H&E).
Micro-computed tomography, Magnetic resonance image procedures and collection of landmark data
The skull samples were scanned with micro-CT (VivaCT40, Scanco Medical AG, Switzerland). For 4-week and 8-week old skulls, Image acquisition was performed at 70 kV and 114 μA. For d3 skulls, the 45 kV and 177 μA was used for μCT scan. Two-dimensional images were used to generate three-dimensional reconstructions. At same stage, every measurement used the same filtering and segmentation values to obtain three-dimensional images.
For EDMA analysis, according to Richtsmeier's method [30], three-dimensional coordinate locations of 27 biologically relevant landmarks located on the cranial were recorded from three-dimensional CT images of skulls of 4-week-old (n≥8, per genotype) and 8-week-old Col2a1-253, OC-253, Nestin-253 and their littermates (n≥8, per genotype). The measurement of skull lengths were performed from 3D reconstructed skull images (n≥6, per genotype). Frontal bones, parietal bones and interparietal bone were selected as region of interest (VOI) for analysis of calvarial bone mass by μCT Evolution Program V5.0 software.
Magnetic resonance images (MRI) on heads of 8-week-old Nestin-Fgfr2+⁄P253R mice (N=6) and their unaffected littermates (N=8) were imaged using a 7.0T Bruker (Ettlingen, Germany) BioSpec 70/20USR magnetic resonance microimaging system (Department of Radiology, Daping hospital, Third Military Medical University, Chongqing, China). Dicom files of the MRI images were collected and sent for 3D reconstruction of brain in OpenVMS system in micro-CT (VivaCT40, Scanco Medical AG, Switzerland). Refers to previous method [31, 32], 11 landmark coordinate data were collected on the brain and employed to EDMA analysis (Table 1, Fig 5).
Part of linear distances ratios of FDM for the comparison of face and neurocranium of mutant (MT) and wild-type (WT) skulls at 4 and 8 weeks.
| Landmarks | Col2a1-253 MT to WT | OC-253 MT to WT | Nestin-253 MT to WT | |||||
|---|---|---|---|---|---|---|---|---|
| 4w | 8w | 4w | 8w | 4w | 8w | |||
| 1 and 2 | 0.864 | 0.875 | 1.029 | 0.922 | 0.900 | 1.027 | ||
| 2 and 3 | 0.941 | 0.973 | 0.996 | 0.955 | 1.014 | 1.023 | ||
| 9 and 10 20 and 21 | 0.861 | 0.908 | 1.043 | 0.885 | 0.912 | 0.999 | ||
| 0.834 | 0.923 | 1.042 | 0.898 | 0.980 | 1.031 | |||
| 7 and 8 18 and 19 | 0.907 | 0.888 | 0.992 | 0.928 | 0.977 | 1.069 | ||
| 0.921 | 0.868 | 1.024 | 0.935 | 0.985 | 1.072 | |||
| 8 and 13 19 and 24 | 0.925 | 0.913 | 1.030 | 0.984 | 1.001 | 0.998 | ||
| 0.933 | 0.897 | 1.023 | 0.967 | 0.984 | 0.976 | |||
| 11 and 14 22 and 25 | 0.788 | 0.907 | 0.981 | 0.977 | 0.952 | 1.004 | ||
| 0.710 | 0.864 | 0.982 | 0.894 | 0.949 | 0.984 | |||
| 8 and 19 | 0.922 | 0.981 | 1.003 | 0.976 | 1.005 | 1.039 | ||
| 9 and 20 | 0.976 | 0.928 | 0.961 | 0.938 | 1.017 | 1.039 | ||
| 10 and 21 | 1.094 | 0.982 | 0.993 | 0.997 | 1.019 | 1.049 | ||
| 11 and 22 | 1.112 | 0.946 | 0.998 | 0.926 | 0.979 | 1.017 | ||
| 12 and 23 | 1.054 | 1.042 | 0.992 | 1.032 | 1.035 | 1.027 | ||
| 13 and 24 | 0.987 | 1.010 | 1.005 | 0.989 | 1.013 | 1.001 | ||
| 14 and 25 3 and 4 | 0.963 1.071 | 0.965 1.047 | 1.001 1.024 | 0.936 0.982 | 0.970 0.986 | 1.003 0.973 | ||
| 3 and 5 | 1.007 | 1.033 | 0.994 | 1.006 | 1.000 | 0.971 | ||
| 4 and 5 | 0.980 | 1.021 | 0.962 | 1.038 | 1.010 | 0.96 | ||
| 15 and 16 26 and 27 | 0.898 | 1.014 | 0.940 | 0.940 | 1.161 | 1.216 | ||
| 0.905 | 0.900 | 0.924 | 0.946 | 1.064 | 1.094 | |||
| 5 and 13 5 and 24 | 0.936 | 0.934 | 1.015 | 0.939 | 0.989 | 1.005 | ||
| 0.933 | 0.937 | 1.010 | 0.937 | 0.982 | 1.001 | |||
| 15 and 26 | 1.032 | 1.012 | 0.991 | 0.986 | 0.991 | 1.006 | ||
| 16 and 27 | 1.055 | 1.031 | 0.998 | 0.996 | 1.006 | 1.010 | ||
| 3 and 15 3 and 26 | 1.031 | 1.031 | 0.961 | 1.003 | 1.009 | 1.005 | ||
| 1.016 | 1.032 | 1.028 | 0.976 | 0.965 | 1.002 | |||
| 4 and 16 4 and 27 | 1.044 | 0.991 | 0.988 | 1.018 | 1.036 | 1.061 | ||
| 1.044 | 1.012 | 0.995 | 1.027 | 1.000 | 1.042 | |||
Morphometric methods
EDMA is a method for quantitative analyses of the form and growth characteristics in the geometric morphology [33, 34]. The collected coordinate data were subjected to WinEDMA software to calculate the FDM (Form Differences Matrix) between tissue-specific Col2a1-Fgfr2+⁄P253R, OC-Fgfr2+⁄P253R, Nestin-Fgfr2+⁄P253R mice and their littermate controls as described in Richtsmeier et al. report [30].
Statistical analysis
Data were evaluated statistically in SPSS18.0. Statistics were evaluated using Student's t-test, P-values were considered significant at *P<0.05, **P<0.01.
Results
Specific expression of Fgfr2-P253R in chondrocytes leads to Apert syndrome-like dysmorphology in mice
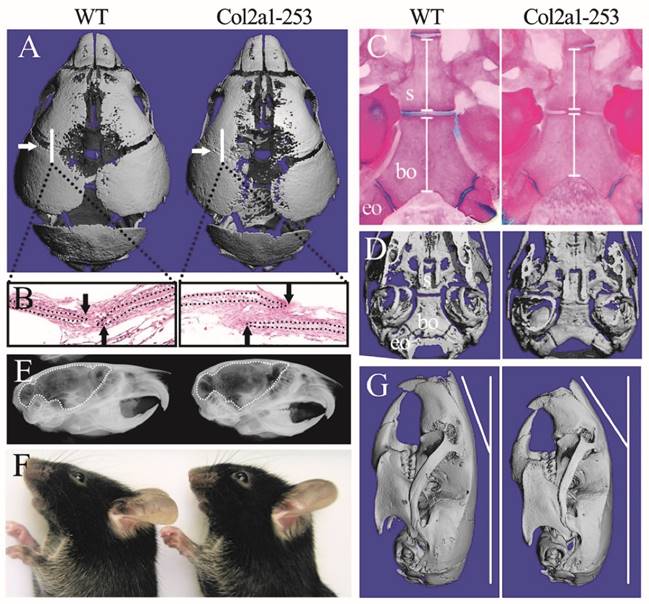
In previous reports, Apert syndrome mouse models with ubiquitous expression of mutant FGFR2 generated using EIIa-Cre (such as EIIa-Fgfr2+/P253R, abbreviated as EIIa-253) exhibited smaller body size, shorter cranial dimensions along the rostrocaudal axis and broader breadth of the frontal bone than wild-type littermates [10, 12, 16]. In this study, Col2a1-253 mice showed normal life span with normal body size and AS-like skull dysmorphology compared with wild-type mice. Micro-computerized tomography (micro-CT) scanning of skulls and histological analysis of sutures revealed the precocious closure of coronal sutures in day 3 Col2a1-253 mice (Fig. 1A, B). Besides, micro-CT examination revealed widened metopic and sagittal suture in Col2a1-253 mice (Fig. 1A). In cranial base region, day 3 Col2a1-253 mice exhibited shortened spheno-occipital synchondroses and basioccipital bone (Supplemental Figure 1A-C). By the age of day 14, Col2a1-253 mice also showed growth disturbance in the cranial base, including shortened basioccipital and basisphenoid bone, premature fusion of spheno-occipital synchondroses, presphenoid-basissphenoid synchondroses and the intersphenoidal synchondroses (Fig. 1C, D). From X-ray images, 4-week old Col2a1-253 mice had rostrocaudally shortened, but dorsoventrally increased cranial cavity compared with their littermates, indicating Col2a1-253 mice had dorsoventrally increased, and rostrocaudally shortened brain (Fig. 1E). From outside view, Col2a1-253 mice showed abnormal nasal bone at 8 weeks of age (Fig. 1F, G). Shortened vertebral column and long bones, syndactyly and phalangeal deformation were not observed in Col2a1-253 mice, although these malformations were existed in EIIa-253 mice (data not show).
Col2a1-253 mice exhibited deformed skull compared with wild-type (WT) mice. 3D reconstruction of 3-day-old skull (A) and H&E staining of sutures (B) showed the precocious closure of coronal sutures in Col2a1-253 mice (white arrows indicate coronal sutures; black arrows indicate osteogenic fronts). Mutant mice showed premature fusion of spheno-occipital synchondroses, intersphenoidal synchondroses, shortened basioccipital and basisphenoid bone (white bars) from Alizarin red and Alcian blue staining (C) and 3D images (D)of cranial base at d14. X-ray images showed 4-week-old Col2a1-253 mice had shortened brain (indicated by dotted line) (E). 8-week-old skull from photograph (F) and 3D reconstruction (G) of Col2a1-253 and wild-type mice revealed that mutant mice had bended nasal bone. s: basisphenoid, bo: basioccipital bone, eo: exo-occipital bone.
Specific expression of Fgfr2-P253R in osteoblasts results in skull malformation in mice
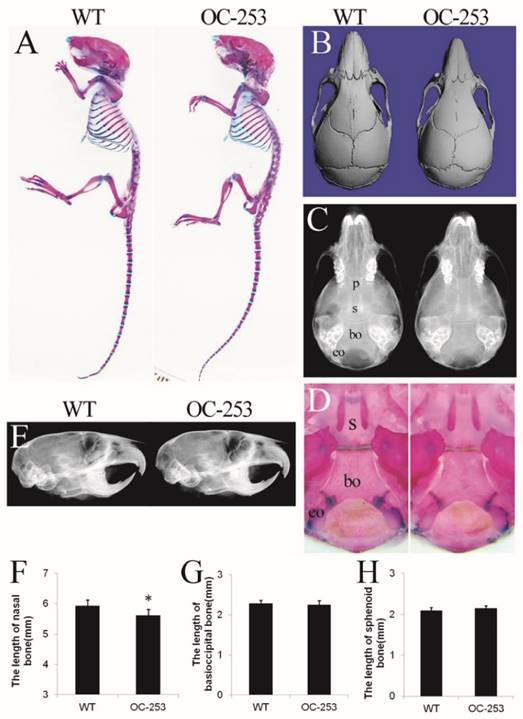
The major abnormality of Apert mice is located on sutures, which is mainly formed through osteoblastogenesis. Genes driven by osteocalcin (OC) promoter are mainly expressed in mature osteoblasts, thus it was speculated that OC-253 mice would show significant malformation on skeleton, especially in calvarias. However, OC-253 mice showed normal body size and life span compared with wild type mice (Fig. 2A). We observed the mice at day 14, 4 and 8 weeks by radiographic images, Alizarin red and Alcian blue staining and histology. By measurement of skull lengths based on three-dimensional images, we found that the nasal bone were mildly shortened along the rostrocaudal axis at 8-week OC-253 mice (Fig. 2B, F. p<0.05). No other parameters including cranial cavity, coronal suture, cranial base synchondroses, basioccipital bone and sphenoid bone were not significantly changed (Fig. 2C-E, G-H).
The cranial morphologies of OC-253 and their littermate mice. Alizarin red and Alcian blue staining showed OC-253 mice (4-week-old) had no significant changes in overall skeleton size(A). Measurement of skull lengths based on three-dimensional images showed 8-week-old OC-253 mice had shorter nasal bone along the rostrocaudal axis compared to WT mice (B, F). Radiographic images and Alizarin red and Alcian blue staining revealed normal growth of synchondroses at d14 OC-253 mice (C, D). The cranial cavity of mutant mice was normal at 4 weeks after birth (E). The lengths of basioccipital bone and sphenoid bone were not significantly changed (G, H). p: presphenoid, s: basisphenoid, bo: basioccipital bone, eo: exo-occipital bone. (Student's t-test, *P<0.05).
Nestin-253 mice exhibit abnormal brains and skulls
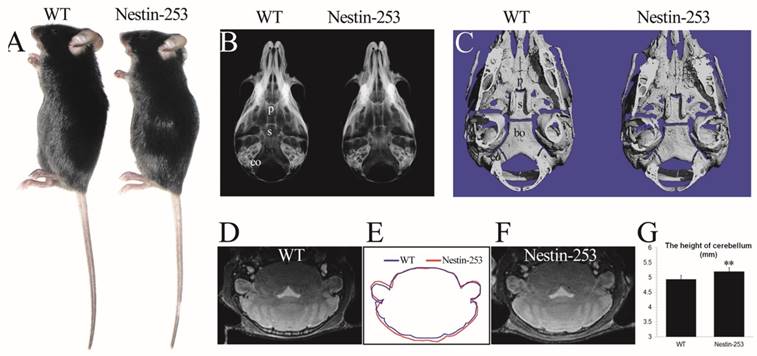
We used Nestin-Cre to activate the mutant FGFR2 in CNS progenitor cells [35]. Nestin-253 mice were normally survived more than 12 months with normal body size compared with WT mice (Fig. 3A). No abnormal development of cranial base was detected from X-ray and micro-CT analyses (Fig. 3B, C). We analyzed the brain morphology of 8-week old Nestin-253 mice using MRI scanning, and found that mutant mice exhibited increased dorsoventral height of caudal brain (Fig. 3D-F). Quantitative analysis of MRI images found that the dorsoventral height of caudal brain was increased by 5.3% in mutant mice (p<0.01, Fig. 3G), and other parts of Nestin-253 brain exhibited normal morphology.
Nestin-253 mice had abnormal brain compared with their littermates. The body size of Nestin-253 mice was not changed in comparison with sex-matched WT mice (4 weeks after birth) (A). Normal development of cranial bases were indicated by X-ray and micro-CT images at the age of d16 (B) and d14 (C). The MRI images of brain in WT (D) and Nestin-253 (F) and measurement on MRI (G) indicated the longer in height on caudal of brain in Nestin-253 mice than controls (E). p: presphenoid, s: basisphenoid, bo: basioccipital bone, eo: exo-occipital bone. (Student's t-test, **P<0.01).
The differential effect of tissue-specific activation of FGFR2 on the gross skull morphology of mice
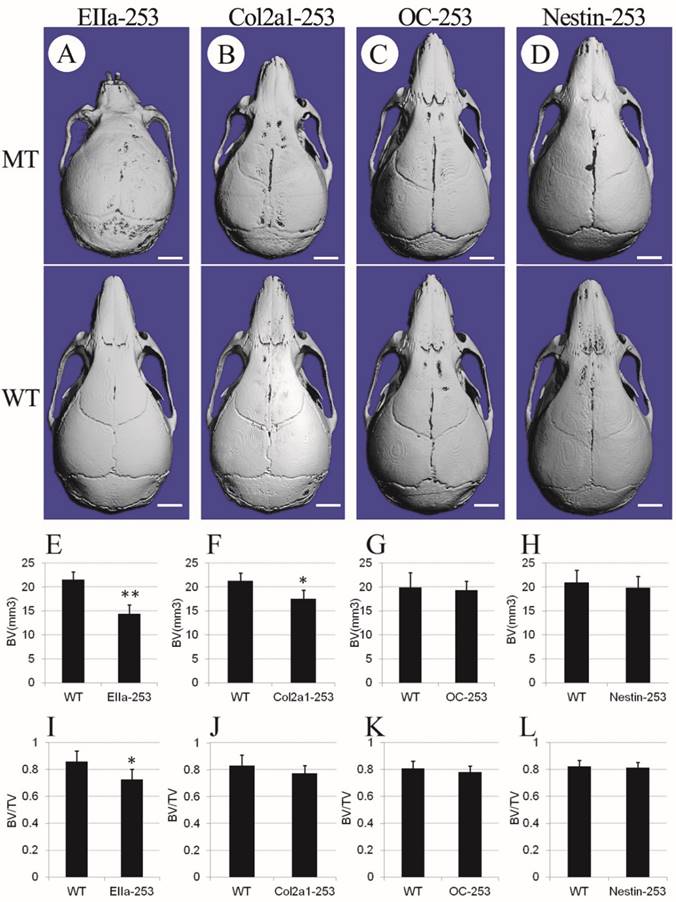
To further clarify the distinct role of the misshaped calvarias, cranial base, and brain in the maldevelopment of AS skulls, we observed the gross skull morphology of Col2a1-253, OC-253, Nestin-253 and EIIa-253 mice at postnatal 4 weeks. From the superior view of the micro-CT based 3D reconstructed skulls, Col2a1-253 skulls showed similar changes to that in EIIa-253 mice in rostrocaudal axis(i.e. shortened length at 4 weeks after birth), but the severity of shortening was mild compared with EIIa-253 mice (Fig. 4B). EIIa-253 mice had typical “dome-shaped” calvarias (Fig. 4A), which is mild in Col2a1-253 mice. In OC-253 mice, the skulls showed no significant gross dysmorphology at 4 weeks (Fig. 4C). The skulls of Nestin-253 mice showed mildly shortened nasal bone compared with their wild-type littermates, whereas no remarkable difference in breadth was observed (Fig. 4D). By measuring calvarial bone mass of mutant mice, we found that bone volume (BV, p<0.01) and bone volume ratio (BV/TV, p<0.05) of EIIa-253 calvarias were decreased compared with WT littermates (Fig. 4E, I). Col2a1-253 calvarias showed similar decrease on BV (p<0.05) due to the rostrocaudally shorted skull, but no significantly change on BV/TV (Fig. 4F, J). OC-253 and Nestin-253 mice have not significant change on bone volume (BV) or bone volume ratio (BV/TV) (Fig. 4G, H, K, L).
Comparison of cranial morphologies and calvarial bone mass among 4-week-old mutant mice. Cranial morphologies of EIIa-253 (A), Col2a1-253 (B), OC-253 (C) and Nestin-253 (D) mice showed deformed skull in tissue-specific activated Fgfr2 mice. Measurement of calvarial bone mass showed that bone volume (BV) and bone volume ratio (BV/TV) of EIIa-253 calvarias were decreased (E, I). Col2a1-253 calvarias exhibited similarly decreased BV, but no significantly change on BV/TV (F, J). OC-253 and Nestin-253 mice have not significant change on bone volume (BV) or bone volume ratio (BV/TV) (G, H, K, L). MT: Fgfr2+⁄ P253R mice; WT: wild-type. (Student's t-test, **P<0.01, *P<0.05, White bar=2mm).
Based on above data, we found that Col2a1-253, OC-253, and Nestin-253 mice all exhibited characteristic skull dysmorphology associated with AS maldevelopment, but their malformation was less severe than that of EIIa-253 mice.
EDMA analysis of the skulls of Col2a1-253 mice
EDMA was employed to further quantitatively analyze the cranial morphology of Col2a1-253, OC-253 and Nestin-253 mice. We analyzed the changes in the shape of skulls and the dimensions of several major skull-forming bones of 4- and 8-week-old mutant mice and their corresponding wild-type mice using FDM analysis of the EDMA method.
According to FDM analysis, remarkable differences were revealed in the overall cranial shape of 4-week-old Col2a1-253 mice. Approximately 58% linear distances were shortened by over 5% (marked by blue lines), 33% distances exhibited ≤5% changes (not marked), and only 9% linear distances showed over 5% increases (broken red lines in Fig. 5-D, E, F). Eight-week-old Col2a1-253 mice, however, showed less malformation on skulls than 4-week-old Col2a1-253 mice. About 51% linear distances at 8-week stage showed a decrease over 5% (blue lines), 49% linear distances exhibited no significant changes (Fig. 5-G, H, I), and no linear distances showed a >5% increase.
The FDM analysis of 4-and 8-week-old Col2a1-253, OC-253 and Nestin-253 skulls. 27 landmarks on the mouse skull are presenting on schematic diagram (A-C). FDM analyses of 4-week-old (mutant: n=8; wt: n=9) and 8-week-old (mutant: n=13; wt: n=10) Col2a1-253 mice are present in D-I. From J to O represent FDM analyses in 4-week-old (mutant: n=12; wt: n=9) and 8-week-old (mutant: n=8; wt: n=8) OC-253 mice. From P to U are FDM analyses at 4-week-old (mutant: n=9; wt: n=9) and 8-week-old (mutant: n=8; wt: n=8) Nestin-253 mice. Blue lines show those linear distances that showed a decrease of over 5%. Broken red lines show linear distances with a >5% increase.
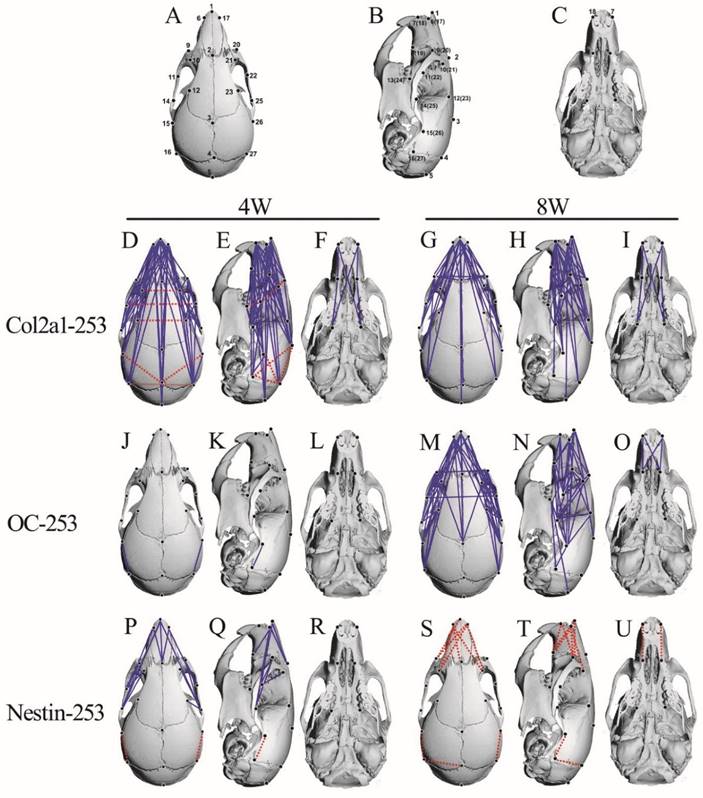
In 4-week stage, Col2a1-253 mice exhibited the most severe malformation on midfacial region (Table 1). The frontal processes of the maxilla (landmarks 9 and 10) in Col2a1-253 mice were also shortened by 13.9%, and the zygomatic bone (landmarks 11 and 14) was substantially shortened by 21.2%, indicating that the Col2a1-253 mice also had the characteristic shallow orbit regions of AS skulls. The distance of paired anterior zygoma (landmarks 11 and 22) was increased by 11.2%. The distance between two lacrimal bones (landmarks 10 and 21) was increased by 9.4%. The breadth of the frontal bone (landmarks 12 and 23) was mildly increased by 5.4%.The length of nasal bone (landmarks 1 and 2) exhibited a 13.6% decrease. The frontal bone (landmarks 2 and 3) showed a mild decrease (5.9%). The premaxilla (landmarks 7 and 8) and maxilla length (landmarks 8 and 13) were decreased by 9.3% and 7.5%, respectively. Along with mediolateral (ML) direction, the breadth of the anterior palate (landmarks 8 and 19) was decreased by 7.8%. In neurocranium region, the length of lateral neurocranium (between landmark 15 and 16) displayed a decrease of 10.2%, and the width of caudal neurocranium (between landmark 16 and 27) was increased by 5.5%. The linear distances between the intersection of interparietal and occipital bones at the midline and the posterior palate (landmarks 5 and 13) showed a decrease of 6.4%(Table 1). The linear distance between landmark 4 and 15 displayed a 5.9% increase, and the linear distance between landmark 4 and 26 was increased by 6.1%.
At the 8-week stage, the midfacial shape of Col2a1-253 mice were less severe than those in 4-week-old mice (Table 1). The frontal processes of the maxilla (landmarks 9 and 10) exhibited a 9.2% decrease. Compared to 4-week-old Col2a1-253 mice, the degree of shortening of maxilla (landmarks 8 and 13) and zygomatic bone (landmarks 11 and 14) of 8-week-old Col2a1-253 mice was substantially decreased, which had a 8.7% and 9.3% decrease, respectively. The distance of the paired frontal zygoma (landmarks 11 and 22) had a 5.4% decrease. The length of nasal bone (landmarks 1 and 2) showed a 12.5% decrease. The premaxilla length (landmarks 7 and 8) also displayed a 11.2% reduction compared with their littermates. The paired frontal process of the maxilla (landmarks 9 and 20) was decreased by 7.2%. The distances between two lacrimal bones (landmarks 10 and 21) and the breadth of frontal bone (landmarks 12 and 23) were relieved to no significant changes (Table 1).
In 8-week-old Col2a1-253 mice, the neurocranium were not significantly reduced along the RC axis and had no significant change along the ML axis (Table 3). The linear distances between the intersection of interparietal and occipital bones at the midline and the posterior palate (landmarks 5 and 13) showed a decrease of 6.6%. (Table 1).
From EDMA analysis, we found that besides the ocular hypertelorism, the lengths were reduced in nasal bone, maxillae and zygoma in Col2a1-253 mice at 4-week stage, whereas the severity of deformity was decreased in RC direction at 8-week-old. Col2a1-253 mice at 4-week-old stage had decreased neurocranium length along the RC direction. Nevertheless, there were no significant change in neurocranium region of 8-week-old Col2a1-253 mice, indicating that malformation was relieved at 8-week stage. These data indicate that specific expression of FGFR2-P253R in cartilage alone led to head-shorten malformation phenotypes similar to that in Apert mice (EIIa-253), although the severity of malformation was milder.
EDMA analysis of the skulls of OC-253 mice
At postnatal age of 4 weeks, OC-253 mice showed grossly normal skull morphology except that the distances of landmark 15 to 16 and 26 to 27 were mildly decreased by 6% and 7.6%, respectively (Fig. 5-J, K, L; Table 1). In 8-week-old OC-253 mice, EDMA analysis showed that about 30% linear distances exhibited a ≤5% change (blue lines. Fig. 5-M, N, Q; Table 1). The changed distances were mainly located on facial bones. The length of nasal bone (landmarks 1 and 2) was shortened by 7.8%. The length of premaxilla (landmarks 7 and 8) was decreased by 7.2%. At the orbit regions, the distance was significantly shortened along RC axis, whereas no significant changes were found along the ML axis. The frontal process of the maxilla (landmarks 9 and 10) was shortened by 11.5%. Along the ML axis, the width between landmarks 9 to 20 and landmarks 11 to 22 was decreased by 6.2% and 7.4%, respectively. In neurocranium region, the distance between landmarks 14 and 25 had a 6.4% decrease. The distances between landmark 5 and 13, 5 and 24 were decreased by 6.1% and 6.3%, respectively (Table 1). From the FDM analysis, OC-253 mice showed mildly decreased skull length along the rostrocaudal axis at 8 weeks stage.
EDMA analysis of brains and skulls of Nestin-253 mice
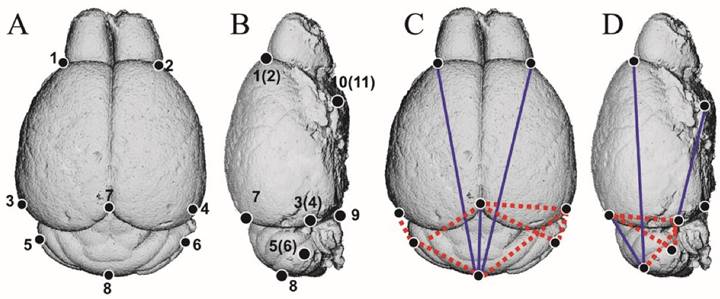
To clarify the direct effect of mutant FGFR2 on brain development of Apert mice, we analyzed the brain morphology of Nestin-253 mice using 3D-reconstructed MRI image. 11 landmarks were defined on brain and 3D coordinates of 8 weeks postnatal brains were employed to do EDMA analysis (Table 2; Fig. 6A, B). The results showed that, along the RC direction, the linear distance of landmarks 1 and 8 was decreased by 9.1%. The linear distance from landmarks 7 to 8 and from landmarks 4 to 11 showed 16.5% and 7.4% decrease, respectively, whereas the length of landmarks 3 to 5 (4 and 6) had a 10% increase. Along the mediolateral direction, however, there was no significant increase or decrease on the distance between landmarks 1 and 2, 3 and 4 or other breadth. Along the dorsoventral direction, the distance between landmarks 3 and 7 (4 and 7) were increased by 5.5% on average. The distance of the landmarks 5 and 7(6 and 7) were increased by 7.1% (Table 3; Fig. 6C, D). Thus, the rostrocaudal length and dorsoventral height on caudal brain were increased in the Nestin-253 mice.
The definition of brain landmarks.
| Brain Landmark(s) | Definition |
|---|---|
| 1 and 2 | Most superolateral point of intersection of olfactory bulb with anterior frontal lobe surface (bilateral) |
| 3 and 4 | Most caudolateral point on the occipital lobe surface (bilateral) |
| 5 and 6 | Most lateral point on the cerebellar surface (bilateral) |
| 7 | Most caudal point of intersection of cerebral hemispheres surface |
| 8 | Most caudal point on the cerebellar surface |
| 9 | Intersection of pons with most caudal aspect of the ventral cerebral surface |
| 10 and 11 | Origin of the middle cerebral artery from Circle of Willis on ventral cerebral surface (bilateral) |
Part of linear distances ratios of the form difference matrices (FDM) for the comparison of Nestin-253 with wild-type brain at 8 weeks.
| Landmarks | Nestin-253 |
|---|---|
| 1 and 2 | 0.985 |
| 4 and 11 | 0.926 |
| 3 and 4 | 1.019 |
| 3 and 7 (4 and 7) | 1.055 |
| 5 and 7 (6 and 7) | 1.071 |
| 1 and 3 | 0.994 |
| 1 and 8 | 0.909 |
| 3 and 5 (4 and 6) | 1.100 |
| 7 and 8 | 0.835 |
| 1 and 10 (2 and 11) | 1.043 |
| 7 and 9 | 1.024 |
The EDMA analysis of 3D-reconstructed brain of Nestin-253 mice. (A and B) The schematic diagram of 11 landmarks on mouse brain. (C and D) The FDM analysis of 8-week-old Nestin-253 brains (n=6) compared with WT littermates (n=8). Blue lines show those linear distances that showed a decrease of over 5%. Broken red lines show linear distances with a >5% increase.
As to skull morphology, at 4-week stage, about 5% linear distances were shortened by over 5% (blue lines in Fig. 5, P-R). However, the level of decrease was slight and no linear distance was shortened by over 10% (Table 1). For 8-week-old Nestin-253 mice, about 4% linear distances were increased by over 5% (Fig. 5, S-U, Table 1).
At 4 weeks, along RC axis, the length of nasal bone of Nestin-253 mice (landmarks 1 and 2) was decreased by 10%. Similarly, the linear distance between landmark 9 and 10 was decreased by 8.8%. The linear distances between landmark 15 and 16, 26 and 27 were increased by 16.1% and 6.4%, respectively (Table 1).
At the adult stage of 8 weeks, the length of nasal bone (landmarks 1 and 2) exhibited no significant changes. The linear distance of landmarks 7 to 8 was increased by 6.9%. The linear distance of landmarks 18 to 19 was increased by 7.2%. For the caudal part of skulls of Nestin-253 mice, the linear distances of landmarks 15 to 16 and 26 to 27 were increased by 21.6% and 9.4%, respectively. Although the linear distance of landmarks 4 to 27 had a <5% increase, the linear distance between landmark 4 and 16 was increased by 6.1%, however, the linear distance between landmark 16 and 27 was not significantly increased (Table 1), indicating that the dorsoventral height was increased slightly and the mediolateral breadth of this region was not affected by FGFR2-P253R mutation.
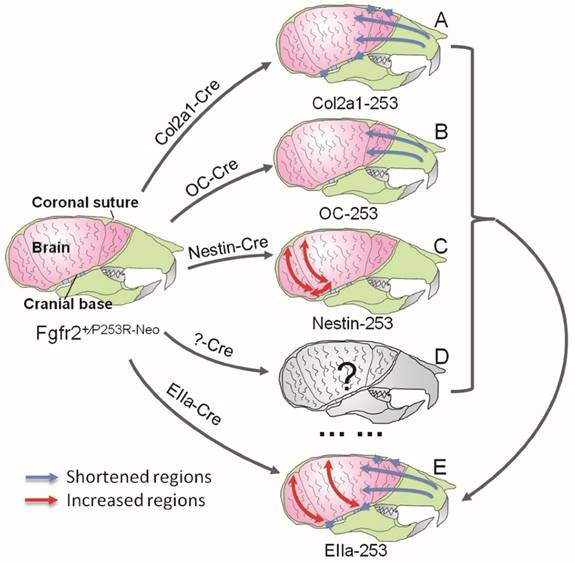
In Summary, quantitative EDMA analysis of the skulls and brain revealed that mutant FGFR2 in Col2a1 expressing cells mainly affected cranial base, sutures and midface (Fig. 7A). Mice with specific expression of mutant FGFR2 in osteoblasts (OC) showed mildly shortened face (Fig. 7B). Specific expression of mutant FGFR2 in nestin-expressing cells mainly led to increased rostrocaudal length and dorsoventral height of the caudal brain (Fig. 7C). All three mutant mouse stains with expression of mutant FGFR2 in specific tissue exhibited skull malformation, which indicates that mutant FGFR2 played direct role in maldevelopment of these tissues. Furthermore, it's noticed that the phenotypes of each mutant strain just partially resembled the skull malformation of EIIa-253 mice, suggesting that the malformation of specific tissues partially contributed to dysmorphogenesis of skull of AS mice (Fig. 7E)[16, 21, 36, 37], and that the maldevelopment of AS head is caused by the combined effects of abnormal development of calvarias, cranial base, brain and other tissues (Fig. 7D).
Schematic about the pathogenesis of the skull deformation in Apert mice. Mutant FGFR2 in Col2a1 expressing cells mainly affects coronal sutures, midface and cranial base(A). Mice with specific expression of mutant FGFR2 in osteoblasts (OC) show mildly shortened rostrocaudal length in the face(B). Specific expression of mutant FGFR2 in nestin-expressing cells mainly leads to increased rostrocaudal length and dorsoventral height of the caudal brain(C). All three mutant mouse stains with expression of mutant FGFR2 in specific tissue exhibit skull malformation, which indicates that mutant FGFR2 plays direct role in the maldevelopment of these tissues. Furthermore, it's noticed that the phenotypes of each mutant strain just partially resemble the skull malformation of EIIa-253 mice, suggesting that the malformation of specific tissues partially contributes to dysmorphogenesis of skulls of AS mice (E), and that the maldevelopment of AS head is caused by the combined effects of abnormal development of calvarias, cranial base, brain and other tissues(D).
Discussion
The development of calvaria bone, cranial base and brain, three important components of head, are coordinately interacted. Maldevelopment of anyone of these tissues could lead to deformed skulls. The interaction among calvaria bone, cranial base and brain tissue can be exerted through biomechanical and/or biochemical mechanisms. Through biomechanical mechanism, hydrocephalus usually leads to large skull and cranial cavity[38]. Patients with craniosynostosis are at increased risk for elevated intracranial pressure, which may restrict brain development[39]. In the case of biochemical mechanism, brain tissue can secrete leptin to regulate bone tissue, and osteoblast-derived hormone osteocalcin could cross the blood-brain barrier to influence fetal brain development[40].
Apert syndrome, mainly caused by P253R and S252W mutation of FGFR2, is a common craniosynostosis[5, 41] characterized with brachycephaly presumably resulting from premature fusion of cranial sutures. Since FGFR2 is widely expressed in cranial base, bone and brain tissue, it's difficult to distinguish the direct impact of FGFR2 on these tissues. However, clarifying the direct and indirect impact of FGFR2 on these tissues is important for the understanding of the mechanism underlying skull deformation and clinical management of Apert syndrome. For example, if brain maldevelopment of AS is related to the direct effect of mutant FGFR2, then currently used surgery mainly aimed to correct skull malformation may not lead to optimal alleviation of brain maldevelopment. Combination of other treatments such as biological therapies targeting the direct effect of mutant FGFR2 on brain development may bring better outcome.
Although Apert mouse models exhibit maldevelopment in calvarias, cranial base and brain [10, 12, 14, 42], we still don't know the accurate roles of these composing part of head in the malformation of skulls, as the mutant FGFR2 is activated in all these tissue involved in skull deformation of AS. There are few comparative genetic analyses of the differential roles of calvarias, cranial base and brain in the pathogenesis of the skull malformation in AS using mouse models with tissue-specific activation of mutant FGFR2[10, 12, 16, 19]. Also we don't know whether there is direct effect of mutant FGFR2 on the brain development. To clarify the distinct roles of calvarias, cranial base and brain in the skull deformity of AS, we generated mouse models expressing mutant FGFR2 specifically in osteoblasts, chondrocytes and neural progenitor cells, respectively by using the Cre/loxP approach. These mice are excellent models to explore not only the direct effect of mutant FGFR2 on the development of calvarias, cranial base and brain, but also the role of malformation of these components and their reciprocal interaction in the pathogenesis of skull malformation of AS.
We found that cartilage-specific expression of FGFR2-P253R mutant resulted in shortened head, which resembles the brachycephaly found in humans and mouse models with AS[19]. However, the severity of skull malformation in Col2a1-253 mice was milder than that in EIIa-253 mice, indicating that the abnormal development of cartilage is strongly but not fully responsible for the skull malformation exhibited by AS. Col2a1-253 mice at 4-week stage had decreased rostrocaudal length, increased mediolateral breadth and dorsoventrally increased height of skulls. However, the skull breadth and height of Col2a1-253 mice had no significant changes at the 8 weeks, indicating that the abnormality of skulls was relieved during the 4-8 weeks interval.
In Apert syndrome, premature closure of coronal suture is most commonly exhibited. It's generally believed that the premature closure of suture is related to the accelerated osteogenic differentiation of suture mesenchyme. Consistently, in vitro cultured Fgfr2+/P253R calvarias also exhibited coronal suture fusion [10]. However, it is also suggested that the premature closure of coronal suture could be caused by abnormal tensile force, presumably resulting from the growth disturbance of cranial base [18, 19, 43]. We observed no LacZ positive cells in calvarial sutures in Col2a1-Cre;ROSA26-LacZ mice (Supplemental Figure 2 A-D), while the Col2a1-253 mice still have coronal sutural synostosis. We therefore consider it likely that the changed tensile resulting from the shortening of cranial base may be involved in the premature closure of coronal suture. Although there was debate about the transdifferentiation of hypertrophic chondrocytes into osteoblasts for a long time[44], recent papers further supported this viewpoint [45, 46] It is reasonable to speculate that the bony defect in cranial base of Col2a1-253 mice may be related to the disturbed transdifferentiation of hypertrophic chondrocytes into osteoblasts. It was reported that Runx2 and Ihh upregulation, which is accompanied by acceleration of chondrocytic maturation and hypertrophy, was detected in the cranial base of transgenic Col2a1-Fgfr2IIIcP253R mice [19]. Since Runx2 is a vital transcription factor for osteoblastic differentiation [47], but also play important role in chondrocyte hypertrophy [48, 49], and FGF/FGFR signaling stimulated the expression of Runx2 [50]. It is known that Ihh is crucial to regulate chondrocyte proliferation and differentiation, and osteoblastic differentiation in endochondral bones [51]. Besides, Runx2 could promote Ihh expression by directly interacting with its promoter [49]. Thus, it is possible that acceleration of chondrocytic maturation and hypertrophy in cranial base synchondroses of Col2a1-253 mice was related to FGFR2/Runx2/Ihh pathway.
Interestingly, OC-253 mice that have specific activation of mutant FGFR2 in mature osteoblasts exhibited mild skull malformation, which indicates that mutant FGFR2 in mature osteoblasts plays minor role in the malformation of AS skulls. It's interesting to study whether the mutant FGFR2 in earlier osteoblasts have more profound effects on AS skull malformation by using Col1 or Osterix driven Cre mice.
Aldridge and colleagues investigated the development of brain and sutures in Fgfr2+/P253R mice. They proposed that the abnormal brain morphology is directly related to mutant FGFR2, not the premature fusion of sutures [14]. Consistently, in present study, by using tissue specific activation approach we found that the skulls of Nestin-253 mice showed increased caudal brain in rostrocaudal and dorsoventral direction at the age of 8 weeks, indicating that mutant FGFR2 may directly disturb brain development, which may be involved in the skull malformation of Fgfr2+/P253R mice. FGFR2 is broadly expressed in brain [52, 53], while Nestin expression in brain is more focused in progenitor cells of cerebral cortex, cerebellum, hippocampus, thalamus, midbrain, and hypothalamus [35, 54]. Thus, the expression patterns of FGFR2 and Nestin are partially overlapped in brain tissue, the actual effect of the mutant FGFR2 on brain development in AS (Fgfr2+/P253R mice) may be more profound. We thus propose that the abnormal brain morphology and mental retardation of AS is also associated with the direct effect of mutant FGFR2 on brain development. In addition to its expression in the brain, Nestin is also expressed in mesenchymal stem cells (MSCs). We speculate that the abnormal facial bone may be also related to effect of FGFR2-P253R on MSCs. Additionally, the anomalies of facial skeleton in Nestin-253 mice may also be related to the indirect effect of the maldeveloped brain (such as secreted molecules from brain). Commonly used surgical correction of the misshaped skulls alone is not enough for effective alleviating the maldeveloped brain. Adjuvant biological therapies against FGFR2 signaling are needed to relieve the brain malformation and/or mental retardation of AS.
In conclusion, results from our genetic and quantitative EDMA studies indicate that the maldevelopment of AS skulls is caused by the combined effects of the abnormal development of calvarias, cranial base and brain, three important composing components of head. Among them, dysregulated endochondral ossification appears to play essential roles in the pathogenesis of skull malformation of AS. Our results also revealed that there is direct effect of mutant FGFR2 on brain development. Our study provides important insights for the mechanism understanding of the skull malformation, and new clues for designing therapies of AS.
Supplementary Material
Supplementary figures and tables.
Acknowledgements
This work is supported by Special Funds for Major State Basic Research Program of China (973 program) (No.2014CB942904), the Funds for International Cooperation and Exchange of the National Natural Science Foundation of China (No. 81220108020), the National Natural Science Foundation of China (No. 81501848) and the Basic and Frontier Research Program of Chongqing (No. CSTC2013jcyjC00009).
Competing interest
The authors have declared that no competing interest exists.
References
1. Opperman LA. Cranial sutures as intramembranous bone growth sites. Dev Dyn. 2000;219:472-85
2. Shum L, Wang X, Kane AA. et al. BMP4 promotes chondrocyte proliferation and hypertrophy in the endochondral cranial base. Int J Dev Biol. 2003;47:423-32
3. Morriss-Kay GM, Wilkie AO. Growth of the normal skull vault and its alteration in craniosynostosis: insights from human genetics and experimental studies. J Anat. 2005;207:637-53
4. Hehr U, Muenke M. Craniosynostosis syndromes: from genes to premature fusion of skull bones. Mol Genet Metab. 1999;68:139-51
5. Cohen MM, Kreiborg S, Lammer EJ. et al. Birth prevalence study of the Apert syndrome. Am J Med Genet. 1992;42:655-9
6. Tolarova MM, Harris JA, Ordway DE. et al. Birth prevalence, mutation rate, sex ratio, parents' age, and ethnicity in Apert syndrome. Am J Med Genet. 1997;72:394-8
7. Cohen MM Jr, Kreiborg S. Suture formation, premature sutural fusion, and suture default zones in Apert syndrome. Am J Med Genet. 1996;62:339-44
8. Upton J. Apert syndrome. Classification and pathologic anatomy of limb anomalies. Clin Plast Surg. 1991;18:321-55
9. Gosain AK, McCarthy JG, Glatt P. et al. A study of intracranial volume in Apert syndrome. Plast Reconstr Sur. 1995;95:284-95
10. Yin L, Du X, Li C. et al. A Pro253Arg mutation in fibroblast growth factor receptor 2 (Fgfr2) causes skeleton malformation mimicking human Apert syndrome by affecting both chondrogenesis and osteogenesis. Bone. 2008;42:631-43
11. Chen L, Li D, Li C. et al. A Ser252Trp [corrected] substitution in mouse fibroblast growth factor receptor 2 (Fgfr2) results in craniosynostosis. Bone. 2003;33:169-78
12. Wang Y, Xiao R, Yang F. et al. Abnormalities in cartilage and bone development in the Apert syndrome FGFR2(+/S252W) mouse. Development (Cambridge, England). 2005;132:3537-48
13. Wang Y, Sun M, Uhlhorn V. et al. Activation of p38 MAPK pathway in the skull abnormalities of Apert syndrome Fgfr2+ P253R mice. BMC Dev Biol. 2010;10:1-20
14. Aldridge K, Hill CA, Austin JR. et al. Brain phenotypes in two FGFR2 mouse models for Apert syndrome. Dev Dynam. 2010;239:987-97
15. Jackson RA, Kumarasuriyar A, Nurcombe V. et al. Long-term loading inhibits ERK1/2 phosphorylation and increases FGFR3 expression in MC3T3-E1 osteoblast cells. J Cell Physiol. 2006;209:894-904
16. Du X, Weng T, Sun Q. et al. Dynamic morphological changes in the skulls of mice mimicking human Apert syndrome resulting from gain-of-function mutation of FGFR2 (P253R). J Anat. 2010;217:97-105
17. Carinci F, Avantaggiato A, Curioni C. Crouzon syndrome: cephalometric analysis and evaluation of pathogenesis. Cleft Palate-Cran J. 1994;31:201-9
18. Kreiborg S, Marsh JL, Cohen MM. et al. Comparative three-dimensional analysis of CT-scans of the calvaria and cranial base in Apert and Crouzon syndromes. J Craniomaxillofac Surg. 1993;21:181-8
19. Nagata M, Nuckolls GH, Wang X. et al. The primary site of the acrocephalic feature in Apert syndrome is a dwarf cranial base with accelerated chondrocytic differentiation due to aberrant activation of the FGFR2 signaling. Bone. 2011;48:847-56
20. Renier D, Arnaud E, Cinalli G. et al. Prognosis for mental function in Apert's syndrome. J Neurosurg. 1996;85:66-72
21. Cohen MM, Kreiborg S. Cranial size and configuration in the Apert syndrome. J Craniofac Genet Dev Biol. 1994;14:153
22. Aldridge K, Marsh JL, Govier D. et al. Central nervous system phenotypes in craniosynostosis. J Anat. 2002;201:31-9
23. Yacubian-Fernandes A, Palhares A, Giglio A. et al. Apert syndrome: factors involved in the cognitive development. Arquivos de neuro-psiquiatria. 2005;63:963-8
24. Cohen MM, Kreiborg S. The central nervous system in the Apert syndrome. Am J Med Genet. 1990;35:36-45
25. Yacubian-Fernandes A, Palhares A, Giglio A. et al. Apert syndrome: analysis of associated brain malformations and conformational changes determined by surgical treatment. J Neuroradiology. 2004;31:116-22
26. Hao ZM, Yang X, Cheng X. et al. Generation and characterization of chondrocyte specific Cre transgenic mice. Yi Chuan Xue Bao. 2002;29:424-9
27. Cheng X, Weng TJ, Tan XH. et al. Establishment of osteoblast-specific Cre transgenic mice. Yi Chuan. 2007;29:1237-42
28. McLeod MJ. Differential staining of cartilage and bone in whole mouse fetuses by alcian blue and alizarin red S. Teratology. 1980;22:299-301
29. Su N, Sun Q, Li C. et al. Gain-of-function mutation in FGFR3 in mice leads to decreased bone mass by affecting both osteoblastogenesis and osteoclastogenesis. Hum Mol Genet. 2010;19:1199-210
30. Richtsmeier JT, Baxter LL, Reeves RH. Parallels of craniofacial maldevelopment in Down syndrome and Ts65Dn mice. Dev Dynam. 2000;217:137-45
31. Martinez-Abadias N, Motch SM, Pankratz TL. et al. Tissue-specific responses to aberrant FGF signaling in complex head phenotypes. Dev Dyn. 2013;242:80-94
32. Hill CA, Martinez-Abadias N, Motch SM. et al. Postnatal brain and skull growth in an Apert syndrome mouse model. Am J Med Genet A. 2013;161A:745-57
33. Richtsmeier JT, Lele S. Analysis of craniofacial growth in Crouzon syndrome using landmark data. J Craniofac Genet Dev Biol. 1990;10:39-62
34. Lele S, Richtsmeier JT. Euclidean distance matrix analysis: confidence intervals for form and growth differences. Am J Phys Anthropol. 1995;98:73-86
35. Dahlstrand J, Lardelli M, Lendahl U. Nestin mRNA expression correlates with the central nervous system progenitor cell state in many, but not all, regions of developing central nervous system. Brain Res Dev Brain Res. 1995;84:109-29
36. Cohen MM Jr, Kreiborg S. A clinical study of the craniofacial features in Apert syndrome. Int J Oral Max Surg. 1996;25:45-53
37. Cohen MM Jr, Kreiborg S. Growth pattern in the Apert syndrome. Am J Med Genet. 1993;47:617-23
38. Krefft TA, Graff-Radford NR, Lucas JA, Mortimer JA. Normal pressure hydrocephalus and large head size. Alz Dis Assoc Dis. 2004;18:35-7
39. Bristol RE, Lekovic GP, Rekate HL. The effects of craniosynostosis on the brain with respect to intracranial pressure. Semin Pediatr Neurol. 2004;11:262-7
40. Oury F, Khrimian L, Denny CA. et al. Maternal and offspring pools of osteocalcin influence brain development and functions. Cell. 2013;155:228-41
41. Czeizel AE, Elek C, Susánszky É. Birth prevalence study of the Apert syndrome. Am J Med Genet. 1993;45:392
42. Heuze Y, Martinez-Abadias N, Stella JM. et al. Quantification of facial skeletal shape variation in fibroblast growth factor receptor-related craniosynostosis syndromes. Birth Defects Res A Clin Mol Teratol. 2014;100:250-9
43. Cohen MM. Sutural biology and the correlates of craniosynostosis. Am J Med Genet. 1993;47:581-616
44. Ishizeki K, Takigawa M, Nawa T. et al. Mouse Meckel's cartilage chondrocytes evoke bone-like matrix and further transform into osteocyte-like cells in culture. Anatomical Record. 1996;245:25-35
45. Yang G, Zhu L, Hou N. et al. Osteogenic fate of hypertrophic chondrocytes. Cell Res. 2014;24:1266-9
46. Liu Y, Kwok Yeung T, Hoi Ching T. et al. Hypertrophic chondrocytes can become osteoblasts and osteocytes in endochondral bone formation. Proc Natl Acad Sci USA. 2014;111:12097-102
47. T. Komori, H. Yagi, S. Nomura, et al. Targeted disruption of Cbfa1results in a complete lack of bone formation owing to maturational arrest of osteoblasts. Cell. 1997;89:755-64
48. Chisato Ueta, Masahiro Iwamoto, Naoko Kanatani. et al. Skeletal Malformations Caused by Overexpression of Cbfa1 or Its Dominant Negative Form in Chondrocytes. J Cell Biol. 2001;153:87-100
49. Carolina A. Yoshida, Hiromitsu Yamamoto, Takashi Fujita, et al. Runx2 and Runx3 are essential for chondrocyte maturation, and Runx2 regulates limb growth through induction of Indian hedgehog. Gene Dev. 2004;18:952-63
50. Hyun-Jung Kim, Jung-Hwan Kim, Suk-Chul Bae. et al. The protein kinase C pathway plays a central role in the fibroblast growth factor-stimulated expression and transactivation activity of Runx2. J Biol Chem. 2003;278:319-26
51. Benoit St-Jacques, Matthias Hammerschmidt, McMahon AP. Indian hedgehog signaling regulates proliferation and differentiation of chondrocytes and is essential for bone formation. Gene Dev. 1999;13:2072-86
52. Wilke TA, Gubbels S, Schwartz J. et al. Expression of fibroblast growth factor receptors (FGFR1, FGFR2, FGFR3) in the developing head and face. Dev Dynam. 1997;210:41-52
53. Belluardo N, Wu G, Mudo G. et al. Comparative localization of fibroblast growth factor receptor-1,-2, and-3 mRNAs in the rat brain: in situ hybridization analysis. J Comp Neurol. 1997;379:226-46
54. Tronche F, Kellendonk C, Kretz O. et al. Disruption of the glucocorticoid receptor gene in the nervous system results in reduced anxiety. Nat Genet. 1999;23:99-103
Author contact
![]() Corresponding authors: Prof. Xiaolan Du, Department of Rehabilitation Medicine, Center of Bone Metabolism and Repair, State Key Laboratory of Trauma, Burns and Combined Injury, Trauma Center, Research Institute of Surgery, Daping Hospital, Third Military Medical University, Chongqing 400042, China. Tel: 86-23-68757040. Fax: 86-23-68702991. E-mail: DXL_xiaolancom. Prof. Lin Chen, Department of Rehabilitation Medicine, Center of Bone Metabolism and Repair, State Key Laboratory of Trauma, Burns and Combined Injury, Trauma Center, Research Institute of Surgery, Daping Hospital, Third Military Medical University, Chongqing 400042, China. Tel: 86-23-68757041. Fax: 86-23-68702991. E-mail: linchen70com.
Corresponding authors: Prof. Xiaolan Du, Department of Rehabilitation Medicine, Center of Bone Metabolism and Repair, State Key Laboratory of Trauma, Burns and Combined Injury, Trauma Center, Research Institute of Surgery, Daping Hospital, Third Military Medical University, Chongqing 400042, China. Tel: 86-23-68757040. Fax: 86-23-68702991. E-mail: DXL_xiaolancom. Prof. Lin Chen, Department of Rehabilitation Medicine, Center of Bone Metabolism and Repair, State Key Laboratory of Trauma, Burns and Combined Injury, Trauma Center, Research Institute of Surgery, Daping Hospital, Third Military Medical University, Chongqing 400042, China. Tel: 86-23-68757041. Fax: 86-23-68702991. E-mail: linchen70com.