Impact Factor ISSN: 1449-2288
- Issue 12; 2026
- Issue 11; 2026
- Issue 10; 2026
- Issue 9; 2026
- Issue 8; 2026
- Volume 22; 2026
- Past Issues
- Advance Articles
- Editorial Board
- Cover Images
- Index & Coverage
- Cover Suggestion
- Special Issues
Introduction
Materials and methods
Results
Discussion
Limitations and future studies
Acknowledgements
References

 Global reach, higher impact
Int J Biol Sci 2017; 13(3):276-285. doi:10.7150/ijbs.17617 This issue Cite
Research Paper
PKD knockdown inhibits pressure overload-induced cardiac hypertrophy by promoting autophagy via AKT/mTOR pathway
Di Zhao1, Wei Wang2, Hao Wang3, Honghai Peng4, Xiangjuan Liu5, Weixing Guo6, Guohai Su4, Zhuo Zhao4 ![]()
1. Department of Oncology, Affiliated Hospital of Shandong Academy of Medical Sciences, Shandong, China.
2. Department of Cardiology, Shandong Provincial Chest Hospital, Shandong, China.
3. Department of Anesthesiology, Wake Forest School of Medicine, Winston-Salem, NC, USA.
4. Department of Cardiology, Jinan Central Hospital, Affiliated with Shandong University, Shandong, China.
5. Key Laboratory of Cardiovascular Remodeling and Function Research, Chinese Ministry of Education and Chinese Ministry of Health, Qilu Hospital of Shandong University, Shandong, China.
6. Shandong Academy of Medical Sciences, Shandong, China.
Received 2016-9-17; Accepted 2016-12-6; Published 2017-2-12
Abstract

Growing evidence shows that protein kinase D (PKD) plays an important role in the development of pressure overload-induced cardiac hypertrophy. However, the mechanisms involved are not clear. This study tested our hypothesis that PKD might mediate cardiac hypertrophy by negatively regulating autophagy using the technique of PKD knockdown by siRNA. Cardiac hypertrophy was induced in 8-week old male C57BL/6 mice by transverse aortic constriction (TAC). TAC mice were then divided into five groups receiving the treatments of vehicle (DMSO), an autophagy inducer rapamycin (1 mg/kg/day, i.p.), control siRNA, lentiviral PKD siRNA (2×10⁸ transducing units/0.1 ml, i.v. injection in one day after surgery, and repeated in 2 weeks after surgery), and PKD siRNA plus 3-methyladenine (3-MA, an autophagy inhibitor, 20 mg/kg/day, i.p.), respectively. Four weeks after TAC surgery, echocardiographic study, hematoxylin and eosin (HE) staining, and Masson's staining showed mice with TAC had significantly hypertrophy and remodeling compared with sham animals. Treatments with PKD siRNA or rapamycin significantly ameliorated the cardiac hypertrophy and dysfunction. Moreover, PKD siRNA increased cardiac autophagic activity determined by electron micrographic study and the biomarkers by Western blot, accompanied with the downregulated AKT/mTOR/S6K signaling pathway. All the cardiac effects of PDK knockdown were inhibited by co-treatment with 3-MA. These results suggest that PKD is involved in the development of cardiac hypertrophy by inhibiting cardiac autophagy via AKT/mTOR pathway.
Keywords: PKD knockdown, pressure overload, cardiac hypertrophy, autophagy, AKT/mTOR pathway
Introduction
In response to pressure overload, the heart originally undergoes adaptive morphological changes that lead to compensated hypertrophy to maintain the cardiac output. However, prolonged cardiac hypertrophy under consistent stress irreversibly results in cardiac decompensation, which is one of the major risk factors for lethal cardiovascular events by inducing arrhythmias, heart failure, and sudden cardiac death [1]. The study on the molecular mechanisms of cardiac hypertrophy and its transition to heart failure is critical in this field in order to develop more specific interventions to prevent or delay this process.
Recent studies suggest that autophagy might be involved in the development of cardiac hypertrophy [2,3,4]. Autophagy is an evolutionary conserved cellular process for the degradation and recycling of long-lived protein aggregates and organelles, by forming double membranous vesicles named autophagosomes [5, 6]. As a regulator of cell death, autophagy is motivated by a series of pathological stimuli, such as pathogen infections, starvation, endoplasmic reticulum (ER) stress, hypoxia, and ischemia [7, 8]. The abnormality of cardiac autophagy has been found in a variety of cardiovascular diseases including pressure overload-induced cardiac hypertrophy and heart failure [2,3,4]. However, how autophagy is involved in the cardiac hypertrophy and heart failure is unclear yet.
Protein kinase D (PKD) is a novel family of serine/threonine kinases and diacylglycerol receptors that belongs to the calcium/calmodulin-dependent kinase superfamily [9]. The PKD family includes three members, PKD1, PKD2 and PKD3, with different structural features and enzymological properties. It has been shown that PKD1, the most comprehensive member of this family, is involved in multiple biological processes, such as cell adhesion, migration, survival, proliferation, differentiation and apoptosis. Growing evidence shows that PKD plays an important role in the cardiovascular system, especially in the regulation of myocardial contraction and hypertrophy [10].
The protein kinase B (Akt)/mammalian target of rapamycin (mTOR) pathway is a well-known pathway involved in the negative regulation of autophagy in mammal cells [11]. The inhibition of mTOR prevents cardiac hypertrophy, suggesting that mTOR and its downstream molecules might be involved in the development of cardiac hypertrophy through the inhibition of autophagy [12]. In this study, we demonstrated that PKD is involved in cardiac hypertrophy by regulating autophagy via Akt/mTOR pathway in transverse aortic constriction (TAC)-induced cardiac hypertrophy mouse model using siRNA knockdown and other physiological and molecular techniques.
Materials and methods
Animals
C57BL/6 male mice at 8-10 weeks old (22-25 g of body weight) were provided by the Animal Center of Beijing Biological Technology, Inc. (Production batch number 20141008). All mice used in this study were housed in a facility with a 12-hour light/dark cycle and constant temperature and humidity. All procedures were in compliance with the Guide for the Care and Use of Laboratory Animals, published by the National Institutes of Health, and were reviewed and approved by the Institutional Animal Research Committee of Shandong University.
Reagents
The following reagents were used in this study and the purchase information was included: Dimethyl sulfoxide (DMSO) from Sigma-Aldrich Co. (St. Louis, MO, USA); Lentiviral PKD siRNA from Genechem Co. (Shanghai, China) with the sequences: TTC AGC TTT AAC TCC CGT T; The autophagy inducer rapamycin from Santa Cruz Biotechnology Inc. (Dallas, TX, USA); The autophagy inhibitor 3-methyladenine (3-MA) from Sigma-Aldrich Co. (St. Louis, MO, USA).
Transverse aortic constriction surgery
The mice were randomly assigned to have sham and TAC surgery, which were performed under the anesthesia with 1% isoflurane in oxygen as described previously [13]. In brief, the chest was opened at the 2-3 intercostal space along the midsternal line, the aorta was isolated and a 6-0 silk tie was applied against a 27-gauge needle between the innominate and left carotid artery. The needle was removed after ligation and the chest and overlying skin were closed [13].
Treatments
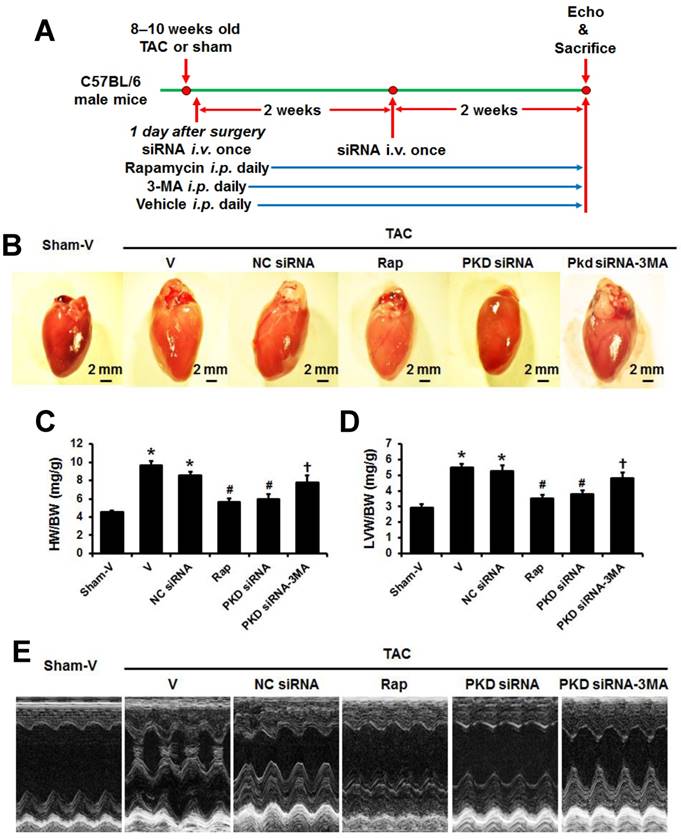
As shown in Figure 1A, TAC mice were divided into five groups receiving the treatments of vehicle (DMSO), siRNA negative control (NC siRNA), rapamycin, PKD siRNA, and PKD siRNA-3MA, respectively. PKD siRNA at 2×10⁸ transducing units/0.1 ml, the dose that was suggested by the provider (Genechem Co., China), was injected into the tail vein of mice in one day after surgery, and repeated in 2 weeks after surgery (total twice of injection). The autophagy inducer rapamycin (1 mg/kg/day) [14] or autophagy inhibitor 3-methyladenine (3-MA, 20 mg/kg/day) [15] was administered to mice via intraperitoneal injection daily for 4 weeks starting 1 day after TAC surgery. The doses of rapamycin and 3-MA were used according to previous publications [14,15]. Sham mice were also injected with vehicle (DMSO) as control. At the end of experiment, following echocardiographic evaluation, animals were euthanized and tissues were collected for western blot, and histological analyses.
TAC-induced cardiac hypertrophy with various treatments. (A) Timeline of study protocol. (B) Representative gross heart pictures. (C) Heart weight/body weight (HW/BW) and (D) left ventricle weight/body weight (LVW/BW) ratios. (E) Representative M-mode echocardiographic images after 4 weeks of TAC. TAC, transverse aorta constriction; V, vehicle; NC, negative control; Rap, rapamycin. Data are mean±SEM, n=8-9/group. * P<0.05 vs. sham; # P<0.05 vs. vehicle or NC siRNA treated TAC mice; … P<0.05 vs. TAC-PKD siRNA.
Echocardiography and blood pressure measurement
A Vevo 770 imaging system equipped with a 30 MHz high frequency scan head (Vevo770®, VisualSonics, Toronto, Canada) was used for echocardiography analysis according to the American Society for Echocardiography leading-edge method [16]. Mice were anesthetized with an isoflurane (2%) and O2 (1.5L/min) mixture and positioned on a heated pad in a recumbent position. The end-diastolic interventricular septum thickness (IVSd), end-diastolic left ventricular (LV) posterior wall thickness (LVPWd), LV anterior wall thickness (LVAWd), LV end systolic diameter (LVSD), and end-systolic interventricular septum thickness (IVSs) were measured using M-mode. Ejection fraction (EF, %) and fractional shortening (FS, %) were calculated as described previously [17]. Systolic blood pressure (SBP) was measured noninvasively using a volume-pressure recording tail-cuff method on conscious, restrained mice using the CODA 6 system (Kent Scientific Corp, Torrington, USA).
Histological and immunohistochemistry study
Histological and immunohistochemistry study were performed as we previously reported [18]. LV specimens were fixed in 4% paraformaldehyde and embedded into paraffin blocks. 5 µm sections were cut and stained with hematoxylin and eosin (H&E) to determine the myocyte cross-sectional area (CSA). At least one hundred myocytes in each left ventricle sample were outlined and CSA was evaluated using Image Pro-Plus version 6.0 image analysis software (Media Cybernetics Inc., Rockville, MD, USA) following its instructions. Masson staining was performed to determine collagen deposition as we previously described [18]. The slides were examined microscopically and the fibrotic area was determined by the area of myocardial collagen/the area of the field using Image Pro-Plus version 6.0 image analysis software. The average from 10 sections per heart was used for statistical analysis.
Real-time quantitative PCR (RT-qPCR)
RT-qPCR was used to measure mRNA levels of biomarkers of cardiac hypertrophy, atrial natriuretic factor (ANF) and brain natriuretic peptide (BNP), in the hearts using a SYBR Green PCR kit (Qiagen Inc., Valencia, California, USA), as we previously described [19]. The following primers were used for real-time PCR: 5'-GGA AAA GGC AGT CGA TTC TG-3' and 5'-CAG AGT GGG AGA GGC AAG AC-3' for ANF; 5'-GCC AGT CTC CAG AGC AAT TC-3' and 5'-TCT TTT GTG AGG CCT TGG TC-3' for BNP; 5'-AGA ACA TCA TCC CTG CAT CC-3' and 5'-CAC ATT GGG GGT AGG AAC AC-3' for GAPDH. Amplification and detection were performed with the ABI7500 Sequence Detection System (Applied Biosystems, Foster City, CA). A crossing threshold (CT) value was obtained, corresponding to the fractional number of amplification cycles where the PCR curve reaches a program-defined threshold amount of fluorescence. Relative quantification of RT-qPCR data was performed using the delta CT (sample CT minus GAPDH CT) and delta delta CT (sample delta CT minus comparator delta CT) methods according to previously described [20]. Expression levels are reported relative to the geometric mean of the control group.
Transmission electron microscopy analysis
LVs were cut into 1 mm3 cubes, fixed with 2% glutaraldehyde in PBS at 4°C overnight. The fixed samples were then post-fixed with 1% buffered osmium tetroxide, embedded, and analyzed using transmission electron microscopy (JEM-1200EX, Japan) as described previously [18].
Western blot analysis
Western blot analysis was performed as previously described [18]. Proteins were separated by electrophoresis through an 8%-12% SDS-polyacrylamide gel, and transferred to polyvinylidene difluoride membranes. The membranes were probed with antibodies against LC3B (1:1000 dilution), Beclin 1 (1:1000 dilution), SQSTM1/p62 (1:1000 dilution), total AMPK and phosphorylated AMPK (1:2000 dilution), total Akt and phosphorylated Akt (Ser473) (1:1000 dilution), total and phosphorylated mTORSer2448 (1:1000 dilution), total and phosphorylated S6K (Ser235/236) (1:1000 dilution), total and phosphorylated PKD (Ser2486, 1:1000 dilution), and glyceraldehyde-3-phosphate dehydrogenase (GAPDH; 1:5000) was used as a loading control. All the antibodies were purchased from Cell Signaling Technology, Inc. (Danvers, MA, USA). The bands were digitized using MCID image analysis software (Imaging Research, Inc., Ontario, Canada). Each band was expressed in arbitrary units and normalized to GAPDH.
Statistics
The statistical analysis was performed using the SPSS (Statistical Package for the Social Sciences) software package, version 16.0 (SPSS Inc, Chicago, IL, USA). The results are expressed as the mean±SEM. All statistical significance was determined by one-way ANOVA, followed by Tukey post-hoc tests. A value of P<0.05 was considered statistically significant.
Results
TAC-induced cardiac structural and functional changes
At four weeks after TAC surgery, rapamycin, PKD siRNA, or 3-MA treatments did affect systolic blood pressure (data not shown). While there were no differences of body weight among groups (data not shown), the heart size, both whole heart weight and left ventricle weight increased in TAC mice compared to sham animals, which were decreased by rapamycin or PKD siRNA treatment. The treatment with 3-MA, an autophagy inhibitor, inhibited the effects of PKD siRNA on TAC-induced heart and LV weights (Figure 1A-C).
Consistent with the findings from heart size and weights, echocardiographic study showed that hypertrophic indicators including LVPWd, LVAWd, LVSd, IVSd, and IVSs significantly increased in the TAC vs. sham mice (P<0.05, Table 1), which were attenuated by the treatments of rapamycin and PKD siRNA. Moreover, the treatment with 3-MA inhibited the effects of PKD siRNA on TAC-induced cardiac hypertrophy (Table 1, Figure 1D). The systolic function reflected by EF and FS significantly impaired by TAC surgery, which were improved with rapamycin or PKD siRNA treatment. Also, 3-MA inhibited the cardioprotective effects of PKD siRNA (Table 1).
Echocardiographic analysis of left ventricles.
| Group | IVSd (mm) | IVSs (mm) | LVSd (mm) | LVIDs (mm) | LVAWd (mm) | LVPWd (mm) | EF (%) | FS (%) |
|---|---|---|---|---|---|---|---|---|
| Sham-V | 0.16±0.02 | 0.25±0.02 | 0.70±0.02 | 2.25±0.07 | 1.24±0.06 | 0.67±0.02 | 72.5±0.02 | 33.8±0.32 |
| TAC-V | 0.21±0.02* | 0.31±0.03* | 0.90±0.02* | 2.51±0.02* | 1.78±0.03* | 0.82±0.05* | 58.0±0.01* | 26.6±0.68* |
| TAC-NC siRNA | 0.20±0.02* | 0.30±0.02* | 0.89±0.01* | 2.50±0.08 | 1.76±0.05* | 0.80±0.02* | 60.2±0.02* | 27.6±0.02* |
| TAC-rapamycin | 0.18±0.02# | 0.27±0.02# | 0.78±0.01# | 2.27±0.04# | 1.43±0.02# | 0.74±0.03# | 66.3±0.01# | 32.6±0.34# |
| TAC-PKD siRNA | 0.17±0.02# | 0.29±0.03 | 0.76±0.02 | 2.29±0.06# | 1.48±0.03# | 0.77±0.05 | 67.8±0.01# | 33.6±0.26# |
| TAC-PKD siRNA-3MA | 0.20±0.02… | 0.28±0.03 | 0.85±0.02… | 2.46±0.03… | 1.69±0.07… | 0.79±0.02 | 61.4±0.04… | 29.8±0.12… |
IVSd, interventricular septum thickness in diastole; IVSs, interventricular septum end-systolic thickness; LVSd, left ventricle (LV) end systolic diameter; LVIDs, LV internal dimension in systole; LVAWd, LV anterior wall thickness at diastole; LVPWd, LV posterior wall thickness at diastole; EF, ejection fraction; FS, fractional shortening; TAC, transverse aortic constriction; V, vehicle; NC, negative control. Data are mean±SEM, n=8-9/group. * P<0.05 vs. sham; # P<0.05 vs. vehicle or NC siRNA treated TAC mice; … P<0.05 vs. TAC-PKD siRNA.
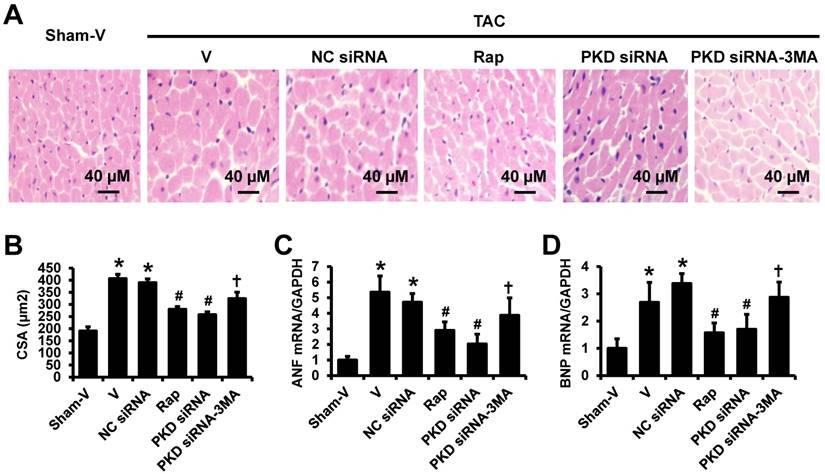
The TAC-induced cardiac hypertrophy was confirmed by the hematoxylin and eosin (HE) staining in left ventricles showing that the cardiomyocytes in TAC mice were significantly larger than that in sham mice, which were attenuated by rapamycin or PKD siRNA treatment. Similarly, to echocardiographic findings, 3-MA inhibited the effects of PKD siRNA on cardiomyocyte size (Figure 2A,2B). These results are consistent with the gene expression changes of biomarkers for cardiac hypertrophy, ANF and BNP (Figure 2C,2D).
H&E staining of left ventricles and real-time PCR. (A) Representative images of H&E staining in left ventricle transverse sections. (B) Quantification results of myocyte cross-sectional areas (CSA). (C) ANF mRNA level in the heart. (D) BNP mRNA level in the heart. TAC, transverse aorta constriction; V, vehicle; NC, negative control; Rap, rapamycin. Data are mean±SEM, n=8-9/group. * P<0.05 vs. sham; # P<0.05 vs. vehicle or NC siRNA treated TAC mice; … P<0.05 vs. TAC-PKD siRNA.
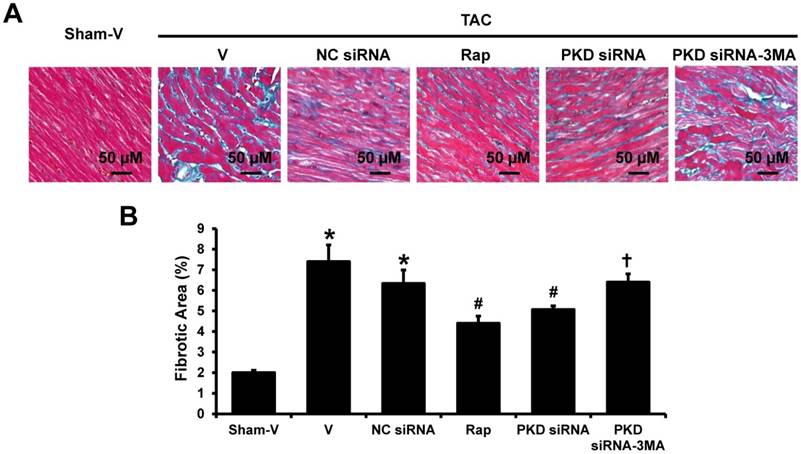
Masson's trichrome staining showed a dramatically elevated collagen in the heart of TAC mice as compared with the control group. The collagen volume fraction was reduced by rapamycin or PKD siRNA versus vehicle or control siRNA treatment. Again, the cardiac collagen reduction by PKD siRNA was inhibited by co-treatment with 3-MA (Figure 3).
Fibrosis in left ventricles. (A) Representative images of Masson's Trichrome staining in left ventricles, the blue stands for fibrosis. (B) Quantification results of the cardiac fibrosis area. TAC, transverse aorta constriction; V, vehicle; NC, negative control; Rap, rapamycin. Data are mean±SEM, n=8-9/group. * P<0.05 vs. sham; # P<0.05 vs. vehicle or NC siRNA treated TAC mice; … P<0.05 vs. TAC-PKD siRNA.
Cardiac autophagy in TAC-induced cardiac hypertrophy
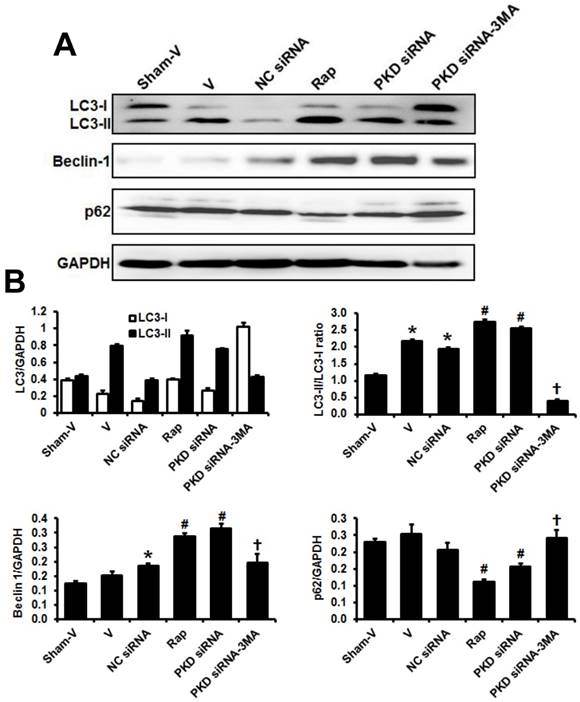
To determine the autophagic activity and the effects of PKD deletion in pressure overload-induced cardiac hypertrophy, we assessed the expression of autophagosome markers, light chain 3B (LC3B; including LC3-I and LC3-II), beclin-1 and p62, which are key proteins involved in the regulation of autophagy. As shown in Figure 4, results from Western blot demonstrated that LC3-II/LC3-I ratio significantly increased after pressure overload, while it was further increased by rapamycin or PKD knockdown. Compared with sham animals, TAC mice treated with control siRNA significantly increased while TAC mice treated with vehicle tended to increase cardiac Beclin 1 expression. Similarly to LC3-II/ LC3-I ratio changes, both rapamycin and PKD siRNA increased Beclin 1 expression. 3MA treatment inhibited PKD siRNA-induced increases of LC3-II/ LC3-I ratio and Beclin 1 expression. In comparison to sham mice, cardiac p62 expression did not change in TAC mice treated with vehicle or control siRNA. However, both rapamycin and PKD siRNA decreased p62 expression, which was inhibited by 3MA treatment (Figure 4).
Biomarkers of cardiac autophagy. (A) Representative images of Western blot for LC3, Beclin 1, and p62. (B) Quantification of the signal densities from Western blot. TAC, transverse aorta constriction; V, vehicle; NC, negative control; Rap, rapamycin. Data are mean±SEM, n=8-9/group. * P<0.05 vs. sham; # P<0.05 vs. vehicle or NC siRNA treated TAC mice; … P<0.05 vs. TAC-PKD siRNA.
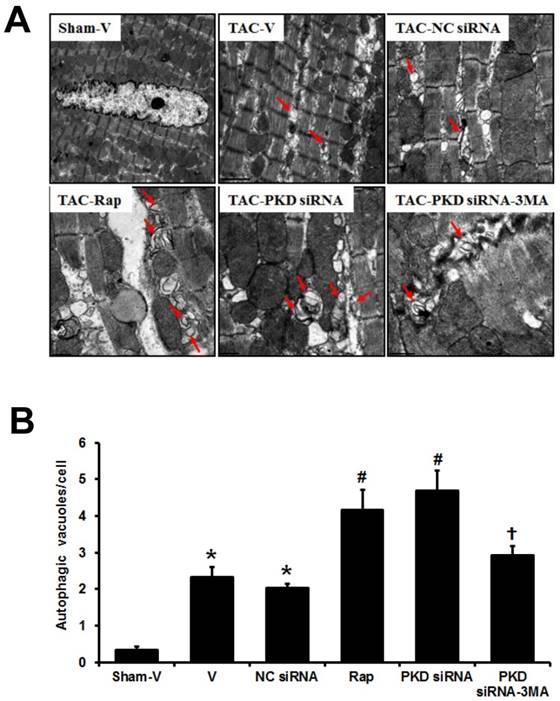
Electron microscopic examination revealed that both autophagic vacuoles and lysosomes were abundant within cardiomyocytes in the TAC-induced hypertrophic hearts when compared with sham mice, and this electron-microscopic portrayal of autophagy was even more exaggerated in TAC mice treated with either rapamycin or PKD siRNA, while the effect of PKD siRNA was inhibited by 3MA treatment (Figure 5). Fragmented mitochondria with extensive swelling and remodeling have been shown in TAC-induced hypertrophic heart. PKD siRNA treatment attenuated the disorganized sarcomere structure and mitochondrial disarray in the hypertrophic heart, accompanied with increased autophagosomes (Figure 5).
Autophagic vacuoles in cardiomyocytes. (A) Representative electron micrographs showing autophagic vacuoles in cardiomyocytes of TAC mice with various treatments (magnification: x10,000). Arrows indicate autophagic vacuoles. (B) Quantification of the number of autophagosomes/cell in different groups (a random number of 30 cells were selected for each group). TAC, transverse aorta constriction; V, vehicle; NC, negative control; Rap, rapamycin. Data are mean±SEM, n=8-9/group. * P<0.05 vs. sham; # P<0.05 vs. vehicle or NC siRNA treated TAC mice; … P<0.05 vs. TAC-PKD siRNA.
PKD knockdown inhibited TAC-induced the activation of Akt/mTOR/S6k pathway
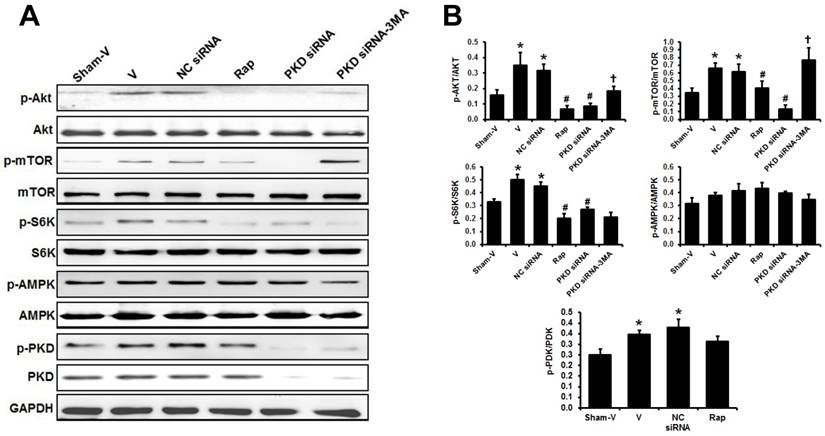
Western blot showed that the phosphorylated Akt, mTOR and S6K significantly increased in the heart of TAC mice compared to sham animals. These increases were inhibited by either rapamycin or PKD siRNA treatment. However, the inhibitory effects of PKD siRNA on the phosphorylation of Akt and mTOR were blocked by co-treatment with 3MA (Figure 6). Cardiac AMPK phosphorylation tended to increase in TAC mice. Rapamycin or PKD siRNA did not affect AMPK phosphorylation in the heart. Pressure overload by TAC increased cardiac PKD phosphorylation in comparison to sham mice. As expected, PKD siRNA decreased PKD expression ~80% in the heart (Figure 6A).
Signaling pathways regulating cardiac autophagy. (A) Representative images of Western blot for phosphorylated and total Akt, mTOR, S6K, AMPK, and PKD in the theart. (B) Quantification of the signal densities from Western blot. TAC, transverse aorta constriction; V, vehicle; NC, negative control; Rap, rapamycin. Data are mean±SEM, n=8-9/group. * P<0.05 vs. sham; # P<0.05 vs. vehicle or NC siRNA treated TAC mice; … P<0.05 vs. TAC-PKD siRNA.
Discussion
This study demonstrates that the PKD knockdown by siRNA prevents cardiac hypertrophy and remodeling in TAC mice model. The cardioprotective effects of PKD knockdown might be through the suppression of the Akt/mTOR pathways and the subsequent enhancement of cardiac autophagy. These findings provide a new insight into the mechanisms of PKD, cardiac autophagy and cardiac hypertrophy.
Accumulating evidence demonstrates that PKD plays an important role in the cardiovascular system, particularly in the regulation of myocardial contraction, and is involved in cardiac hypertrophy and remodeling [21]. A significant increase of PKD expression and activity has been reported in the hypertrophic heart of spontaneously hypertensive rats, and TAC-induced cardiac hypertrophy [18,22,23]. However, the exact mechanisms how PKD be involved in the cardiac hypertrophy are still unclear. In the present study, the molecular roles of PKD in cardiac hypertrophy were determined using the technique of siRNA-mediated gene knockdown in TAC mouse model, which is a widely used animal model for the basic research of pressure overload-induced cardiac hypertrophy. TAC surgery with a 27-gauge needle successfully induced cardiac hypertrophy evidenced by the echocardiography and immunohistochemistry study showing the increased wall thickness and cross-sectional cardiomyocyte area in four weeks after TAC. We demonstrated that PKD is activated in TAC mice compared to sham group. Most importantly, PKD knockdown with siRNA attenuated cardiac hypertrophy and remodeling in response to pressure overload. This result further demonstrates that the activated PKD is one of the mechanisms of pressure overload-induced cardiac hypertrophy.
Autophagy in cardiomyocytes has been shown to play an important role in the reaction of cardiomyocytes to numerous types of stress, and is crucial in the maintenance of cardiac function [2,3,4,24]. A number of studies indicate that the induction of autophagic activity protects heart through the elimination of injured organelles and proteins. It is reported that activating autophagy may attenuate pressure overload-induced cardiac hypertrophy [25], while the inhibition of autophagy induces cardiac hypertrophy and diastolic dysfunction with aging [26,27]. However, excessive autophagy could cause cell death and ultimately lead to the function impairment [28,29]. Recent studies revealed the significantly increased autophagy in the failing hearts, including dilated cardiomyopathy, valvular heart disease, hypertensive heart disease and chronic ischemia [18,30]. However, the exact roles of autophagy in cardiac hypertrophy and its transition to heart failure are not clear. Timing appears to be the key for the different roles of autophagy at various stages of cardiac hypertrophy and heart failure. In the present study, the autophagy significantly increased in the heart of TAC compared with sham mice. The inhibitor of mTOR, rapamycin, which is a typical autophagy inducer, prevents cardiac hypertrophy and remodeling, and improves heart function, accompanied by activation of autophagy in this TAC-induced cardiac hypertrophic mouse model. These results demonstrate that the activated autophagy has protective effects during the pathogenesis of pressure overload-induced cardiac hypertrophy and its transition to heart failure in this TAC mouse model.
One of the main findings in this study is that PKD knockdown attenuates TAC-induced cardiac hypertrophy and remodeling accompanied by increased cardiac autophagy. Moreover, the PKD knockdown-induced activated cardiac autophagy and the attenuation of cardiac hypertrophy were inhibited by 3-MA, an autophagy inhibitor, suggesting that PKD knockdown ameliorated cardiac hypertrophy and remolding through its inductive effects of autophagy.
mTOR is believed to be an important negative regulator of autophagy [31]; direct inhibition of mTOR is sufficient to trigger autophagy induction. mTOR pathway has also been shown to have a key regulatory function in cardiac hypertrophy [3,4,32]. mTOR is regulated by and communicates with multiple signaling pathways such as activated by Akt (protein kinase B, PKB). Sustained Akt activation induces cardiac hypertrophy, which may be through its regulation on mTOR pathway. AMP-activated protein kinase (AMPK) induces autophagy through its downstream target phosphorylation of mTOR [33], which might be one of the mechanisms of the favorable effects of AMPK in inhibiting cardiac hypertrophy [34].
In this study, we found that PKD knockdown significantly downregulated p-Akt, p-S6K, and p-mTOR in the hypertrophic hearts of TAC mice. To confirm whether PKD knockdown promotes autophagy through mTOR pathway, 3-MA was used in this study, which is demonstrated to inhibit autophagy by blocking autophagosome formation via the inhibition of phosphatidylinositol 3-kinases (PI3K). 3-MA increased the phosphorylation of Akt, s6k and mTOR, and inhibited PKD knockdown-induced autophagy, suggesting Akt/mTOR pathway was a pivotal mechanism by which PKD is involved in regulation of cardiac autophagy and hypertrophy. On the other hand, the AMPK, which is an upstream signal of mTOR, was not altered after PKD siRNA treatment, indicating that mTOR does not play a role in AMPK-induced autophagy in hearts.
Limitations and future studies
We also realized the limitations of this study. First, this study focused on the PKD knockdown-induced autophagy change in cardiomyocytes. However, the abnormality of autophagy in non-cardiomyocytes, especially in cardiac fibroblasts, might be also involved in the development of cardiac hypertrophy. The activation of autophagy in cardiac fibroblasts attenuates angiotensin II or adrenergic stimulation-induced cardiac fibrosis and remodeling [35,36]. In this study, we found that PKD siRNA attenuated TAC-induced cardiac fibrosis. The effects of PKD knockdown on cardiac fibrosis might be also through its regulation on autophagy in cardiac fibroblasts, which needs further studies to prove. Second, besides Akt/mTor pathway, cardiac autophagy was also regulated by other signaling pathways such as MEK/ERK/Beclin-1 pathway [37]. It would be of great interest to compare and investigate the interactions of these pathways mediating cardiac autophagy activation. Another limitation of this study is that only one time point was studied for cardiac autophagy and hypertrophy. Actually, cardiac autophagy might play different roles at various stages during the progression of cardiac hypertrophy and heart failure. Future studies are needed to determine that, at a series of time points, the different functional roles of cardiac autophagy in the development of cardiac hypertrophy and heart failure.
In summary, to our knowledge, this study provides the first evidence that PKD knockdown attenuates pressure overload-induced cardiac hypertrophy and remodeling through inducing autophagy via the inhibition of Akt/mTOR pathway. These results indicate that PKD might be a potential target gene for future therapeutic strategy of cardiac hypertrophy.
Acknowledgements
This work was funded in whole or part by National Natural Science Foundation of China Grant (No.81270175 to Z.Z.), and Doctoral Research Grant of Shandong Province (No. BS2010YY005 to Z.Z.).
Conflict of Interest
The authors declare no conflict of interest.
References
1. Shimizu I, Minamino T. Physiological and pathological cardiac hypertrophy. J Mol Cell Cardiol. 2016;97:245-62
2. Lavandero S, Troncoso R, Rothermel BA. et al. Cardiovascular autophagy: concepts, controversies, and perspectives. Autophagy. 2013;9:1455-66
3. Li Z, Wang J, Yang X. Functions of autophagy in pathological cardiac hypertrophy. Int J Biol Sci. 2015;11:672-8
4. Li Z, Song Y, Liu L. et al. miR-199a impairs autophagy and induces cardiac hypertrophy through mTOR activation. 2015 Jul 10. doi: 10.1038/cdd. 2015 95. [Epub ahead of print]
5. Green D R, Levine B. To be or not to be? How selective autophagy and cell death govern cell fate. Cell. 2014;157:65-75
6. Kaufmann A, Beier V, Franquelim HG. et al. Molecular mechanism of autophagic membrane-scaffold assembly and disassembly. Cell. 2014;156:469-81
7. Efeyan A, Comb WC, Sabatini DM. Nutrient-sensing mechanisms and pathways. Nature. 2015;517(7534):302-10
8. Gottlieb RA, Mentzer RM. Autophagy during cardiac stress: joys and frustrations of autophagy. Physiology. 2010;72:45-59
9. Ellwanger K, Hausser A. Physiological functions of protein kinase D in vivo. IUBMB Life. 2013;65:98-107
10. Nichols CB, Chang CW, Ferrero M. et al. β-Adrenergic Signaling Inhibits Gq-Dependent PKD Activation by Preventing PKD Translocation. Circ Res. 2014;114:1398-409
11. Wei F Z, Cao Z, Wang X. et al. Epigenetic regulation of autophagy by the methyltransferase EZH2 through an MTOR-dependent pathway. Autophagy. 2015;11:2309-22
12. Bénard L, Oh JG, Cacheux M. et al. Cardiac stim1 silencing impairs adaptive hypertrophy and promotes heart failure through inactivation of mTORC2/Akt signaling. Circulation. 2016;133:1458-71
13. Rinnström D, Dellborg M, Thilén U. et al. Left ventricular hypertrophy in adults with previous repair of coarctation of the aorta; Association with systolic blood pressure in the high normal range. Int J Cardiol. 2016;218:59-64
14. Anderl S, Freeland M, Kwiatkowski D J. et al. Therapeutic value of prenatal rapamycin treatment in a mouse brain model of tuberous sclerosis complex. Hum Mol Genet. 2011;20:4597-604
15. Wang L, Zhu Y R, Wang S. et al. Autophagy inhibition sensitizes WYE-354-induced anti-colon cancer activity in vitro and in vivo. Tumor Biology. 2016;37:1-10
16. Lang R M, Badano L P, Moravi V. et al. Recommendations for cardiac chamber quantification by echocardiography in adults: an update from the American Society of Echocardiography and the European Association of Cardiovascular Imaging. Eur Heart J Cardiovasc Imaging. 2016;16:1-39
17. Wang H, da Silva J, Alencar A. et al. Mast cell inhibition attenuates cardiac remodeling and diastolic dysfunction in middle-aged, ovariectomized Fischer344×Brown Norway rats. J Cardiovasc Pharmacol. 2016;68:49-57
18. Wang W, Wang H, Geng Q X. et al. Augmentation of autophagy by atorvastatin via Akt/mTOR pathway in spontaneously hypertensive rats. Hypertens Res. 2015;38:813-20
19. Zhao Z, Wang H, Lin M. et al. GPR30 decreases cardiac chymase/angiotensin II by inhibiting local mast cell number. Biochem Biophys Res Commun. 2015;459:131-36
20. Livak K J, Schmittgen TD. Analysis of relative gene expression data using real-time quantitative PCR and the 2(-Delta Delta C(T)) method. Methods. 2001;25:402-8
21. Johnson KR, Nicodemusjohnson J, Spindler MJ. et al. Genome-wide gene expression analysis shows AKAP13-mediated PKD1 signaling regulates the transcriptional response to cardiac hypertrophy. PLoS One. 2015;10:e0132474
22. Venardos K, De Jong KA, Elkamie M. et al. The PKD inhibitor CID755673 enhances cardiac function in diabetic db/db mice. PloS One. 2015;10:e0120934
23. Zhao L, Cheng G, Jin R. et al. Deletion of interleukin-6 attenuates pressure overload-induced left ventricular hypertrophy and dysfunction. Circ Res. 2016;118:1918-29
24. Gatica D, Chiong M, Lavandero S. et al. Molecular mechanisms of autophagy in the cardiovascular system. Circ Res. 2015;116:456-67
25. Xu X, Hua Y, Nair S. et al. Macrophage migration inhibitory factor deletion exacerbates pressure overload-induced cardiac hypertrophy through mitigating autophagy. Hypertension. 2014;63:490-9
26. Shirakabe A, Ikeda Y, Sciarretta S. et al. Aging and autophagy in the heart. Circ Res. 2016;118:1563-76
27. Linton P, Gurney M, Sengstock D. et al. This old heart: cardiac aging and autophagy. J Mol Cell Cardiol. 2014;40:44-54
28. Cao DJ, Wang ZV, Battiprolu PK. et al. Histone deacetylase (HDAC) inhibitors attenuate cardiac hypertrophy by suppressing autophagy. Proc Natl Acad Sci USA. 2011;108:4123-8
29. Liu CC, Chen RH. KLHL20 links the ubiquitin-proteasome system to autophagy termination. Autophagy. 2016;12:890-1
30. Flynn JM, O'Leary MN, Zambataro CA. et al. Late-life rapamycin treatment reverses age-related heart dysfunction. Aging Cell. 2013;12:851-62
31. Ge D, Han L, Huang S. et al. Identification of a novel MTOR activator and discovery of a competing endogenous RNA regulating autophagy in vascular endothelial cells. Autophagy. 2014;10:957-71
32. Sciarretta S, Volpe M, Sadoshima J. Mammalian target of rapamycin signaling in cardiac physiology and disease. Circ Res. 2014;114:549-64
33. Shaw R. LKB1 and AMP-activated protein kinase control of mTOR signalling and growth. Acta Physiologica. 2009;6:65-80
34. Chen B, Ma Y, Meng R. et al. Activation of AMPK inhibits cardiomyocyte hypertrophy by modulating of the FOXO1/MuRF1 signaling pathway in vitro. Acta Pharmacol Sin. 2010;31:798-804
35. Aránguiz-Urroz P, Canales J, Copaja M. et al. Beta 2-adrenergic receptor regulates cardiac fibroblast autophagy and collagen degradation. Biochim Biophys Acta. 2011;1812:23-31
36. Liu S, Chen S, Li M. et al. Autophagy activation attenuates angiotensin II-induced cardiac fibrosis. Arch Biochem Biophys. 2016;590:37-47
37. Gu J, Wei H, Song Z P. et al. Rapamycin inhibits cardiac hypertrophy by promoting autophagy via the MEK/ERK/Beclin-1 pathway. Front Physiol. 2016;7:104
Author contact
![]() Corresponding author: Zhuo Zhao, MD, PhD, Department of Cardiology, Jinan Central Hospital, Affiliated with Shandong University, Jinan, Shandong 250013, P.R. China. Tel: (+86) 531-82965022; Fax: (+86) 531-82506006; E-mail: zhaozhuo1230com.
Corresponding author: Zhuo Zhao, MD, PhD, Department of Cardiology, Jinan Central Hospital, Affiliated with Shandong University, Jinan, Shandong 250013, P.R. China. Tel: (+86) 531-82965022; Fax: (+86) 531-82506006; E-mail: zhaozhuo1230com.