Impact Factor ISSN: 1449-2288
- Issue 12; 2026
- Issue 11; 2026
- Issue 10; 2026
- Issue 9; 2026
- Issue 8; 2026
- Volume 22; 2026
- Past Issues
- Advance Articles
- Editorial Board
- Cover Images
- Index & Coverage
- Cover Suggestion
- Special Issues
Introduction
Materials and Methods
Results
Discussion
Conclusion
Abbreviations
Acknowledgements
References

 Global reach, higher impact
Int J Biol Sci 2017; 13(5):532-544. doi:10.7150/ijbs.18775 This issue Cite
Research Paper
Increased expression of thyroid hormone responsive protein (THRSP) is the result but not the cause of higher intramuscular fat content in cattle
Lisa Schering1 ![]() , Elke Albrecht1, Katrin Komolka1, Christa Kühn2, 3, Steffen Maak1
, Elke Albrecht1, Katrin Komolka1, Christa Kühn2, 3, Steffen Maak1
1. Institute of Muscle Biology and Growth, Leibniz Institute for Farm Animal Biology (FBN), D-18196 Dummerstorf, Germany;
2. Institute of Genome Biology, Leibniz Institute for Farm Animal Biology (FBN), D-18196 Dummerstorf, Germany;
3. Faculty of Agricultural and Environmental Sciences, University Rostock, D-18059 Rostock, Germany.
Received 2016-12-15; Accepted 2017-2-20; Published 2017-4-10
Abstract

Thyroid hormone responsive protein (THRSP) is known to be involved in lipogenic processes in rodents. In cattle, THRSP could be a potential molecular marker for intramuscular fat (IMF) deposition since mRNA abundance was frequently found to be increased in skeletal muscle with high IMF content compared to those with low IMF. The aim of this study was to elucidate the background of this differential expression and to evaluate the role of THRSP as candidate for increased IMF content in cattle. By combination of mRNA and protein analyses, we could demonstrate that THRSP is present mainly in nuclei of adipose tissue, in intramuscular fat cells and associated cells, and in cells of the portal triad of liver, whereas muscle cells did not express THRSP. Cell culture analyses revealed furthermore that THRSP is expressed in mature adipocytes rather than in early stages of adipogenesis. Collectively, our data support the putative role of THRSP as transcriptional regulator and demonstrate that an increased expression of THRSP in M. longissimus is a consequence of but not the reason for a higher number of intramuscular adipocytes in cattle with enhanced IMF deposition.
Keywords: THRSP, intramuscular fat, cattle.
Introduction
Thyroid hormone responsive protein (THRSP) was first described as Spot 14 (S14) in rats [1]. The authors identified the protein after in vitro translation of hepatic RNA treated with different doses of triiodothyronine. THRSP is expressed in liver, mammary gland, white and brown adipose tissue of rats [1,2] and located in the nucleus or cytosol [3-5]. In rodents it is suggested to augment the cellular content of lipogenic enzymes like fatty acid synthase in hepatocytes [6, 7] and in adipocytes [8]. Kirschner & Mariash [9] found a strong correlation between body mass index in humans and fasting induced downregulation of THRSP mRNA. However, a study of Ortega et al. [10] suggests that human THRSP mRNA amount is inversely associated with obesity. Significant downregulation of Thrsp mRNA in response to a 36-hours-fasting period was also observed in rat liver whereas caloric restriction did not influence mRNA abundance [11].
Intramuscular fat (IMF) also called marbling is a major determinant of beef quality because of its positive influence on flavor and palatability [12]. There are large differences in the ability of different cattle breeds to deposit IMF in M. longissimus dorsi (MLD) under similar feeding conditions [13]. However, the underlying molecular mechanisms determining fat storage and distribution are widely unknown [14]. Consequently, the identification and characterization of candidates for IMF deposition in cattle have been in the focus of numerous studies [15-19]. The gene encoding THRSP was repeatedly named a candidate for different IMF in MLD and an important regulator of adipogenesis and lipogenesis in cattle [17, 19-24].
The THRSP gene attracted attention in beef cattle due to its increased mRNA abundance in skeletal muscle of highly marbled crossbred cattle (Wagyu × Hereford) compared to Piedmontese × Hereford cattle with low marbling [17]. Higher mRNA abundance of THRSP in MLD was also found in our study in F2‐bulls (Charolais × Holstein) with high IMF compared to those with low IMF [25, 26]. Several experiments in cattle indicated that THRSP mRNA expression increases with age of the animals and is affected by diet and age of weaning [19, 27, 28]. In all of these studies, THRSP mRNA was measured in samples of MLD comprising different amounts of intramuscular fat cells beside other cell types. Consequently, our study aimed at the elucidation of apparent mRNA expression differences of the gene by identification of its cellular origin. Furthermore, we employed western blot analyses and immuno-histochemistry to provide first data on protein amounts and (sub-)cellular localization of THRSP in skeletal muscle tissue of cattle.
Materials and Methods
Animals and tissue samples
Animal care and tissue collection procedures followed the guidelines of the German Law of Animal Protection and the experimental protocol was approved by our own institutional board (Animal Protection Board of the Leibniz Institute for Farm Animal Biology) as well as by the Animal Care Committee of the State Mecklenburg-Western Pomerania, Germany (State Office for Agriculture, Food Safety and Fishery; LALLF M-V/TSD/7221.3-2.1-010/03).
For this study 20 bulls were selected for either high (7.0 ± 0.6 %, n = 10) or low (1.9 ± 0.6 %, n = 10) IMF content [26] from a F2-cross of Charolais × Holstein [29]. Bulls were kept and fed under standardized conditions and slaughtered at an age of 18 months. Details of sampling and phenotyping were described in [30]. Samples of MLD, subcutaneous fat (SCF) and liver were taken, snap-frozen in liquid nitrogen and stored at -80 °C until further processing.
DNA and RNA isolation, cDNA synthesis
DNA was extracted from 30 mg liver by phenol/chlorophorm/isopropanol precipitation after proteinase K treatment according to standard procedures. For RNA isolation, SCF was homogenized in QIAzol lysis reagent (Qiagen, Hilden, Germany) with the homogenizer Polytron PT 1200 E (Kinematica, Littau-Luzern, Switzerland) and total RNA was extracted with the RNeasy Lipid Tissue Mini Kit (Qiagen) according to the manufacturer's instructions. Muscle tissue was homogenized using the Xiril Dispomix (Xiril, Hombrechtikon, Switzerland) and QIAzol lysis reagent (Qiagen) as described by the manufacturer. The RNA was isolated and purified with NucleoSpin Extract II reagent (Macherey-Nagel, Dueren, Germany) according to manufacturer's guidelines. Liver tissue was also homogenized using the Xiril Dispomix. RNA was extracted and purified with the RNeasy Mini Kit (Qiagen) as recommended by the manufacturer. Total RNA was quantified with a NanoDrop ND-1000 spectrophotometer (Peqlab, Erlangen, Germany). The RNA integrity was determined with an Experion Automated Electrophoresis System using the RNA StdSens analysis chip (Bio-Rad, Munich, Germany). First strand cDNA was synthesized from 100 ng total RNA of the respective tissue in 20 µl reaction volume using iScript cDNASynthesis Kit with a blend of oligo(dT) and random hexamer primers (Bio-Rad) according to the provided protocol.
Sampling of muscle and fat cells from MLD by laser capture microdissection (LCM) and cDNA preparation
Muscle fibers and fat cells were prepared from unstained, dehydrated cross-sections of MLD by LCM as described elsewhere [31]. Briefly, 12 µm thick serial cryo-sections of MLD samples were prepared (CM 3050 S, Leica Microsystems, Wetzlar, Germany) of which one was used as control, transferred into a vial with lysis buffer and stored at -80 °C until further processing. Further sections were attached to PALM membrane slides (PALM, Bernried, Germany) and air-dried for 10 s. Dehydration was done by placing the slides in different concentrations of ethanol for 30 s each and in xylene for 5 min. Finally, the slides were air-dried for 5 min under a fume hood. Muscle fibers and adipocytes were sampled separately from these slides using a laser capture microdissection device (MicroBeam, PALM). One hundred to 300 cells per sample and cell type were collected in an adhesive cap of a vial and lysed in RLT buffer (RNeasy Micro Kit, Qiagen). The lysates were stored at -80 °C until further use. Total RNA was extracted separately from lysates of unstained control sections and of both cell types with the RNeasy Micro Kit (Qiagen). Reverse transcription into cDNA was done as described above except that the total amount of isolated RNA was used without prior measurements.
Isolation of primary bovine stromal vascular cells
SCF was removed from the MLD region of a cow and transported in pre-warmed extraction medium (DMEM/F12 (Sigma-Aldrich, Taufkirchen, Germany) with 15 mM NaHCO3 (Carl Roth, Karlsruhe, Germany), 1000 IU/ml penicillin, 1 mg/ml streptomycin, and 25 µm/ml amphotericin B (Biochrom, Berlin, Germany) into the cell laboratory. All subsequent work for cell isolation and cultivation was conducted under strict sterile conditions. First, the adipose tissue was washed with phosphate buffered saline (PBS) with 1000 IU/ml penicillin and 1 mg/ml streptomycin. Visible non-adipose tissue was removed. The SCF was cut into small pieces and transferred into 50 ml centrifuge tubes. To extract the stromal vascular cells from the tissue matrix, an enzymatic digestion was done with a digestion medium (DMEM/F12 with 15 mM NaHCO3, 100 mM HEPES (Carl Roth), 1.5 % BSA (Sigma-Aldrich) and 2 mg/ml collagenase I (Biochrom)) for 1 hour at 37 °C in a water bath with continuous shaking. Two ml digestion medium were used per g tissue. After digestion, the suspension was transferred to an Erlenmeyer flask and was diluted with five volumes of post-digestion medium (DMEM/F12 with 15 mM NaHCO3, and 100 mM HEPES) and filtered through a 180 µm nylon mesh filter (Merck Millipore, Darmstadt, Germany). The obtained filtrate was then centrifuged at 300 × g for 10 min at 4 °C. The supernatant, consisting of mature adipocytes was discarded. The pellet containing the stromal vascular cells was resuspended with culture medium (DMEM/F12 (PAN-Biotech, Aidenbach, Germany), with 10 % FBS (Thermo Fisher Scientific, Darmstadt, Germany), 100 U/ml penicillin, 100 µg/ml streptomycin, 2.5 µg/ml amphotericin B, and 4 mmol/l glutamine (Biochrom)). The cell suspension was then filtered through a nylon mesh filter with a mesh size of 30 µm (Merck Millipore). This step was followed by a further centrifugation at 300 × g for 10 min at 4 °C. After the pellet was re-suspended in culture medium, the cells were seeded into uncoated 10 mm cell culture dishes (Sarstedt, Nuembrecht, Germany) with a density of about 1 × 10⁵ cells/cm2 in culture medium. The cells were cultured under standard conditions (37 °C, 6 % CO2, 90 % humidity). After 24 hours, the adherent cells were washed with PBS with 1000 IU/ml penicillin and 1 mg/ml streptomycin and incubated with fresh culture medium. After incubation for 48 or 72 h passaging of the cells was carried out using a trypsin/EDTA solution in PBS (0.05 %/0.02 %, Biochrom). The passaged cells proliferated in culture medium to a confluence of 60-80 % and were then harvested again by using the trypsin/EDTA solution. The cell count and the percentage of viable cells were determined by InvitrogenTM CountessTM automated cell counter (Thermo Fisher Scientific, Braunschweig, Germany). Until further use, the cells were stored in liquid nitrogen in aliquots (1 ml) at a cell count of 0.5-1.0 × 10⁶ cells/ml in freezing medium consisting of culture medium with 30 % FBS and 20 % dimethyl sulfoxide (DMSO, Carl Roth).
Cell culture and RNA preparation
The murine preadipocyte line 3T3-L1 was purchased from LGC Standards (Wesel, Germany). Cells were seeded into 6-well culture plates (Greiner Bio-One, Frickenhausen, Germany) at a density of 100,000 cells per well and cultivated at 37 °C, 6 % CO2 und 90 % humidity in 2 ml proliferation medium (DMEM with 10 % newborn calf serum (NCS), 100 U/ml penicillin, and 100 µg/ml streptomycin (Biochrom)). Medium was changed every 48 hours. Confluence was reached at day 6 and this day was considered as day 0 of differentiation. Differentiation of the cells to mature adipocytes was induced by a medium containing DMEM, 10 % FBS, 100 IU/ml penicillin, 100 µg/ml streptomycin, and 1 µg/ml insulin (Sigma-Aldrich). Medium was exchanged every 48 hours. The differentiation period lasted 19 days. Cells were then either stained with Oil Red O solution or used for extraction of total RNA with the RNeasy Lipid Tissue Mini Kit (Qiagen) as described by the manufacturer.
The bovine stromal vascular cells were thawed, seeded into 6-well culture plates at a cell density of 50,000 cells per well and cultivated under standard conditions in culture medium. The medium was changed every 48 hours. Once the cells had reached their full confluence, various induction or differentiation additives were used to induce the storage of lipids. The induction lasted two days and the differentiation period required 14 days. Here we used and analyzed three different protocols for the differentiation procedure of primary bovine preadipocytes (Table 1). RNA was extracted at day 0 (start), day 2 and day 12 using the RNeasy Lipid Tissue Mini Kit as recommended by the manufacturer. The results represent the average gene expression measured across the three protocols.
Protocols for the induction and differentiation of primary bovine stromal vascular cells
| Protocol | 1 | 2 | 3 |
|---|---|---|---|
| Induction medium | DMEM/F12 100 IU/ml penicillin 100 µg/ml streptomycin 2.5 µg/ml amphotericin B 4 mmol/l glutamine 2.5 µg/ml insulin 0.25 µM Dexamethasone | DMEM/F12 100 IU/ml penicillin 100 µg/ml streptomycin 2.5 µg/ml amphotericin B 4 mmol/l glutamine 5 µg/ml insulin 0.25 µM dexamethasone | DMEM/F12 100 IU/ml penicillin 100 µg/ml streptomycin 2.5 µg/ml amphotericin B 4 mmol/l glutamine 5 µg/ml insulin 150 µM oleic acid 0.25 µM dexamethasone |
| Differentiation medium | DMEM/F12 100 IU/ml penicillin 100 µg/ml streptomycin 2.5 µg/ml amphotericin B 4 mmol/l glutamine 2.5 µg/ml insulin | DMEM/F12 100 IU/ml penicillin 100 µg/ml streptomycin 2.5 µg/ml amphotericin B 4 mmol/l glutamine 5 µg/ml insulin | DMEM/F12 100 IU/ml penicillin 100 µg/ml streptomycin 2.5 µg/ml amphotericin B 4 mmol/l glutamine 5 µg/ml insulin 150 µM oleic acid |
Oil Red O staining
At days 0 (differentiation start), 2, 7, 14 and 19 of the differentiation process 3T3-L1 cells were stained with Oil Red O. For preparing the Oil Red O stock solution, 0.5 % Oil Red O (Waldeck GmbH & Co. KG, Muenster, Germany) was stirred in isopropanol (Carl Roth) overnight. The fresh Oil Red O working solution was prepared immediately before use. Six parts of the Oil Red O stock solution were mixed with four parts of distilled water, incubated for 10 min and filtered. Cells were washed twice with pre-warmed PBS and fixed with 4 % paraformaldehyde (PFA, Carl Roth) in PBS for 30 min at room temperature. Cells were washed twice with PBS again. Then 60 % isopropanol was added to the cells for 3 min. Subsequently, cells were incubated with fresh Oil Red O working solution for 5 min. Wells were rinsed 3-5 times with distilled water, were covered with gelatin (Waldeck GmbH & Co. KG) and cover slip (Carl Roth) and analyzed with an inverse phase contrast microscope (Nikon Diaphot 300; Nikon, Düsseldorf, Germany), a CC-12 camera (OSIS, Muenster, Germany) and the image analysis software Cell^F (OSIS).
Analysis of gene expression by Reverse Transcriptase-quantitative PCR (RT-qPCR)
Expression of THRSP, further selected genes and reference genes (Tables 2) in bovine tissue samples, isolated and cultured cells was analyzed by RT-qPCR (iCycler MyiQ 2 with iQ detection system, Bio-Rad). The gene expression was measured in duplicates for each sample in 10 µl reaction volumes containing 10 ng cDNA, 2 µM of the respective forward and reverse primers and 5 µl SYBR Green Supermix (Bio-Rad). Primers were designed with Primer 3web (Version 4.0.0, http://primer3.ut.ee/) and synthesized by Sigma-Aldrich. Primer sequences are given in Tables 2 and 3. The amplification comprised an initial denaturation step (95 °C for 3 min) followed by 45 cycles (95 °C for 10 s, 60 °C for 30 s, 70 °C for 45 s). Specificity of the amplicons was confirmed by melting curve analysis and sequencing. Cycle threshold values (CT) were determined automatically by iQ5 Software (Version 2.1.97.1001, Bio-Rad). Amplification efficiency was calculated from a standard curve derived from a serial dilution for B2M (1:1, 1:20, 1:40, 1:80, 1:100) or from a six point serial dilution for the rest of the genes (1:1, 1:10, 1:20, 1:40, 1:80, 1:160, 1:320). The efficiency E was calculated as E=10 -1/slope of standard curve-1. The expression values obtained in MLD samples were normalized to beta-2-microglobulin (B2M) and topoisomerase II beta (TOP2B), whereas ubiquitously-expressed transcript (UXT) and ribosomal protein S9 (RPS9) were used for normalization of expression values obtained in liver. The normalization of expression values from SCF and primary bovine adipocytes was done with UXT and B2M. Efficiency-corrected, normalized expression values were calculated with the REST algorithm and tested for significant group differences (REST 2009, Version 2.0.13, Qiagen). Results are expressed as fold-changes of the high IMF group to the low IMF group with standard errors as described by [32]. Normalization of THRSP mRNA abundance to expression of B2M and TOP2B was done by the NRQ method for subsequent correlation analysis [33]. In LCM samples, the mRNA abundance of THRSP and marker genes for either muscle fibers (fatty acid binding protein 3, FABP3) or adipocytes (fatty acid binding protein 4, FABP4) was measured. Due to the low amounts of RNA isolated from dissected cells no reference genes could be analyzed. The data for THRSP are given as raw CT values.
Primer sequences for RT-qPCR with bovine cDNA
| Gene | Sequence (5'→3') forward | Sequence (5'→3') reverse | GenBank acc. no. | Product size (bp) |
|---|---|---|---|---|
| B2M | CAGCTGCTGCAAGGATGG | ATTTCAATCTGGGGTGGATG | NM_173893 | 184 |
| FABP3 | GCGTTCTCTGTCGTCTTTCC | CTTGGTCATATTGCCCACCT | NM_174313 | 154 |
| FABP4 | GGATGGAAAATCAACCACCA | TGGACAACGTATCCAGCAGA | NM_174314.2 | 174 |
| MID1IP1 | CAGTTGCCCCGTCCTAAGTA | GATAGAGGTGCCACAGGACA | NM_001076383.1 | 157 |
| MLXIPL | CATCACACACATCTCTGCGG | GCACAGGTTAATGGCAGCAT | NM_001205408.1 | 241 |
| RPS9 | GCTGATCGGCGAGTATGGGCT | GCCGCCGCAACAGGGCATTA | NM_001101152 | 152 |
| THRSP | GAGATGGAAGAGGCTGAGGA | CAGGGTAAGATGGGTGAGGA | NM_001040533 | 108 |
| TOP2B | AAGAAAACAGCACCGAAAGG | GAGGTCTGAGGGGAAGAGGT | XM_002698750 | 174 |
| UXT | TCATGGCGACGCCCCCTAAAC | AAAGCCTCGTAGCGCAGCACT | NM_001037471 | 70 |
Primer sequences for RT-qPCR with murine cDNA
| Gene | Sequence (5'→3') forward | Sequence (5'→3') reverse | GenBank acc. no. | Product size (bp) |
|---|---|---|---|---|
| B2m | CCTGGTCTTTCTGGTGCTTG | TTTCCCGTTCTTCAGCATTT | NM_009735 | 175 |
| Cebpb | TGCGGGGTTGTTGATGTTTT | TGCTCGAAACGGAAAAGGTT | NM_001287739.1 | 156 |
| Dlk1 | AGTATGGATTCTGCGAGGCT | GCAAGCCCGAACGTCTATTT | NR_033813.1 | 179 |
| Fabp4 | TTTCCTTCAAACTGGGCGTG | CATTCCACCACCAGCTTGTC | NM_024406.2 | 166 |
| Hprt | TCCTCCTCAGACCGCTTTT | CCTGGTTCATCATCGCTAATC | NM_013556 | 90 |
| Thrsp | TACCAGGAAATGACAGGGCA | TGCAACCAAGTCCACAGATG | NM_009381.2 | 183 |
In the murine cell line (3T3-L1) the mRNA expression of following genes was measured: protein delta homolog (Dlk1), CCAAT/enhancer binding protein beta (Cebpb), Fabp4 and Thrsp. The normalization of the expression values was performed with B2m and hypoxanthine-guanine phosphoribosyltransferase (Hprt). The relative gene expression analyses of the cell line and the primary cells were calculated using the 2-ΔCt method for normalized individual data points recommended by Schmittgen & Livak [34].
Partial sequence analysis of the THRSP locus
Amplification of genomic DNA fragments was performed with standard PCR and specific primers (Table 4) in samples of 3 bulls from each group. Putative regulatory regions of the gene (700 bp 5' of the transcription start and 1,000 bp 3' of the stop codon containing the 3'‐untranslated region) were included in screening for single nucleotide polymorphisms (SNPs). After purification of the amplicons with the High Pure PCR Product Purification Kit (Roche Diagnostics, Mannheim, Germany), the PCR products were subjected to cycle sequencing and analyzed on an ABI PRISM 310 Genetic Analyzer (Applied Biosystems, Darmstadt, Germany). The PCR primers were also used for DNA sequencing. Sequences were compared using CLC Main Workbench (v. 7.7, CLCbio, Aarhus, Denmark).
Primer sequences for the amplification and sequencing of regions of the THRSP locus
| Primer | Sequence (5'→3') forward | Primer | Sequence (5'→3') reverse | Product size (bp) |
|---|---|---|---|---|
| THRSP_F1_Ex1 | ATCCTGTCAAACTGCTGTGC | THRSP_R1_Ex1 | ATCATCACCACCTGCTCCAT | 195 |
| THRSP_F2_Ex1 | GTGGTGATGATCCCCAGTCT | THRSP_R2_Ex1 | TTCCTGGGTTGTGGTCTCAA | 509 |
| THRSP_F1_Ex1 | ATCCTGTCAAACTGCTGTGC | THRSP_R3_Ex1 | CTTCAGTCTCAGCTCCCTCG | 383 |
| THRSP_F3_vEx1 | AGTGGGCAGCTTGGTCTTAG | THRSP_R1_Ex1 | ATCATCACCACCTGCTCCAT | 475 |
| THRSP_F4_vEx1 | ACTGGAGGTGAGAGAGAGGT | THRSP_R4_vEx1 | CTAAGACCAAGCTGCCCACT | 387 |
| THRSP_F5_Ex2 | TTTTGCAGCTCTGACAACCA | THRSP_R5_Ex2 | GACGAGGAAATTTAGGCCACA | 550 |
| THRSP_F6_Ex2 | AACAGTAAGTCAAAAGCATCTGG | THRSP_R6_Ex2 | AAGATCCCACACAACTAGAATGA | 491 |
Protein isolation
Muscle and liver samples were homogenized with Xiril Dispomix and SCF samples with Polytron PT 1200 E in CelLytic MT lyses reagent and Protease Inhibitor Cocktail (Sigma-Aldrich) to extract total protein according to manufacturer's instructions. Tissue lysates were centrifuged at 20817 × g for 15 min to remove insoluble compartments. The supernatant was transferred to a new reaction tube. For separate extraction of nuclear and cytoplasmic proteins of muscle, liver, and SCF the Nuclear/Cytosol Fractionation Kit (Promokine, Heidelberg, Germany) was used. First, tissues were homogenized in PBS and Protease Inhibitor Cocktail (Sigma-Aldrich) as described before. Protein fractions were obtained following the manufacturer's protocol. Protein amounts were measured using a Nanodrop ND-1000 spectrophotometer (Peqlab, VWR, Erlangen, Germany). Protein extracts and fractions were stored at -80 °C until further use.
Western blot
A custom made antibody against a 16 amino acids synthetic peptide representing the C-terminal part of bovine THRSP (Pierce Custom Antibody Service, Thermo Scientific) was used for detection of THRSP in bovine tissues. Antibodies against MLXIPL (LS-C31701) and MID1IP1 (LS-C139634) were purchased from Biozol (Eching, Germany). Twenty micrograms of extracted protein were diluted in Laemmli buffer with ß-mercaptoethanol, denatured at 95 °C for 5 min, and separated on Criterion TGX 12 % gels (Bio-Rad). A molecular weight marker (Page Ruler, Thermo Scientific) was separated simultaneously for determination of the molecular weight of the detected protein bands. Proteins were transferred to a polyvinylidene difluoride (PVDF) membrane (Trans-Blot Turbo transfer pack, Bio-Rad) using a semi dry blotter (Trans-Blot, Bio-Rad). Additionally, 15 % SDS-PAGE 10 × 10 cm mini gels were used and blotted on PVDF membranes (Carl Roth) for tests of specificity of antibody binding. Equal loading of the gels and proper transfer of the proteins to the membranes were verified by Coomassie staining according to standard procedures. Membranes were blocked for 1 h in either 1× Roti-Block (Carl Roth), for detection of THRSP, or 5 % non-fat dry milk (Carl Roth) in Tris-buffered saline (TBS), for detection of MLXIPL and MID1IP1. Membranes were incubated with primary antibodies (THRSP diluted 1:500, MLXIPL and MID1IP1 diluted 1:2,000) over night at 4 °C. The specificity of THRSP antibody binding was tested against recombinant protein (CSB-EP726789MO, Biotrend, Cologne, Germany) and using parallel blots, which were incubated with either the antibody or with the antibody blocked with the antigen peptide prior to incubation. Membranes were incubated with Horseradish peroxidase-conjugated secondary antibody (rabbit IgG TrueBlot, 1:25,000; 18-8,816, eBioscience, Frankfurt, Germany) and the antibody label was detected with chemiluminescence substrate (SuperSignal West Femto Substrat, Thermo Scientific). Unspecific binding of the secondary antibody was excluded by incubating negative controls in PBS-T containing 2 % goat serum instead of primary antibody. A Chemocam HR-16 imager (INTAS, Göttingen, Germany) equipped with LabImage 1D software (Kapelan Bio-Imaging, Leipzig, Germany) were used to record and quantify intensity of specific bands.
Immuno-histochemical and -cytochemical analysis
Immuno-fluorescent staining was performed in bovine tissue sections and the murine cell line 3T3-L1. Different bovine tissues were cryo-sectioned with a thickness of 10 µm (liver), 12 µm (MLD) and 25 µm (SCF) using a CM3050 S cryostat microtome (Leica). Sections were air dried for 15 min and fixed with 4 % PFA in PBS. The 3T3-L1 cells were washed two times with PBS before fixation with 4 % PFA in PBS. After washing with PBS, liver sections were incubated with filtrated Sudan Black (0.1 % in 70 % ethanol, Waldeck GmbH & Co. KG) for 30 min and washed twice with PBS. Fat was extracted from SCF sections by gently shaking the slide in chloroform (Carl Roth) for 5 min. Afterwards, permeabilization with PBS-TritonX100 (PBST) was performed for 10 min in all tissue sections and the 3T3-L1 cells. Unspecific binding of the secondary antibody was blocked using 10 % goat serum in PBST for 15 min. Incubation with the bovine specific polyclonal antibody rabbit anti-THRSP8816 (1:300, Pierce Custom Antibody Service) was done for 2 h at room temperature in a humidity chamber. Slides and wells were washed 3 times with PBST. Specific binding of primary antibody was detected with the respective Alexa Fluor 488 goat anti-rabbit IgG secondary antibody (MoBiTec, Goettingen, Germany, 1:1,000 in PBST). Then, slides and wells were washed with PBST 3 times for 10 min. Nuclei were counterstained with Hoechst 33258 (Sigma-Aldrich, 1:10,000 in PBST). Finally, slides and wells were washed twice with PBS for 5 min and 5 min with distilled water and subsequently covered using ProLong Diamond Antifade Mountant (Thermo Scientific) and appropriate cover-slips. Immuno-fluorescence was visualized with a Nikon Microphot SA fluorescence microscope (Nikon) and an image analysis system equipped with CELL^F software and a CC- 12 high resolution color camera (OSIS).
Statistical analyses
The statistical analyses for the evaluation of the mRNA expression results obtained by RT-qPCR are described in respective paragraphs. For analyses of normalized protein abundances, the MIXED procedure of SAS (Version 9.2, 2009, SAS Inst. Inc., Cary, USA) was used with the fixed factor IMF group, separately for each tissue, and the repeated factor blot to account for repeated measures of each sample. For post-hoc tests the Tukey-Kramer-correction was used. The presented values are LSMEANs with SE. Relationships between traits were calculated as Pearson correlation coefficients with SAS.
Results
THRSP mRNA is increased in muscle of highly marbled cattle at 18 months of age
An initial analysis confirmed a significantly higher expression of THRSP in MLD of bulls with high IMF compared to those with low IMF (Figure 1; Fold change [FC] = 1.7, p < 0.05). In contrast to results in muscle, expression in liver and subcutaneous fat was not different between both groups (Figure 1).
mRNA-expression of THRSP in different bovine tissues (n = 10 per group) Expression was normalized to UXT and B2M (subcutaneous fat (SCF)), UXT and RPS9 (liver), and B2M and TOP2B (M. longissimus dorsi (MLD)). Graphs show group means (duplicate measurements) with standard errors calculated by REST software [32].
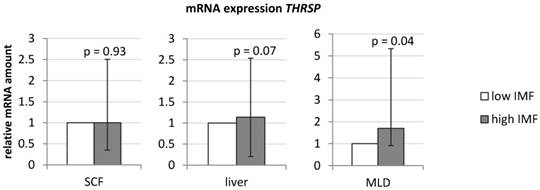
The normalized mRNA abundance of THRSP in MLD was significantly correlated with the IMF content (r = 0.47; p < 0.05).
Next, we measured the expression of a potential regulator of THRSP - carbohydrate-responsive element-binding protein (MLXIPL). This gene was not or only weakly detectable in muscle samples making a comparison between both groups impossible. MLXIPL1 was stronger expressed in SCF, but no differences were observed between both groups (1.15-fold, p = 0.21). MID1 interacting protein 1 (MID1IP1) is putatively interacting with THRSP. However, its mRNA abundance did neither differ in MLD samples of both groups (1.0-fold, p = 0.98) nor in SCF (1.19-fold, p = 0.29). To account for potential effects of microRNAs (miRNAs) on gene expression, we analyzed respective data from an array analysis (unpublished data). A total of 66 miRNAs were predicted by TargetScan 7.1 [35] to bind to the 3' - UTR of bovine THRSP. None of the miRNAs were differentially expressed in MLD of our sample (q > 0.10, data not shown).
No single nucleotide polymorphisms (SNPs) in putative regulatory sequences of the bovine THRSP locus
We screened the bovine THRSP locus for SNPs with focus on regions with potential effect on gene expression. Besides the complete coding region, 700 base pairs (bp) 5' of the transcription start and 1,000 bp 3' of the stop codon were included. An overview about the structure of the locus is given in Figure 2.
Structure of the bovine THRSP locus Primer positions are marked by arrows. Exons are given as grey boxes, introns and intergenic sequences are white. Numbers refer to nucleotide positions relative to the start of the mRNA. Single nucleotide polymorphisms are marked above the graph.
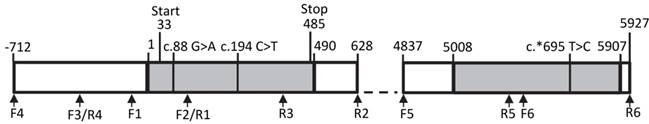
We identified three SNPs in our sample. Two SNPs, c.88G>A and c.194C>T, have been described before, whereas SNP c.*695T>C in the 3' untranslated region (3'-UTR) of THRSP is novel. However, this polymorphism segregates only in one family of the investigated F2-population. None of the SNPs was found in motifs with potential effects on gene expression like promotor or miR-binding sites. In addition, in silico-analyses showed that putative upstream regulatory elements described for the human and rat genes are not conserved in cattle.
THRSP is mainly expressed in adipocytes in bovine skeletal muscle tissue
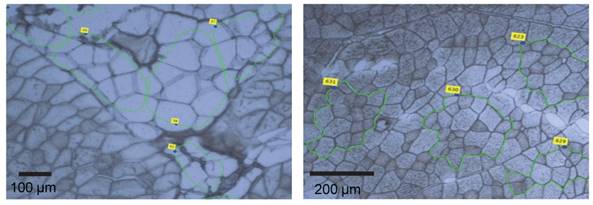
Our analyses did not reveal any structural alteration at the bovine THRSP locus explaining the observed increased expression in MLD of highly marbled cattle. Therefore, we set out to clarify whether the increased amount of THRSP mRNA in skeletal muscle of bulls with higher IMF was caused by the larger number of adipocytes in the sample. We dissected bovine skeletal muscle tissue by laser capture microdissection (LCM, Figure 3 a, b) and analyzed the expression of THRSP in adipocytes and muscle cells separately. The expression of FABP3 and FABP4 was used as indicator for the purity of the cell preparations. As expected, FABP4 was exclusively expressed in adipocytes whereas FABP3 expression was restricted to muscle cells. THRSP expression was observed in adipocytes but not in myocytes in three independent experiments (Table 5).
Sections of M. longissimus dorsi (MLD) used for laser capture microdissection (LCM) Adipocytes (a) and myocytes (b) were marked (green lines) and sampled by LCM.
Expression of THRSP and cell type markers in dissected adipocytes and myocytes from bovine M. longissimus dorsi (MLD)
| Genes | Cell type | |
|---|---|---|
| Adipocytes | Myocytes | |
| FABP3 | ND | 26.9±0.99 |
| FABP4 | 20.4±1.04 | ND |
| THRSP | 26.6±0.66 | ND |
(CT values obtained by RT-qPCR, n =3, means ± standard deviations)
ND - not detected
THRSP protein is predominantly located in nuclei
Serial sections were prepared from samples used for LCM (Figure 3 a, b) for detection of THRSP in MLD by immuno-histochemistry. Specific fluorescence signals were detected in nuclei of adipocytes and in nuclei of adipose tissue associated cells which were not further characterized (data not shown). In accordance with results from LCM experiments THRSP was not detected in myocytes.
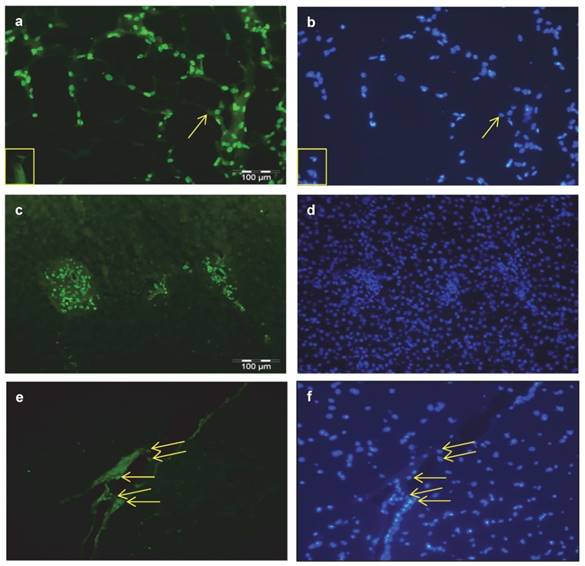
Additional immuno-histochemical investigations were done in sections of bovine SCF, liver, and MLD. THRSP was abundantly detected in nuclei of subcutaneous adipocytes and in nuclei of cells of the interstitium (Figure 4 a). In liver samples expression of THRSP was restricted to nuclei of cells of the portal triad (Figure 4 c) whereas in skeletal muscle cells other than myocytes were stained exclusively (Figure 4 e). The corresponding stainings of nuclei in the tissues are given in figure 4 b, d, and f.
Cellular localization of THRSP in bovine tissues Immuno-histochemical localization of THRSP was performed in cross-sections of subcutaneous fat (SCF) (a), liver (c) and M. longissimus dorsi (MLD) (e). THRSP was detected with a specific bovine antibody and the secondary antibody Alexa Fluor® 488 goat anti-rabbit IgG. It was found in the nuclei of fat cells, interstitial cells and cells of the portal triad. Identical images of each tissue presented with nuclear staining permit a direct comparison (b, d, f). The yellow arrows point to THRSP located in nuclei and adipocytes without THRSP signal are marked by a yellow box.
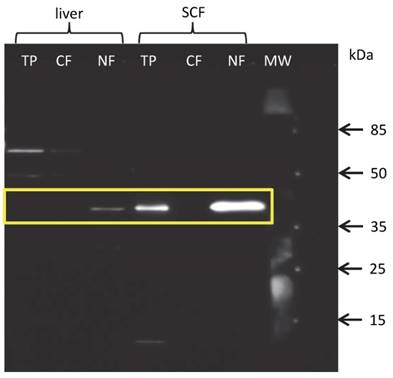
Since the protein amount of THRSP in total protein extracts from liver and MLD was below the detection limit of western blot and our results of immuno-histochemical analysis strongly suggested a nuclear localization of THRSP protein, we hence extracted proteins from nuclear and cytoplasmic fractions separately. As expected, THRSP could be detected exclusively in the nuclear fractions of all tissues. Representative blots for liver and SCF are shown in figure 5. The signals were strongest in SCF and weak in liver and MLD. This is in accordance with the results from the immuno-histochemical examination.
Western blot with fractionated proteins of bovine liver and subcutaneous fat (SCF) THRSP could be detected in the nuclear (NF) but not cytoplasmic (CF) fraction of liver and SCF. THRSP could also be detected in the total protein extract (TP) from SCF. MW - molecular weight marker.
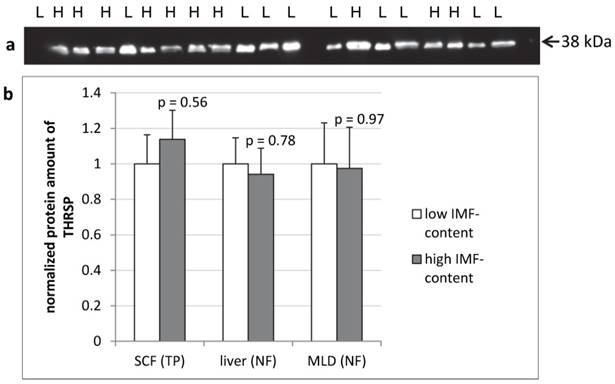
The protein amount of THRSP was analyzed by semi-quantitative western blots of total protein from SCF and of nuclear fractions from liver and MLD. In none of the tissues significant differences in THRSP protein amounts were found between cattle with high or low intramuscular fat deposition (Figure 6).
THRSP protein expression in different bovine tissues of F2-bulls (n = 10 per group) Representative protein bands from the total protein fraction of subcutaneous fat (SCF) (a). The dilution of the antibody was 1:500. Comparison of THRSP protein amount in bovine tissues from bulls with high and low intramuscular fat content (IMF-content) in M. longissimus dorsi (MLD) (b). H - high IMF-content, L - low IMF-content, NF - nuclear fraction, TP - total protein
THRSP is expressed late during adipogenic differentiation
We then analyzed mRNA abundance during differentiation of 3T3-L1 cells to get insight into the ontogenetic course of Thrsp expression (Figure 7). Cells were harvested at days 0, 2, 7, 14, and 19 of differentiation. Besides Thrsp, several established markers were co-analyzed. Dlk1, also known as preadipocyte factor 1, was typically down-regulated in the course of differentiation. Cebpb represents an early marker of fat cell differentiation and was expressed constantly during the differentiation process. This indicated that differentiating preadipocytes were still present in culture at all stages. The expression of Fabp4 was only detectable when lipid droplets became visible in the cells.
(a) Oil Red O staining of 3T3-L1 cells at different time points of the differentiation to mature adipocytes. (b) Relative mRNA expression of different genes in 3T3-L1 cells. The expression values of the target genes (duplicate analyses) were normalized with B2m and Hprt. The analysis and the comparison of the relative gene expression were conducted with the 2-ΔCt method for normalized individual data points recommended by Schmittgen & Livak [34].
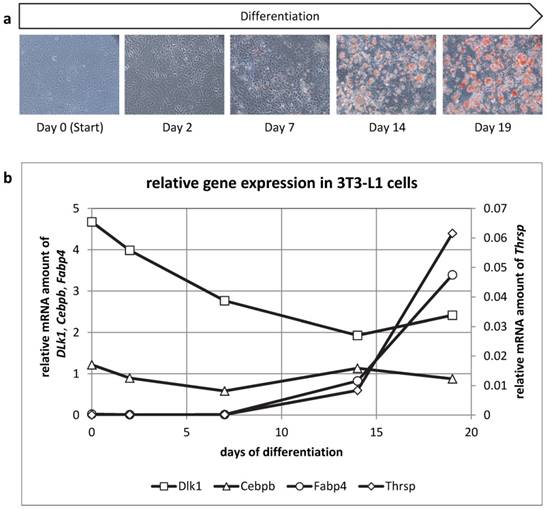
The mRNA abundance of Thrsp followed the pattern observed for Fabp4 indicating that only differentiated adipocytes express this factor. Of note, Thrsp is a very low abundance transcript compared to the markers used in this study.
Immuno-cytochemical analyses of cultured 3T3-L1 cells at days 2 and 21 after start of differentiation confirmed the localization of Dlk1 in cytoplasm of adipocytes without visible lipid accumulation at both time points and nuclear signals for Cebpb in small adipocytes with beginning lipid accumulation but revealed no results for Thrsp at day 21 (data not shown).
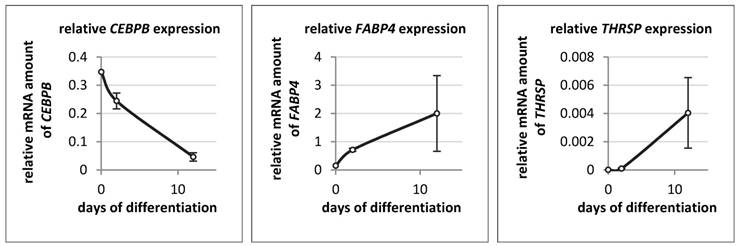
The expression of THRSP, FABP4, and CEBPB was also measured in bovine primary stromal vascular cells on day 0 (start), day 2 and day 12 of differentiation (Figure 8). The expression patterns of THRSP and FABP4 were similar to those in the murine cell line. THRSP was even lower expressed than in 3T3-L1 cells. In contrast to the murine cell line the mRNA concentration of CEBPB declined markedly with progression of differentiation of bovine adipocytes.
Relative mRNA expression of different genes in bovine primary stromal vascular cells (n = 3 per time point) The expression of target genes was normalized to B2M and UXT. The analysis and the comparison of relative gene expression was done as described by Schmittgen & Livak [34].
Discussion
The search for markers and predictors of intramuscular fat content in cattle muscle is of economic importance since it influences profitability of beef production [19]. Consequently, numerous studies aimed at the identification and characterization of putative candidate genes for those markers. Breeds with extreme differences in IMF were investigated (e.g. [36, 37] as well as crosses using those breeds [17]). Highly different expressions of THRSP and further genes related to lipid metabolism were frequently found in these investigations. Later bioinformatics approaches named THRSP as a top candidate related to IMF [19, 38]. However, Hudson et al. [19] stated a surprisingly late divergence of the expression of THRSP and further genes between high and low marbled breeds at 20 months of age and later. We observed a significantly increased THRSP expression in MLD of bulls with high IMF compared to those with low IMF within a cross between Charolais and Holstein at 18 months of age [25, 26]. It was the first time that differences in THRSP mRNA abundance in MLD were found in a population with the same genetic background and not between breeds or between breed crosses. However, we found no expression differences in other tissues like liver and SCF in this study indicating that there is no systemic difference in the activity of THRSP between bulls with high and low IMF. Against this background, we set out to elucidate the apparent expression differences of THRSP between highly and lowly marbled muscles.
DNA sequence analysis revealed no differences at the THRSP locus which could explain expression differences between both groups by cis-regulatory elements. Two coding SNPs with known association to milk fat, fatty acid composition and water binding capacity of beef [39-43] and a newly identified SNP segregate in our F2-population but were not associated to IMF [44]. Furthermore, no SNPs in putative regulatory sequences at the THRSP locus were found. Abundance of microRNA with THRSP as potential target was also not different between groups (unpublished data). Collectively, this indicates no differential cis regulation of the expression of THRSP in our sample.
We demonstrated that THRSP mRNA is only detectable in adipocytes and interstitial cells of skeletal muscle. Thus, most likely the mRNA abundance of THRSP is related to the number of adipocytes and associated cells in the MLD sample rather than to genuine expression differences of the gene. Support for this assumption comes from an earlier investigation of dissected IMF from highly marbled Japanese Black steers and Holstein steers with lower marbling under identical feeding regimen. No differences in THRSP expression were found in dissected IMF despite large differences in IMF content of the MLD [45]. The positive correlation between IMF content of the MLD samples and mRNA abundance of THRSP in our study provides further evidence for a similar THRSP expression in mature intramuscular adipocytes regardless whether they are located in highly or lowly marbled MLD of cattle.
Data on THRSP protein were only available for rodent liver, cell lines, and human adipocytes so far (e.g. [10, 46, 47]). We demonstrated a mainly nuclear localization of THRSP protein in mature bovine adipocytes, in undetermined adipose-associated cells and in specific regions of liver by immuno-histochemistry and western blot of subcellular fractions with an antibody against bovine THRSP. The nuclear localization is in accordance with the proposed function of THRSP as transcriptional regulator [5, 22-24, 48]. It must be noted however, that THRSP seems not to be a transcription factor because the protein contains no recognized DNA-binding motifs. Therefore, THRSP is referred to as transcriptional co-activator or, more general as transcriptional regulator with unknown function [48]. Provided that THRSP is active in transcriptional regulation, its direct effects should be restricted to the cells where it is expressed. A higher apparent THRSP expression in a heterogeneous tissue like skeletal muscle is consequently linked with a higher number of THRSP expressing cells (mostly adipocytes) rather than with a higher expression within a cell. No differences in THRSP protein amounts were found in the nuclear fraction of MLD samples with different IMF content. This is in contrast to the results at mRNA level and might be caused by the lower sensitivity of western blotting compared to RT-qPCR. Moreover, posttranslational cleavage of mRNA may have contributed to this result.
The polyclonal antibody against bovine THRSP reacted consistently with a protein of ~37 kDa in bovine tissues. Specificity of the detected band could be shown by its disappearance after pre-incubation of the antibody with recombinant THRSP. However, the predicted molecular weight of bovine THRSP is roughly 17 kDa and thus much smaller than the observed immuno-reactive band. The most likely explanation is that THRSP exists as homodimer. This property of THRSP was described already by Cunningham et al. [48]. The authors found THRSP to form homodimers in mammalian cells and suggested the formation of a tripartite complex with an unknown 36 kDa protein for its full regulatory activity.
In liver, THRSP protein was mainly found in nuclei of cells in the periportal triads. A localization of THRSP in specific liver zones where lipogenic enzymes are active was described for the rat before [5]. Although, these authors observed a perivenous rather than a periportal localization of THRSP in rat liver, some lipogenic enzymes were assigned to the periportal triads by another group [49]. Consequently, our data support a role of THRSP as transcriptional regulator of lipogenic enzymes in bovine liver.
It is well-known that THRSP is regulated by hormonal and dietary intervention in rat tissues [5, 50]. Numerous investigations in dairy and beef cattle have shown that dietary components like fatty acids, carbohydrates and excess energy affect the expression of THRSP in mammary epithelium, adipose, liver, and muscle [21, 23, 27, 51]. Notably, the IMF content of the MLD - estimated as marbling score - was not significantly different in two of those experiments conducted in beef cattle [21, 27]. Dietary intervention (high starch vs. low starch diet) resulted in opposite effects on THRSP mRNA abundance in both studies, however. A compensatory physiological mechanism was suggested as possible explanation for a higher expression of THRSP in low-starch fed animals of the second study [27]. In a recent investigation, significant down-regulation of THRSP was found in steers with a low estimated genomic breeding value for iron content of the meat compared to those with a high one [52]. The authors assumed a reduced lipogenic activity in muscle with lower iron content. However, the IMF content differed only slightly between both groups of animals (low iron: 2.9 % vs. high: 2.3 %) contradicting this notion.
Conclusion
Our study in cattle without intervention demonstrated that THRSP was not regulated by cis-elements close to the gene and the apparently increased THRSP mRNA abundance was presumably a function of an increasing number of intramuscular adipocytes. This was supported by immuno-histochemical detection of THRSP exclusively in adipocytes and related cells. Since intramuscular adipocytes are not evenly distributed in MLD, composition of small samples may be affected by differing numbers of included adipocytes.
In summary, our results indicate that a high expression of THRSP in skeletal muscle reflects the result of an increased intramuscular adipogenesis, is not involved in the early events, and is consequently not a reason of varying IMF content in MLD of cattle. The localization of THRSP mRNA and protein in nuclei of adipocytes provides experimental support for the suggested role of THRSP in transcriptional regulation of lipid metabolism.
Abbreviations
BSA: bovine serum albumin; IMF: intramuscular fat; LCM: laser capture microdissection; MLD: Musculus longissimus dorsi; PBS: phosphate buffered saline; PBST: PBS-TritonX100; PFA: paraformaldehyde; SCF: subcutaneous fat.
Acknowledgements
This work was supported by a grant of the Leibniz Association (grant no. SAW-2013-FBN-3). We wish to thank Elke Schwitulla, Stefanie Foß and Marlies Fuchs for expert technical assistance. The publication of this article was funded by the Open Access Fund of the Leibniz Association and the Open Access Fund of the Leibniz Institute for Farm Animal Biology (FBN).
Competing Interests
The authors have declared that no competing interest exists.
References
1. Seelig S, Liaw C, Towle HC. et al. Thyroid hormone attenuates and augments hepatic gene expression at a pretranslational level. Proc Natl Acad Sci U S A. 1981;78:4733-4737
2. Jump DB & Oppenheimer JH. High basal expression and 3,5,3'-triiodothyronine regulation of messenger ribonucleic acid S14 in lipogenic tissues. Endocrinology. 1985;117:2259-2266
3. Tao TY & Towle HC. Coordinate regulation of rat liver genes by thyroid hormone and dietary carbohydrate. Ann N Y Acad Sci. 1986;478:20-30
4. Kinlaw WB, Ling NC, Oppenheimer JH. Identification of rat S14 protein and comparison of its regulation with that of mRNA S14 employing synthetic peptide antisera. J Biol Chem. 1989;264:19779-19783
5. Kinlaw WB, Tron P, Friedmann AS. Nuclear localization and hepatic zonation of rat "spot 14" protein: immunohistochemical investigation employing anti-fusion protein antibodies. Endocrinology. 1992;131:3120-3122
6. Clarke SD, Armstrong MK, Jump DB. Dietary polyunsaturated fats uniquely suppress rat liver fatty acid synthase and S14 mRNA content. J Nutr. 1990;120:225-231
7. Kinlaw WB, Church JL, Harmon J. et al. Direct evidence for a role of the "spot 14" protein in the regulation of lipid synthesis. J Biol Chem. 1995;270:16615-16618
8. Freake HC & Moon YK. Hormonal and nutritional regulation of lipogenic enzyme mRNA levels in rat primary white and brown adipocytes. J Nutr Sci Vitaminol (Tokyo). 2003;49:40-46
9. Kirschner LS & Mariash CN. Adipose S14 mRNA is abnormally regulated in obese subjects. Thyroid. 1999;9:143-148
10. Ortega FJ, Vazquez-Martin A, Moreno-Navarrete JM. et al. Thyroid hormone responsive Spot 14 increases during differentiation of human adipocytes and its expression is down-regulated in obese subjects. Int J Obes (Lond). 2010;34:487-499
11. de Vries EM, van Beeren HC, Ackermans MT. et al. Differential effects of fasting vs food restriction on liver thyroid hormone metabolism in male rats. J Endocrinol. 2015;224:25-35
12. Platter WJ, Tatum JD, Belk KE. et al. Effects of marbling and shear force on consumers' willingness to pay for beef strip loin steaks. J Anim Sci. 2005;83:890-899
13. Gotoh T, Albrecht E, Teuscher F. et al. Differences in muscle and fat accretion in Japanese Black and European cattle. Meat Sci. 2009;82:300-308
14. Dodson MV, Jiang Z, Chen J. et al. Allied industry approaches to alter intramuscular fat content and composition in beef animals. J Food Sci. 2010;75:R1-8
15. Sasaki Y, Nagai K, Nagata Y. et al. Exploration of genes showing intramuscular fat deposition-associated expression changes in musculus longissimus muscle. Anim Genet. 2006;37:40-46
16. Lee SH, Park EW, Cho YM. et al. Identification of differentially expressed genes related to intramuscular fat development in the early and late fattening stages of hanwoo steers. J Biochem Mol Biol. 2007;40:757-764
17. Wang YH, Bower NI, Reverter A. et al. Gene expression patterns during intramuscular fat development in cattle. J Anim Sci. 2009;87:119-130
18. Barendse W. Haplotype analysis improved evidence for candidate genes for intramuscular fat percentage from a genome wide association study of cattle. PLoS One. 2011;6:e29601
19. Hudson NJ, Reverter A, Greenwood PL. et al. Longitudinal muscle gene expression patterns associated with differential intramuscular fat in cattle. Animal. 2015;9:650-659
20. Moisá SJ, Shike DW, Faulkner DB. et al. Central Role of the PPARγ Gene Network in Coordinating Beef Cattle Intramuscular Adipogenesis in Response to Weaning Age and Nutrition. Gene Regul Syst Bio. 2014;8:17-32
21. Graugnard DE, Piantoni P, Bionaz M. et al. Adipogenic and energy metabolism gene networks in longissimus lumborum during rapid post-weaning growth in Angus and Angus x Simmental cattle fed high-starch or low-starch diets. BMC Genomics. 2009;10:142
22. Harvatine KJ, Bauman DE. SREBP1 and thyroid hormone responsive spot 14 (S14) are involved in the regulation of bovine mammary lipid synthesis during diet-induced milk fat depression and treatment with CLA. J Nutr. 2006;136:2468-2474
23. Invernizzi G, Thering BJ, McGuire MA. et al. Sustained upregulation of stearoyl-CoA desaturase in bovine mammary tissue with contrasting changes in milk fat synthesis and lipogenic gene networks caused by lipid supplements. Funct Integr Genomics. 2010;10:561-575
24. Ji P, Drackley JK, Khan MJ. et al. Inflammation- and lipid metabolism-related gene network expression in visceral and subcutaneous adipose depots of Holstein cows. J Dairy Sci. 2014;97:3441-3448
25. Komolka K, Albrecht E, Kuehn C. et al. Expression of thyroid hormone responsive protein (THRSP) is related to intramuscular fat in a F2-cross between Charolais and Holstein. Archiv Latinoam Prod Animal. 2014;22:618-621
26. Komolka K, Ponsuksili S, Albrecht E. et al. Gene expression profile of Musculus longissimus dorsi in bulls of a Charolais × Holstein F2-cross with divergent intramuscular fat content. Genom Data. 2015;7:131-133
27. Graugnard DE, Berger LL, Faulkner DB. et al. High-starch diets induce precocious adipogenic gene network up-regulation in longissimus lumborum of early-weaned Angus cattle. Br J Nutr. 2010;103:953-963
28. de Jager N, Hudson NJ, Reverter A. et al. Gene expression phenotypes for lipid metabolism and intramuscular fat in skeletal muscle of cattle. J Anim Sci. 2013;91:1112-1128
29. Kuehn C, Bellmann O, Voigt J. et al. An experimental approach for studying the genetic and physiological background of nutrient tranformation in cattle with respect to nutrient secretion and accretion type. Arch Tierz. 2002;45:317-330
30. Pfuhl R, Bellmann O, Kuehn C. et al. Beef versus dairy cattle: a comparison of feed conversion, carcass composition, and meat quality. Arch Tierz. 2007;50:59-70
31. Albrecht E, Gotoh T, Ebara F. et al. Technical note: Determination of cell-specific gene expression in bovine skeletal muscle tissue using laser microdissection and reverse-transcription quantitative polymerase chain reaction. J Anim Sci. 2011;89:4339-4343
32. Pfaffl MW, Horgan GW, Dempfle L. Relative expression software tool (REST) for group-wise comparison and statistical analysis of relative expression results in real-time PCR. Nucleic Acids Res. 2002;30:e36
33. Hellemans J, Mortier G, De Paepe A. et al. qBase relative quantification framework and software for management and automated analysis of real-time quantitative PCR data. Genome Biol. 2007;8:R19
34. Schmittgen TD & Livak KJ. Analyzing real-time PCR data by the comparative C(T) method. Nat Protoc. 2008;3:1101-1108
35. Agarwal V, Bell GW, Nam JW. et al. Predicting effective microRNA target sites in mammalian mRNAs. Elife. 2015;4:e05005
36. Wang YH, Byrne KA, Reverter A. et al. Transcriptional profiling of skeletal muscle tissue from two breeds of cattle. Mamm Genome. 2005;16:201-210
37. Albrecht E, Komolka K, Ponsuksili S. et al. Transcriptome profiling of Musculus longissimus dorsi in two cattle breeds with different intramuscular fat deposition. Genom Data. 2016;7:109-111
38. Hudson NJ, Reverter A, Wang Y. et al. Inferring the transcriptional landscape of bovine skeletal muscle by integrating co-expression networks. PLoS One. 2009;4:e7249
39. Zhang XB, Zan LS, Wang HB. et al. Correlation of C184T Mutation in THRSP Gene with Meat Traits in the Qinchuan Cattle. Scientia Agricultura Sinica. 2009;42:4058-4065
40. Mancini G, Nicolazzi EL, Valentini A. et al. Association between single nucleotide polymorphisms (SNPs) and milk production traits in Italian Brown cattle. Livest Sci. 2013;157:93-99
41. Saatchi M, Garrick DJ, Tait RG Jr. et al. Genome-wide association and prediction of direct genomic breeding values for composition of fatty acids in Angus beef cattle. BMC Genomics. 2013;14:730
42. Fontanesi L, Calò DG, Galimberti G. et al. A candidate gene association study for nine economically important traits in Italian Holstein cattle. Anim Genet. 2014;45:576-580
43. Oh DY, Lee YS, La BM. et al. Identification of exonic nucleotide variants of the thyroid hormone responsive protein gene associated with carcass traits and Fatty Acid composition in korean cattle. Asian-Australas J Anim Sci. 2014;27:1373-1380
44. Albrecht E, Schering L, Dannenberger D. et al. Associations of SNPs in the THRSP gene with morphological and biochemical traits of longissimus muscle in F2 offspring of a Charolais × Holstein cross. J Anim Sci. 2015;93:65
45. Albrecht E, Gotoh T, Viergutz T. et al. Gene expression profile of intramuscular and subcutaneous fat in Japanese Black and Holstein steers. Proc 9th World Congr Genetics Appl Livest Prod (WCGALP), Leipzig, Germany. 2010 (ISBN 978-3-00-031608-1)
46. Brown SB, Maloney M, Kinlaw WB. "Spot 14" protein functions at the pretranslational level in the regulation of hepatic metabolism by thyroid hormone and glucose. J Biol Chem. 1997;272:2163-2166
47. Chou WY, Cheng YS, Ho CL. et al. Human spot 14 protein interacts physically and functionally with the thyroid receptor. Biochem Biophys Res Commun. 2007;357:133-138
48. Cunningham BA, Maloney M, Kinlaw WB. Spot 14 protein-protein interactions: evidence for both homo- and heterodimer formation in vivo. Endocrinology. 1997;138:5184-5188
49. Evans JL, Quistorff B, Witters LA. Zonation of hepatic lipogenic enzymes identified by dual-digilonin-pulse perfusion. Biochem J. 1989;259:821-829
50. Freake HC & Oppenheimer JH. Stimulation of S14 mRNA and lipogenesis in brown fat by hypothyroidism, cold exposure, and cafeteria feeding: evidence supporting a general role for S14 in lipogenesis and lipogenesis in the maintenance of thermogenesis. Proc Natl Acad Sci U S A. 1987;84:3070-3074
51. Kadegowda AK, Bionaz M, Piperova LS. et al. Peroxisome proliferator-activated receptor-gamma activation and long-chain fatty acids alter lipogenic gene networks in bovine mammary epithelial cells to various extents. J Dairy Sci. 2009;92:4276-4289
52. Diniz WJ, Coutinho LL, Tizioto PC. et al. Iron Content Affects Lipogenic Gene Expression in the Muscle of Nelore Beef Cattle. PLoS One. 2016;11:e0161160
Author contact
![]() Corresponding author: Dr. Lisa Schering. Institute of Muscle Biology and Growth, Leibniz Institute for Farm Animal Biology (FBN), D-18196 Dummerstorf, Germany. Tel: +493820868885; Email: scheringde
Corresponding author: Dr. Lisa Schering. Institute of Muscle Biology and Growth, Leibniz Institute for Farm Animal Biology (FBN), D-18196 Dummerstorf, Germany. Tel: +493820868885; Email: scheringde