Impact Factor ISSN: 1449-2288
- Issue 12; 2026
- Issue 11; 2026
- Issue 10; 2026
- Issue 9; 2026
- Issue 8; 2026
- Volume 22; 2026
- Past Issues
- Advance Articles
- Editorial Board
- Cover Images
- Index & Coverage
- Cover Suggestion
- Special Issues
Introduction
Results
Discussion
Materials & Methods
Supplementary Material
Acknowledgements
References

 Global reach, higher impact
Int J Biol Sci 2017; 13(5):588-603. doi:10.7150/ijbs.19517 This issue Cite
Research Paper
Recapitulating and Correcting Marfan Syndrome in a Cellular Model
Jung Woo Park1*, Li Yan1*, Chris Stoddard2, Xiaofang Wang2, Zhichao Yue3, Leann Crandall2, Tiwanna Robinson2, Yuxiao Chang3, Kyle Denton2, Enqin Li1, Bin Jiang1, Zhenwu Zhang1, Kristen Martins-Taylor2, Siu-Pok Yee2, Hong Nie4, Feng Gu5, Wei Si6, Ting Xie7, Lixia Yue8 ![]() , Ren-He Xu1, 2
, Ren-He Xu1, 2 ![]()
1. Faculty of Health Sciences, University of Macau, Taipa, Macau, China;
2. Department of Genetics and Genome Sciences, University of Connecticut Health Center, Farmington, Connecticut, USA;
3. Agricultural Genomes Institute at Shenzhen, Chinese Academy of Agricultural Sciences, Shenzhen, China;
4. Guangdong Province Key Laboratory of Pharmacodynamic Constituents of TCM and New Drugs Research, College of Pharmacy, Jinan University, Guangzhou, Guangdong, China;
5. School of Ophthalmology and Optometry, Eye Hospital, Wenzhou Medical University, State Key Laboratory Cultivation Base and Key Laboratory of Vision Science, Ministry of Health and Zhejiang Provincial Key Laboratory of Ophthalmology and Optometry, Wenzhou, Zhejiang, China;
6. Yunnan Key Laboratory of Primate Biomedical Research, Institute of Primate Translational Medicine, Kunming University of Science and Technology, Kunming, Yunnan, China;
7. Stowers Institute for Medical Research, Kansas City, Missouri, USA;
8. Department of Cell Biology, University of Connecticut Health Center, Farmington, Connecticut, USA.
* The first two authors contributed equally to this work.
Received 2017-2-6; Accepted 2017-2-24; Published 2017-4-10
Abstract

Marfan syndrome (MFS) is a connective tissue disorder caused by mutations in FBN1 gene, which encodes a key extracellular matrix protein FIBRILLIN-1. The haplosufficiency of FBN1 has been implicated in pathogenesis of MFS with manifestations primarily in cardiovascular, muscular, and ocular tissues. Due to limitations in animal models to study the late-onset diseases, human pluripotent stem cells (PSCs) offer a homogeneic tool for dissection of cellular and molecular pathogenic mechanism for MFS in vitro. Here, we first derived induced PSCs (iPSCs) from a MFS patient with a FBN1 mutation and corrected the mutation, thereby generating an isogenic “gain-of-function” control cells for the parental MFS iPSCs. Reversely, we knocked out FBN1 in both alleles in a wild-type (WT) human embryonic stem cell (ESC) line, which served as a loss-of-function model for MFS with the WT cells as an isogenic control. Mesenchymal stem cells derived from both FBN1-mutant iPSCs and -ESCs demonstrated reduced osteogenic differentiation and microfibril formation. We further demonstrated that vascular smooth muscle cells derived from FBN1-mutant iPSCs showed less sensitivity to carbachol as demonstrated by contractility and Ca2+ influx assay, compared to the isogenic controls cells. These findings were further supported by transcriptomic anaylsis of the cells. Therefore, this study based on both gain- and loss-of-function approaches confirmed the pathogenetic role of FBN1 mutations in these MFS-related phenotypic changes.
Keywords: Marfan syndrome, human pluripotent stem cells, disease modeling, genome editing, osteogenesis, smooth muscle.
Introduction
Marfan syndrome (MFS) is an autosomal dominant genetic disorder with defects primarily in the connective tissues and caused by mutations in the gene FIBRILLIN-1 (FBN1). It is a systemic disease, with an incidence of 1 in 3,000 to 5,000 individuals, of skeletal (disproportionate growth, scoliosis), ocular (lens dislocation and myopia), and cardiovascular (aortic root aneurysm and dissection) complications, among which a ruptured aortic aneurysm can be fatal. FBN1 is a large gene located on chromosome 15q21.1 made of 66 exons [1] and its gene product FBN1 is an abundant component of microfibrils in the extracellular matrix (ECM). It is composed primarily of repeated calcium binding epithelial growth factor-like domains and 8-cysteine residue domains, which are only found in FBNs and transforming growth factor β (TGFβ)-binding proteins [2]. FBN1 is expressed as early as 10.5 d.p.c, in the aortic sac in mouse, and the signal remains intense in the aortic arch and pulmonary artery [3, 4]. In adult, FBN1 is distributed in the skin, lung, kidney, vasculature, cartilage, tendon, muscle, cornea, and ciliary zonules. FBN1 polypeptide aggregates to form microfibrils, which confer the elastic nature of connective tissues. Microfibrils, via binding with TGFβ and BMP ligands, can sequester both TGFβ and BMP complexes in a highly contextual manner [5].
Two models have been proposed to elucidate MFS pathogenesis: (1) haploinsuffiency model in which the decreased FBN1 expression due to mutations is directly correlated to the severity of the disease, and (2) domainant negative effect model, in which abnormal FBN1 proteins perturb the polymerization of FBN1 to form microfibrils [6]. However, Judge et al. demonstrated that haplosufficieny in FBN1 is the major mechanism for MFS pathogenesis as overexpression of human FBN1 mutant polypeptide in wild-type (WT) mouse background showed no phenotypes associated with MFS, despite of the strong affinity to the normal Fbn1 [7]. Therefore, it is more likely that the decreased FBN1 level attenuate ECM integrity [8] and release extra TGFβ ligands, leading to MFS phenotypes [9]. TGFβ inhibitors have been found effective to improve pathologic manifestations in the lungs of mouse MFS models [9], mitigate arterial disease in MFS mice [10, 11] and the aortal aneurysm in MFS patients [12]. In addition, recent findings suggest that the elevated TGFβ signaling may result from epigenetic regulation of the SMAD2 promoter in the SMCs of aneurysmal aortic wall, probably due to a compensatory mechanism [13].
Since MFS studies have, so far, largely relied on animal models or post-onset human samples, they may not exactly reflect the early developmental defects in MFS patients, and using pre-onset human models might provide new insight into the MFS etiology. Patient-derived induced pluripotent stem cells (iPSCs) have offered unprecedented opportunities to model [14-16] and genetically treat diseases [17-20]. Recently, it has been shown that human pluripotent stem cells (hPSCs) including both embryonic stem cells (ESCs) and iPSCs that carry a FBN1 mutation had a reduced osteogenic differentiation, providing a potential tool to elucidate osteogenic defects in a human cellular model for MFS [21]. However, it is not entirely clear whether or not the phenotypes observed in this study is directly correlated to the FBN1 mutations or genetic variations between the MFS cells and WT controls. This is indeed a concern especially in the light that many studies have shown the importance of using proper isogenic controls for characterizing disease-related iPSCs [22-25].
In this study, we derived iPSC lines from skin fibroblasts of a MFS patient with a nonsense mutation in FBN1 gene, and corrected the mutation, for the first time, thus generating genetically identical isogenic control cells. In order to recapitulate the phenotypes associated with MFS, we differentiated both MFS and mutation-corrected (mc) iPSCs in parallel to cell types, which are often affected in MFS patients, mesenchymal stem cells (MSCs) and vascular smooth muscle cells (SMCs) to characterize potential MFS phenotypes. We found the mutation-associated phenotypic changes in microfibril formation, osteogenesis, contractility, and Ca2+ influx in these cells, which are consistent with their differential gene expression profiles. In addition, we mutated FBN1 in both alleles in hES3-derived ENVY (GFP+) human ESC (hESC) line, referred to ENVY thereinafter [26], and found similar phenotypic changes in MSCs differentiated from the wild-type and mutated ENVY hESC. Thus, this study via both gain- and loss-of-function approaches on hPSCs confirmed the pathogenetic role of FBN1 mutations in these phenotypic changes of SMCs and MSCs.
Results
Generation of iPSCs from skin fibroblasts of a MFS patient
By using a single excisable lentiviral vector to express OCT4, SOX2, KLF4, and C-MYC [27], we reprogrammed primary skin fibroblasts from a MFS patient (#GM21974) deposited at Coriell Cell Repositories. The patient was a 58-years-old female with aortic dissection, myopia, ascending aortic aneurysms, pectus carinatum, high-arched plate, and dental crowding. One allele of her FBN1 had a 2581C>T (R861X in amino acid) mutation in exon 22 that caused premature termination of FBN1. Two independent iPSC clones were generated through reprogramming. Clone 1 was used throughout the study, and clone 2 was used in some designated experiments. First, we confirmed the silencing of the expression from the transgenes in the MFS-iPSCs by RT-PCR analysis using primers, specific for the RNAs of the exogenous OCT4, SOX2, KLF4, and cMYC genes (Figure S1A).
The MFS-iPSCs expressed typical pluripotency markers, including TRA1-60, NANOG, OCT4, and SSEA4 (Figure 1A). We further demonstrated the pluripotency of MFS-iPSC by PluriTest® (an online software) on the basis of pluripotency and novelty scores [28] (Figure 1B). Following prolonged culture, MFS-iPSCs at passage 11 were karyotyped and found to have normal 46XX karyotype (Figure 1C). MFS-iPSCs could also form teratomas in severe combined immunodeficiency (SCID) mice (Figure 1D), suggesting their differentiation potential to develop into all the three germ layers.
Derivation of iPSCs from skin fibroblasts of a MFS patient. (A) Immunocytochemistry of iPSCs derived from the patient (MFS-iPSCs) for pluripotency markers with nuclei counterstained by DAPI. Scale bars, 100 μm. (B) PluriTest® of MFS-iPSCs. (C) Karyotype of MFS-iPSCs at passage 11. (D) MFS-iPSCs formed teratoma with tissues derived from the three germ layers. Scale bars, 200 μm. (E) Validation of the FBN1 mutation in both fibroblasts from the patient (MFS-Fib) and MFS-iPSCs. (F) Luciferase assay to report TGFβ signaling level in MFS-Fib and WT control fibroblasts (HDFα), *P < 0.01 and **P < 0.001.
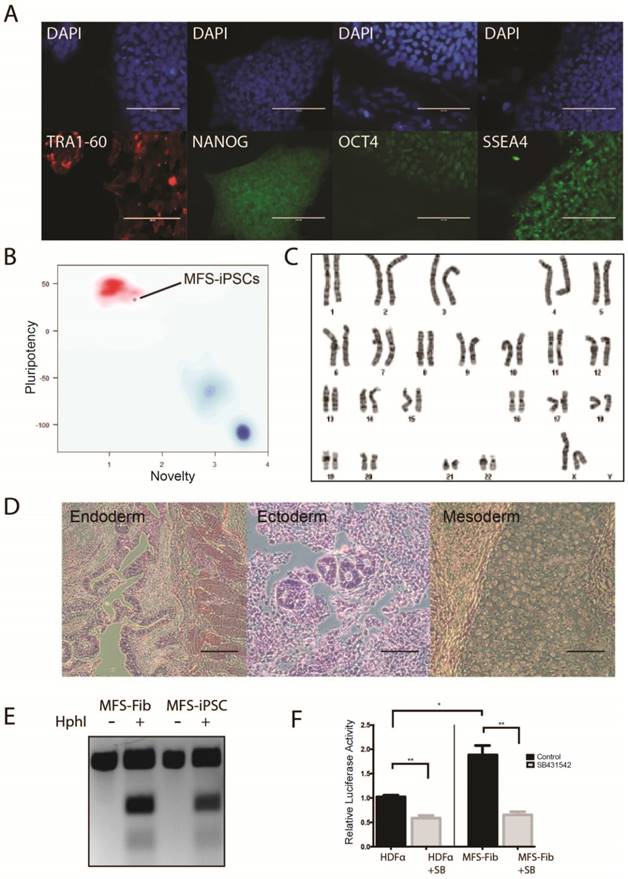
To validate that the MFS-iPSCs contain the FBN1 mutation as in the patient's fibroblasts, we amplified the genomic region containing the mutation site and analyzed the sequence by restriction fragment length polymorphism. The 2581C>T mutation in FBN1 creates a unique HphI restriction site. Following HphI digestion of PCR amplicons, three fragments were observed with the MFS fibroblasts and MFS-iPSCs, but only one fragment was observed with amplicons from the fibroblasts without the digestion (Figure 1E). This suggests that both MFS fibroblasts and MFS-iPSCs contained the same mutation in FBN1.
To test the TGFβ signaling level in the MFS cells, we transfected the MFS fibroblasts and the wild-type (WT) control fibroblasts HDFα with (TRE)12/TKprom-Luc [29], and then treated the cells with or without 10 μM SB431542 (an inhibitor of the TGFβ type II receptors) for 24 hours. Assay of relative luciferase activity in the cells demonstrated that the MFS fibroblasts had nearly 2-fold higher TGFβ signaling level than HDFα, and SB431542 inhibited the level in both groups (Figure 1F). However, no detectable difference was observed in luciferase activity between MFS- and WT-iPSCs primarily due to the lack of FBN1 expression in undifferentiated hES or iPSC resulting in no discernable difference in the TGFβ signaling level caused by FBN1 mutation (data not shown).
Correction of the FBN1 mutation
We and other have shown that genetic variations including copy number variations, loss of heterozygosity, and coding mutations exist among iPSC lines no matter they are derived from WT or patient samples [30-33]. Thus, it is essential to analyze patient-specific iPSC lines by comparing with isogenic control cell lines. We used TALEN-assisted genome editing to correct the FBN1 mutation in the MFS-iPSCs (clone 1). We constructed two TALENs that can bind to two adjacent regions of 18 and 17 bp, respectively, near the mutation, using the Golden Gate TALEN Assembly Kit (Addgene). One TALEN recognition sequence incorporated the mutant sequence to make binding specific to the mutant allele while limiting its ability to bind to the WT allele. This was done to specifically modify the mutant allele and limit cutting of the WT and corrected alleles.
A targeting vector was constructed by assembling a cassette including a 5' and 3' FBN1-homologous arms of 650 and 844 bp, respectively, which flanked the human phosphoglycerate kinase 1 (PGK) promoter and neomycin-resistant gene (neo) for positive selection, and the suicide gene diphtheria toxin A (DTA) downstream of the 3' homologous arm for negative selection (Figure 2A). The targeting vector included the WT sequence for mutation correction and a silent mutation that was in the recognition site for the second TALEN. The correction of the mutation along with the introduced silent mutation inhibited the ability for the TALEN pair to cut the targeting vector and more importantly the corrected allele once targeting occurred to limit unwanted mutations due to non-homologous end joining.
Correction of FBN1 mutation in the MFS-iPSC line. (A) A schematic of the genome targeting strategy for correcting the FBN1 mutation (marked with a red asterisk) in exon 22. Red lines denote the endogenous sequences after targeting. Primers used to validate the targeting and removal of the residual cassette are shown on the map. (B) Correct targeting was found in four of nine selected clones as verified through PCR. Amplicons from each clone were sequenced forward and reversely, which confirmed the correction of the mutation (2581C>T). Clone 2 is a representative positive clone and clone 8 a representative incorrectly targeted clone. (C) The removal of the cassette by transient transfection of a Cre-recombinase expression vector and validation PCR to show the removal of the cassette from the clones with asterisk above.
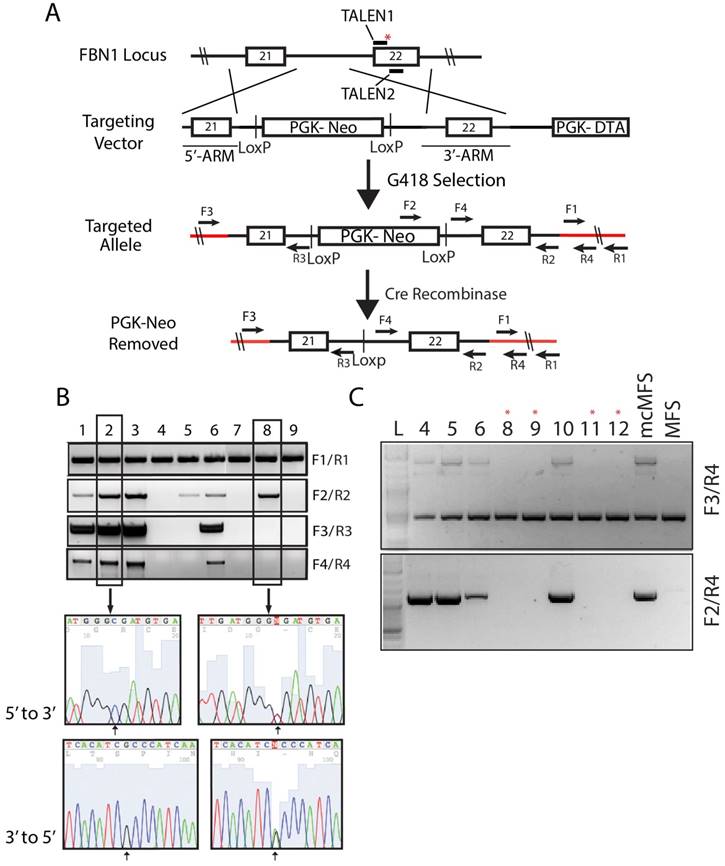
Following G418 selection, we isolated 30 cell clones and screened them via PCR using four sets of primers to determine the total gDNA (as a loading control), insertion of the designated elements from the targeting vector into the genome, and targeting at the disease locus, respectively. Out of the 30 clones, four (#1, 2, 3, and 6, nearly ~13%) were identified to have correctly targeted the disease allele (Figure 2B). Sequencing data for clones 2 (a corrected clone) and 8 (a non-corrected clone as a negative control) are shown as representatives to demonstrate the correction of the FBN1 mutation in the MFS-iPSCs (Figure 2B). A single cytosine peak in the 5' to 3' chromogram (or a guanine peak in the 3' to 5' chromogram) for clone 2 appears at the predicted mutation site, indicating that the mutation has been correctly reversed from thymine. Whereas, clone 8 shows mixed peaks at the corresponding position, indicating the heterogenic nature in the locus caused by the mutation in one allele and WT in another (Figure 2B). Thus, we successfully corrected the mutation in FBN1 in the MFS-iPSC line. Clone 1 of the four corrected (mcMFS-iPSC) clones was used throughout the study, and clone 2 was used in designated experiments. Both clones passed PluriTest based on their transcriptomes from microarray assay (Figure S1B), and remained positive for pluripotency markers OCT4, TRA1-81, and SSEA4 (Figure S1C) Thus, the gene targeting to correct the mutation did not compromise the pluripotency of MFS-iPSCs.
To assure that mcMFS-iPSCs be truly isogenic to MFS-iPSCs, we transiently transfected the mcMFS-iPSCs with a Cre-recombinase expression plasmid (pEF1α-CRE-IRES2-GFP) to remove the PGK-Neo cassette flanked by two LoxP sites. We sorted single GFP+ cells, expanded them to clones, and then verified the removal of the PGK-Neo cassette via PCR analysis on gDNA isolated from the GFP+ clones. Two forward primers (F3 and F4) aligning to the 5' flanking sequence and Neo, respectively, and one reverse primer (R4) aligning to the 3' flanking sequence were used to determine the removal of the cassette. Four clones were identified to have the transgene cassette removed by Cre-recombinase (clones #8, 9, 11, and 12) as denoted with red asterisks (Figure 2C). These clones were further expanded and tested for functional assays.
Reversal of FBN1 expression in MSCs differentiated from mcMFS-iPSCs
Since FBN1 expression is abundant in MSCs but barely detectable in human ESCs or iPSCs [34], we differentiated both MFS- and mcMFS-MSCs into MSCs to examine the level of FBN1 expression in these cell lines. Using western analysis, we found that FBN1 level was 3-4 fold lower in MFS-MSCs than mcMFS-MSCs (Figure 3A), attributable to the nonsense-mediated decay of FBN1 mRNA [35] from the disease allele present in MFS-MSCs but corrected in mcMFS-MSCs.
Characterization of the MFS- and mcMFS-MSCs. (A) Western analysis to detect FBN1 in MFS- and mcMFS-MSCs. (B) Immunocytochemistry for FBN1 and ELASTIN to detect microfibrils formation by MFS- and mcMFS-MSCs. Scale bars, 100 μM. (C) Western analysis to detect phosphorylated SMAD2 in MFS- and mcMFS-MSCs.
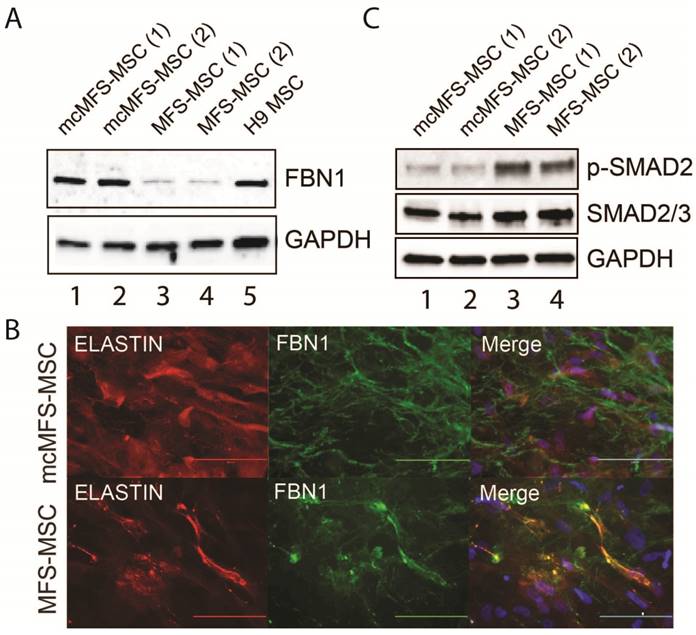
As stated above, FBN1 can polymerize to form microfibrils by interacting with other ECM components including integrins, fibronectins, fibulins, collagens, and ELASTIN. Using a method described by Noda, et al. [36], we tested both elastic fibers and microfibrils (determined via immunostaining for ELASTIN and FBN1, respectively), which appeared fragmented and attenuated in the culture of MFS-MSCs, compared to those in the cultures of mcMFS-MSCs (Figure 3B).
Furthermore, a hyperactive TGFβ signaling is a hallmark of the MFS phenotypes and we demonstrated a higher level of TGFβ signaling in skin fibroblasts from the MFS patient (Figure 1F). So, we decided to test the level of phosphorylated SMAD2, key effectors of TGFβ signaling, which was reduced in mcMFS-MSCs in comparison to MFS-MSCs (Figure 3C). This is consistent with the notion that FBN1 mutation results in the compromise of the ECM structure, which then promotes TGFβ release to enhance TGFβ signaling of affected cells [9]. Thus, the above data together suggest that correction of the FBN1 mutation not only reversed FBN1 expression and corrected deformation of the ECM structure, but also reduced TGFβ signaling in MSCs derived from the MFS-iPSCs.
Differentiation of MFS-iPSCs and mcMFS-iPSCs into SMCs is not affected by the FBN1 mutation
Using the aforementioned method [37, 38], we differentiated MFS-iPSCs and mcMFS-iPSCs into SMCs (named MFS-SMCs and mcMFS-SMCs, respectively). As shown in Figure 4A, embryoid bodies (EB) derived from both MFS- and mcMFS-iPSCs efficiently differentiated into hemangioblasts (HBs) after culture in the HB medium for 2 days, which proliferated and formed grape-like morphology in next 3-4 days. After a total of 6 days in the HB medium, HBs were cultured in the SMC medium to further differentiate into SMCs.
Characterization of SMCs differentiated from MFS- and mcMFS-iPSCs. (A) A schematic of the differentiation protocol and morphologies of embryoid bodies (EB), hemangioblasts (HB), and SMCs. Scale bars, 100 μm. (B) Immunocytochemistry for SMA in SMCs and calponin upon network formation by SMCs and endothelial cells. Scale bars in B, 50 μm for SMA, 100 μm for the other proteins. (C and D) RT-PCR (C) and flow cytometry (D) for expression of SMC markers.
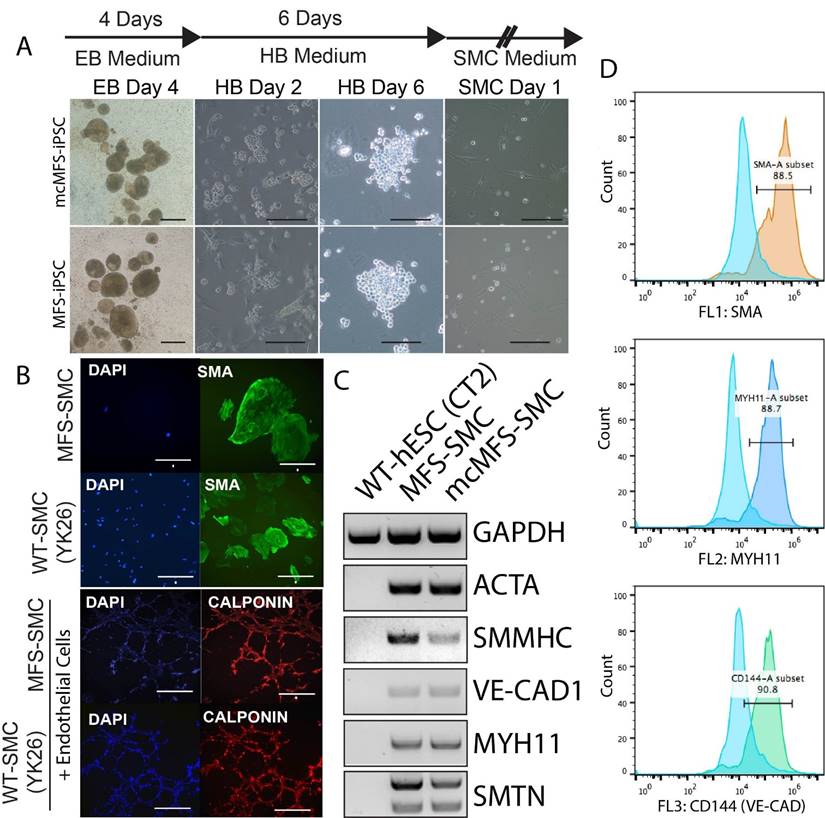
We performed immunocytochemistry on the differentiated cells and found that they were positive for a SMC marker alpha smooth muscle actin (SMA). Like WT control SMCs, the MFS-SMCs were positive for another SMC marker calponin, and formed networks after co-culture on Matrigel with endothelial cells differentiated from the same iPSC line (Figure 4B).
Next, RT-PCR analysis shows that SMC markers including ACTA2, SMMNC, MYH11, VE-CAD1, and SMTN were expressed in both MFS- and mcMFS-SMCs, but not in WT hESCs (CT2) as a negative control (Figure 4C). Furthermore, FACS analysis demonstrates that almost 88.5, 88.7, and 90.8% of cells differentiated from the MFS-iPSCs were SMA, MYH11, and VE-CAD (CD144) positive, respectively (Figure 4D). So were cells differentiated from the mcMFS-iPSCs (data not shown). These results suggest that both MFS- and mcMFS-iPSCs could efficiently differentiate into SMCs similar to WT-iPSCs, which was not affected by the FBN1 mutation.
Rescue of functional defects in MFS-iPSC derivatives
Since primary biological functions of SMCs include contraction to regulate blood pressure and blood flow, we measured the contractility of iPSC-derived SMCs in response to Carbachol [39]. We found that the ratio of contracting MFS-SMCs was about 1/4 of that for mcMFS-SMCs or WT-SMCs (Figure 5A), suggesting that the FBN1 mutation accounts for the reduced ratio of contracting cells, which can be reversed following correction of the mutation. This phenomenon is specifically related to the hyperactive TGFβ signaling as the contractility was restored to the level in a WT (YK26-iPSC derived SMCs) and mc-MFS-SMCs following addition of SB431542, an inhibitor of the TGFβ signaling (Figure 5A).
Functional characterization of MFS- and mcMFS-SMCs. (A) Percentage of contractile cells, *P < 0.01. SB stands for SB431542, and YK26 for SMCs differentiated from a WT human iPSC line YK26. (B) Changes of normalized F340/F380 Ca2+ signal elicited by CCh (left panel). Average changes (mean ± SEM) of the Ca2+ signal in mcMFS-SMCs (n = 21), MFS-SMCs (two clones with n = 15 for both), and WT (YK-26) SMCs (n = 20), *P < 0.01 (right panel). (C) Osteogenic differentiation from WT, MFS-, and mcMFS-iPSCs, followed by staining with Alizarin Red. Scale bars, 200 μm.
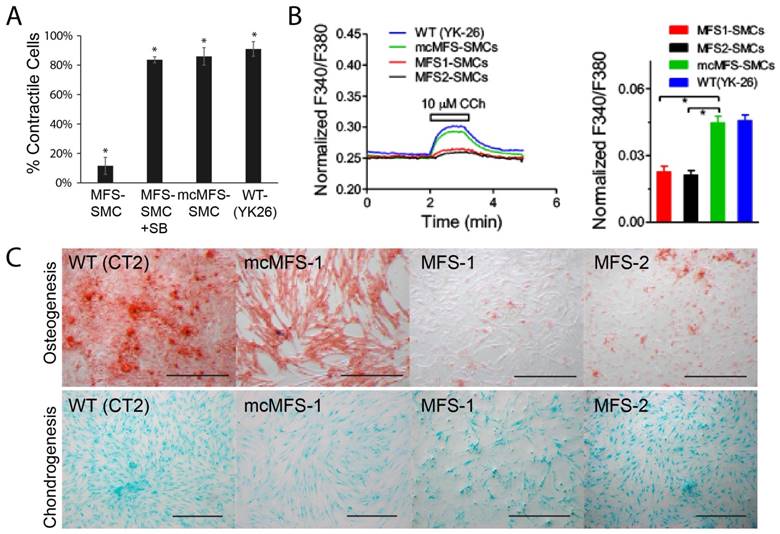
Next, since calcium signals are critical for contractility of SMCs, we measured calcium signals in MFS- and mcMFS-SMCs. As shown in Figure 5b, Ca2+ influx is represented as normalized F340/F380 ratio to 1-μM Ionomycin. Carbachol at 10 μM elicited much smaller Ca2+ influx in MFS-SMCs in comparison with mcMFS-SMCs, consistent with the reduced ratio of contracting cells in MFS-SMCs. Furthermore, average Ca2+ influx was higher in mcMFS-SMCs than MFS-MSCs (Figure 5B).
MFS is a disorder that mainly affects mesenchymal tissues, e.g., osteocytes, chondrocytes, and adipocytes. It has been known that MSCs derived from MFS-iPSCs and MFS-hESCs have reduced osteogenesis and enhanced chondrogenesis, which is attributed to hyperactive TGFβ signaling caused by FBN1 mutations in MFS-MSCs [21]. Thus, we tested whether correction of the FBN1 mutation would rescue any defects in MSCs derived from iPSCs. Indeed, we found that mcMFS-iPSC derived MSCs had the osteogenesis potential equivalent to WT (CT2) cells, whereas osteogenesis was remarkably impaired in two independent MFS-MSC clones MFS-1 and -2 (Figure 5C). However, we did not detect a discernable difference in terms of the chondrogenesis potential between MFS- and mcMFS-MSCs under the condition we used [40, 41]. Together, the above results suggest that these functional outputs may be pathologically relevant and can be reversed through correction of the FBN1 mutation.
Differential gene expression profiles in MFS- and mcMFS-SMCs
To understand the molecular mechanism underlying the phenotypic differences observed between MFS-SMCs and mcMFS-SMCs, we analyzed the global gene expression in two independent clones in two groups (with two biological replicates per clone, together eight samples) through microarray. First, we made the comparison of the datasets generated from different biological samples using scatter plots. When the probe intensities for all genes expressed in MFS-SMCs were plotted against the counterparts in either mcMFS-SMCs or MFS-iPSCs. The correlation in the gene expression profile between MFS-SMCs and MFS-iPSCs (R2 = 0.720) was much lower than the correlation in the gene expression profiles between MFS- and mcMFS-SMCs (R2 = 0.939), indicative of that there was a global change in gene expression during SMC differentiation (Figure S2A-B). Second, following normalization of the data amongst these samples and unsupervised hierarchical clustering, we found that two biological replicates of MFS- and mcMFS-SMCs clustered together much closer than between MFS- and mcMFS cell samples. Furthermore, the overall gene expression profiles in MFS- and mcMFS-SMCs were quite distinct (Figure 6A).
Transcriptomic analysis of MFS- and mcMFS-SMCs. (A) Heat-map of unsupervised data from microarray on the two groups (two clones per group). (b-c) Heat-map of differentially expressed genes associated to cell adhesion (B) and inflammation (C). (D) Expression of some of the genes was confirmed via RT-PCR (left panel) and qPCR (right panel). (E) Heat-map showing differential expression of contractile and synthetic SMC markers.
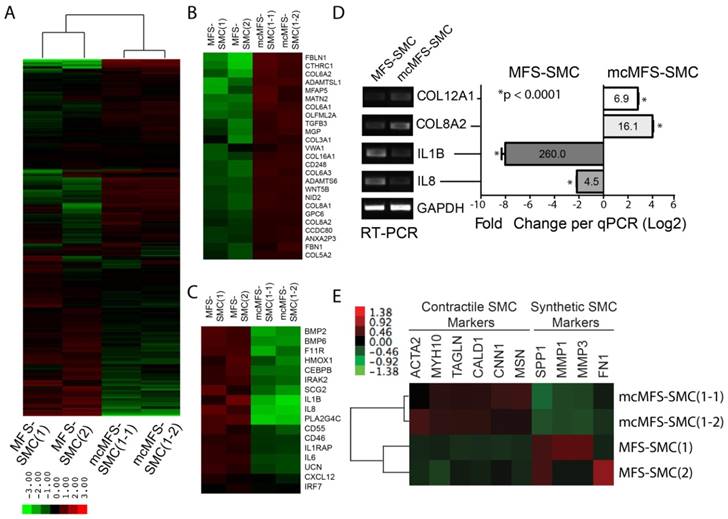
Using a volcano plot and subsequent analysis, we identified 547 genes expressed higher than 2-fold and 533 genes expressed lower than 2-fold in MFS-SMCs compared to mcMFS-SMCs (Figure S2C). Subsequently, these genes were analyzed based on their functional ontology using DAVID bioinformatics resources. The most upregulated genes in MFS-SMCs compared to mcMFS-SMCs belong to genes associated with inflammatory response (Figures 6B and S2E), whereas the most downregulated genes belong to genes encoding cell adhesion molecules including many collagen family proteins (Figures 6C and S2F). Consistent with the FBN1 haplosufficiency in the MFS sample, the total amount of detected FBN1 transcripts in MFS-SMCs is about 50% of that in mcMFS-SMCs (Figure S2D). We validated some of the genes by RT-PCR and real-time PCR, which consistently show that the levels of the cell adhesion genes COL8A2 and COL12A1 expressed in mcMFS-SMCs were 16.1- and 6.9-fold, respectively, of those in MFS-SMCs, whereas the levels of the inflammatory genes IL8 and IL1B expressed in MFS-SMCs were 4.5- and 260-fold, respectively, of those in mcMFS-SMCs (Figure 6D).
Interestingly, contractile SMC marker genes including ACTA2, MYH10, TAGLN, CALD1, CNN1, and MSN1 [42-44] were expressed ~20-50% more in mcMFS-SMCs than MFS-SMCs. In contrast, synthetic SMC marker genes including SPP1, MMP1, MMP3 (which encode corresponding matrix metalloproteinases), and FN [42-44] were expressed higher in MFS-SMCs than mcMFS-SMCs (Figure 6E. This suggests that MFS-SMCs may have a characteristic of more synthetic and less contractile phenotype than mcMFS-SMCs, consistent with the higher contractility of mcMFS-SMCs than MFS-SMCs.
Confirmation of the MSC phenotypes by knocking out FBN1 in a WT hESC line
The above findings support the pathogenetic role of a FBN1 mutation via a gain-of-function approach by correcting the mutation in the MFS-iPSC. To validate and recapitulate the phenotypic findings in additional cell lines and, more importantly, through a loss-of-function approach, we created FBN1 mutations in the GFP+ ENVY hESC line [26], using the clustered regularly interspaced short palindromic repeats (CRISPR) technology.
As described in the methods, we targeted exon 25 of the FBN1 gene in ENVY hESCs using CRISPR-Cas9 nickase with two sgRNA as shown in figure 7A. After single cell cloning, we obtained a heterozygous biallelic mutant cell clone (clone 1, C1) with 11-bp deletion in exon 25 (between nucleotide 3288 and 3298 of FBN1 mRNA) in one allele and substitution of 264-bp sequence in the upstream, including the splicing acceptor, of exon 25 by a sequence upstream of exon 24 in second allele, as determined by sequencing analysis (Figure 7A). RT-PCR analysis was conducted on C1 and a WT control using two sets of primers. Primer set 1 detected one band from C1, slightly smaller than the WT band indicating the 11-bp deletion (which will result in the premature termination during translsation). Primer set 2 detected two bands from C1 including a large and faint one (slightly shorter than the WT band) and a small and heavy band indicating the skipping of exon 25 during pre-mRNA splicing, which results from the 264-bp substitution (Figure S3B).
Knockout of FBN1 in ENVY hESCs and subsequent phenotypic analysis. (A) Schematic for CRISPR/Cas9n-assisted knockout of FBN1 in hESCs. (B) Immunostaining for ELASTIN and FBN1 in MSCs differentiated from ENVY hESCs with (C1) or without (WT) FBN1 knockout. (C) Alizarin red and alcian blue staining for osteogenic and chondrogenic differentiation, respectively, of the ENVY-WT- and ENVY-C1-MSCs. Scale bars, 100 μM.
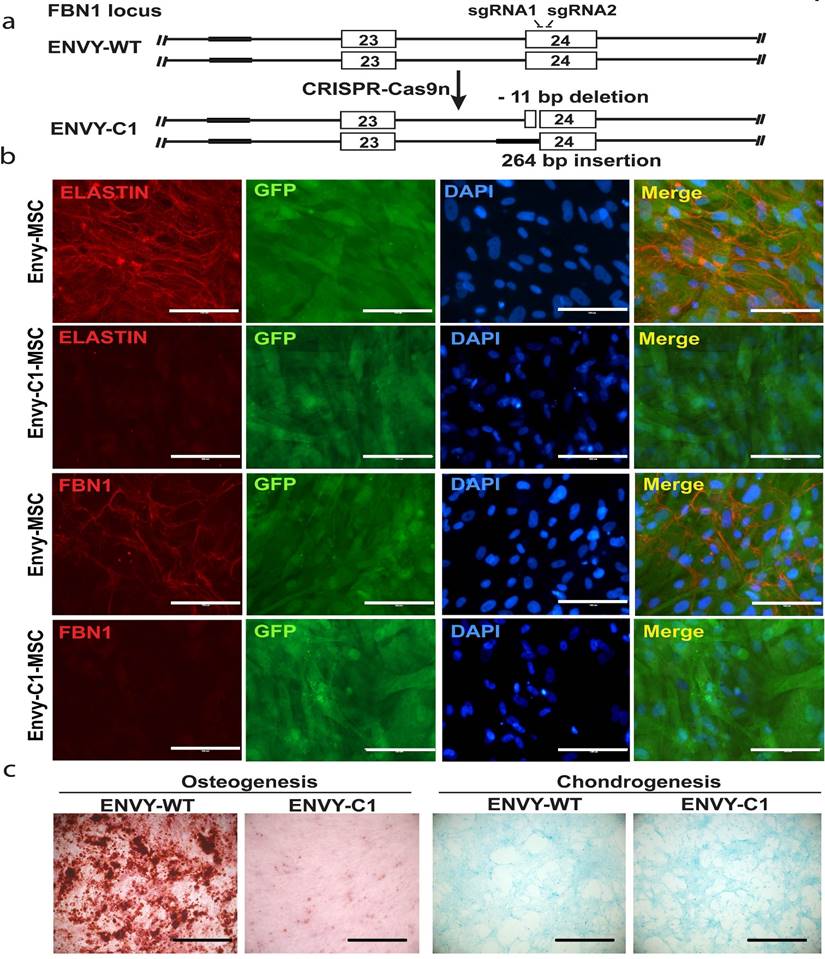
These mutations in the C1 hESCs did neither affect the morphology nor the pluripotency of the cells as determined by immunocytochemistry for pluripotency markers (Figure S3A). We differentiated the C1 hESCs into MSCs and cultured the MSCs under conditions to allow microfibrils formation. FBN1 was remarkably reduced in culture of C1-derived MSCs, compared to MSCs derived from the WT ENVY-hESCs which clearly expressed FBN1 mostly in the periphery of the cells (Figure 7B). Furthermore, consistent with the reduced osteogenesis observed with MFS-MSCs, markedly reduced osteogenesis was also found with ENVY-C1-MSCs compared to ENVY-WT-MSCs, but no obvious difference in condrogenesis existed between ENVY-C1s and ENVY-WT-MSCs (Figure 7C). Together, these data suggest that FBN1 mutations in WT hESCs also reduce microfibril formation and osteogenesis of the cells, similar to the phenotypes of MFS-MSCs.
Discussion
Modeling MFS has been mostly carried out in mice. However, it is difficult for a model mouse to recapitulate all pathology observed in MFS patients, especially for late-onset defects in skin, lens, and aorta. This is because mouse and human not only have great genetic and physiological differences in their affected organs, but are also exposed to substantially different environmental influences. The hPSC technology has provided unprecedented opportunity to model many genetic diseases in patient-specific manner. The first reported hPSC models for MFS displayed reduced osteogenic differentiation in both MFS iPSCs and hESCs derived from blastocyst-stage embryos carrying FBN1 mutations, in comparison with WT controls [21].
In the present study, we first corrected a FBN1 mutation in an MFS patient-derived iPSC line, differentiated the isogenic MFS- and mcMFS-iPSC lines into MSCs and SMCs to test osteogenic differentiation and contractility, respectively. Our results have demonstrated that correction of the mutation in the MFS-iPSCs can rescue compromised osteogenesis in the derivative MSCs, and reverse reduced ratio of contracting cells and altered calcium signals in the derivative SMCs. The novelty of our work lies in the fact that we analyzed the phenotypes of the FBN1 mutant cells in comparison with their isogenic controls to dissect the underlying pathogenic mechanism for MFS. In addition, we generated a hESC model for MFS through a loss-of-function approach (FBN1 knockout) with a consistent notion that FBN1 mutation is responsible for reduced osteogenesis and microfibril formation.
It has been shown that enhanced TGFβ signaling inhibits osteogenic differentiation while promoting chondrogenesis in a TGFβ1 cell-autonomous fashion in MSCs derived from MFS-ESCs or -iPSCs [21]. The impaired osteogenic differentiation is consistent with osteopenia and bone fracture susceptibility in MFS patients [45-47]. Our data verified this phenotype and demonstrated that it can be rescued by correcting the FBN1 mutation.
One of the most detrimental phenotypes of MFS is aortic aneurysm, which is mainly caused by degradation of the medial layer of aorta, characterized by fragmentation of elastic fibrils and phenotypic transformation of SMCs [48]. The β-adrenergic blocker propranolol, calcium antagonist verapamil [49], and angiotensin II receptor antagonist losartan [12, 50] have been found effective in treating aortic aneurysm in pediatric MFS patients, probably by controlling hemodynamic impact on the aorta. Losartan may, in part, produce its effect by inhibiting SMAD2/3 activation, independent of TGFβ receptor stimulation [51].
In conclusion, this study has generated iPSCs from a MFS patient and an isogenic control by correcting the FBN1 mutation in the iPSCs. Tissue-specific phenotypes demonstrated in MSCs and SMCs derived from the MFS-iPSCs were reversed in the mutation-corrected cells. Furthermore, the phenotypic alterations in microfiber formation, osteogenesis, and chondrogenesis were recapitulated in a WT hESC line with FBN1 knockout in both alleles, compared to the parental isogenic control cells. Thus, our findings confirmed the pathogenetic role of FBN1 mutations in these phenotypic changes. These isogenic hPSC sample pairs, together with the identified phenotypic changes, may serve as platforms to study the pathogenesis of MFS and screen for new therapies for this genetic disease.
Materials & Methods
iPSC derivation and culture
One skin fibroblast line #GM21974 derived from a MFS patient was obtained from Coriell Cell Repositories, which harbored a premature stop codon mutation. The fibroblasts were reprogrammed with STEMCCA lentivirus as described [52]. Five days post-transduction, the cells were harvested with trypsin, and ~105 transduced fibroblasts were seeded onto a 10-cm dish coated with gamma-irradiated mouse embryonic fibroblast (MEF) feeders. Colonies with morphology similar to hESCs were manually passaged and transferred to new irradiated MEF feeders approximately every week and expanded to generate iPSCs. All the methods were carried out in accordance with the National Institutes of Health Guidelines on Human Stem Cell Research. All the experimental protocols were approved by the University of Connecticut Stem Cell Oversight Committee.
Three WT pluripotent cell lines derived in this laboratory were used as controls, including two iPSC lines YK26 reprogrammed from human dermal fibroblasts via retroviral transduction[30] and BJ reprogrammed from human foreskin fibroblasts via lentiviral transduction of the STEMCCA vector, and one hESC line CT2 [53]. Both iPSCs and hESCs were cultured on MEF feeders in a hESC culture medium (20% Knockout Serum Replacer and 4 ng/ml bFGF in DMEM/F12).
Teratoma formation
iPSCs were injected intramuscularly into the left hind leg of immunodeficient SCID mice at ~2 x 10⁶ cells/mouse. Teratomas developed within 6-8 weeks, and were removed from mice for histological analysis including hematoxylin and eosin staining. This method was carried out in accordance with the University of Macau Animal Ethics Committee guidelines, and the experimental protocol was approved by this committee.
Correction of FBN1 mutation in MFS-iPSCs via TALEN-assisted genome editing
Briefly, two TALENs were assembled using the Golden Gate TALEN assembly kit (Addgene) with the left TALEN binding to TCT GCA GAA ACC ATC AAG and the right TALEN binding to TCA CCC ATC AAT GAC AG. A targeting vector was constructed via subcloning of PCR fragments, generated through overlapping PCR using a Herculase II fusion DNA polymerase (Agilent), comprised of exons 21 and 22 of FBN1, flanked by a PGK-Neo fragment, and cloned into the backbone of the PGKdtabpA plasmid [54].
MFS-iPSCs were first singularized with Accutase (Millipore EMD) and approximately 106 cells were transfected with 10, 10, and 20 μg of the left, right TALENs, and the targeting vector, respectively, using Nucleofector (Lonza) according to the manufacturer's protocol. Post-transfection, cells were transferred onto Matrigel-coated plate and selected for neomycin-resistant cells in the presence of 1 mg/ml G418 (Life Technologies). The survival cells were subjected to single cell cloning and multiple clones were expanded for verification of correction of the mutation and sustained pluripotency of the cells. Primers used for the verification are listed in Table S1.
FBN1 knockout in hESCs via CRISPR/Cas9-based genome editing
Complementary oligos for the generation of sgRNA expression were annealed and cloned into the BbsI sites of pSpCas9n(BB)-2A-Puro (Addgene plasmid ID: 48141). ENVY hESCs were cultured in mTeSR medium (Stem Cell Technologies). For co-transfection of paired sgRNAs, 1 μg of each sgRNA plasmid was mixed with 8×10⁵ ENVY cells. Transfection was performed by using P3 Primary Cell 4D-Nucleofector Kit according to the manufacturer's protocol. After 24 hours post-transfection, the cells were treated with puromycn (0.5 μg/ml) for 7 days to select positive clones.
T7EN1 assay and sequencing analysis
Genomic DNA was isolated via phenol:chloroform extraction and alcohol precipitation. Targeted regions were PCR generated from genomic DNA using primers as listed in Table S1. PCR products were denatured and reannealed in a thermocycler (Bio-rad). Hybridized PCR products were digested with T7 endonuclease 1 (NEB) for 30 min. at 37°C and analyzed via agarose gel electrophoresis. For sequencing analysis, PCR products carrying genomic modifications were purified and cloned into the T-easy cloning vector (Promega). Cloned products were sequenced using M13 primers (BGI).
SMC differentiation
We differentiated both hESCs and iPSCs to SMCs as described [37]. Briefly, hESC or iPSC colonies were partially digested using collagenase IV. Cell clumps were re-suspended in an embryoid body (EB) differentiation medium, i.e., Stemline II supplemented with 50-ng/ml bone morphogenetic protein 4 (BMP4) (R&D Systems) and 50-ng/ml vascular endothelial growth factor (VEGF) (Life Technologies) in a 6-well Ultra-low Attachment plate (Corning Life Science). After 48 hours, a half of the differentiation medium was replaced with the medium containing 50-ng/ml BMP4, 50-ng/ml VEGF, and 20-ng/ml basic fibroblast growth factor (bFGF) for additional 48 h. EBs formed in this condition were collected and incubated with Trypsin/EDTA (Life Technologies) for 2 to 3 min. The dissociated EBs were then incubated in a blast growth medium for up to 6 days. Suspended single cells with grape-like morphology were harvested and further differentiated into SMCs in SMC medium (Lonza) for 4-5 days.
MSC generation, microfiber formation, and osteogenic differentiation
The protocol used for MSC generation from hESCs [55, 56] was used in this study. Microfibers were formed by MSCs according to the method decribed by Noda, et al. [36]. Briefly, we differentiated MFS- and mcMFS-iPSCs into MSCs and then let the cells to overgrow without medium refreshment for 12-14 days. Osteogenic differentiation was conducted using the StemPro Osteogenic Differentiation Kit (StemPro) by following the manufacturer's instructions. Briefly, MSCs were grown in monolayers to 80% confluency, then harvested by TrypLE (Thermo scientific) before seeding. 5 x 10³ cells/cm2 viable cells, as determined by trypan blue stain, were re-plated on a 12-well tissue culture plate. After the reattachment, the cells were fed every 2-3 days with osteogenesis differentiation medium for ~21 days. Cells were stainied with Alizarin Red O according to the manufacturer's protocol.
Immunocytochemistry
Cultured cells were fixed with 4% paraformaldehyde, permeabilized with 0.1% Triton, washed, and incubated with primary antibodies. Pluripotency was verified using antibodies against TRA1-60 and TRA1-81 (Santa Cruz Biotech), SSEA3 and SSEA4 (Hybridoma Bank), OCT4 and NANOG (Stemgent Inc.). Microfibrils were detected by using antibodies against FBN1 and ELASTIN (Abcam) were characterized using antibodies against SMA and calponin (Abcam). Cell nuclei were counterstained with DAPI.
Western analysis
Protein samples were separated on SDS-PAGE gels (Bio-Rad) and then transferred to PVDF membranes (Bio-Rad Laboratories). The membranes were blocked with 5% nonfat milk and incubated with antibodies against FBN1, SMAD2/3, phosphorylated SMAD2 (p-SMAD2), and GAPDH (Santa Cruz) at 4 °C overnight followed by washing with TBS-T solution for three times. Membranes were incubated in horseradish peroxidase (HRP)-labeled secondary antibodies (Biorad) for 30 min. and followed by TBS-T washing three times. Finally, target protein bands on the membranes were visualized using chemiluminescent HRP substrate (Biorad).
RT-PCR, qRT-PCR, and microarray
RNA was isolated from cells using TRIzol reagent (Life Technologies), and cDNA synthesized from RNA using Superscript II (Life Technologies), according to the manufacturer's protocol. Gene expression was assessed through PCR with primers for specific genes (Table S1) under the following conditions: an initial 5-min. denaturation at 95 °C; followed by 30 cycles of 45 sec. of denaturation at 95 °C, 45 sec. of annealing at 55 °C, and 45 sec. of extension at 72 °C; and completed with a final extension at 72 °C for 10 min. The PCR reactions were spread on TBE gel via electrophoresis and DNA bands visualized via ethidium bromide staining.
For real-time PCR, the RT samples were analyzed by using Quantifast SYBR Green (Qiagen) on ABI 7500 Fast System with the primers indicated (Table S1). The following conditions were used in qPCR: 2 min at 50 oC, 10 min at 95 oC, and 40 cycles of 15 sec at 95 oC and 1 min at 60 oC. GAPDH was tested as an endogenous reference to calculate the relative expression level of target genes. The results are displayed as relative mRNA levels.
For microarray experiment, RNA was isolated using Purlink RNA mini kit (Life Technologies) and cDNA libraries were synthesized and processed by using HumanHT-12 v4 Expression Beadchip at the Yale Stem Cell Center Genomics Core. Further analysis was performed using Beads Studio Software (Illumina) and Excel software. PluriTest based on microarray data of iPSC lines was conducted using the corresponding software at www.pluritest.com [28].
The microarray dataset for SMC samples was normalized and filtered to remove data points with detection P value > 0.01 in at least 50% of the samples[57]. Two normalization methods were utilized to analyze the dataset on the basis of their biological relevance. First, average probe intensity of all biological and technical replicates was used to make comparison in gene expression profile between test and control groups. Second, the probe intensity of analyzed genes in the MFS-iPSCs was used as a reference line to monitor the gene expression change during differentiation into SMCs.
FACS analysis
For intracellular proteins, cells were harvested in ice-cold PBS, fixed in 0.01% formaldehyde, and permeabilized with 0.5% saponin. Then cells were incubated with a primary antibody, subsequently with fluorophore-conjugated secondary antibody, and analyzed on BD Bioscience Accuri C6 using the Accuri C6 software.
Luciferase reporter assay
By using a pGL3-based TGFβ reporter plasmid containing 12 TGFβ-responsive element repeats and the minimal promoter of thymidine kinase gene TK, i.e., (TRE)12/TKprom-Luc[29], we detected TGFβ signaling level in cells treated with or without 10 μM SB431542. The luciferase assay was performed by transfecting cells using FuGENE HD (Roche Applied Science) on day 1 with each of the reporter vectors together with a trace amount (1/20 of the DNA amount for the test vector) of pRL-tk plasmid (Promega) to express Renilla luciferase as an internal control. Cells were harvested on day 3 and the lysates were assayed for both the firefly and Renilla luciferase activities using the Dual-Luciferase Reporter Assay System (Promega) on a 3010 Luminometer (BD Biosciences). The ratio of relative luciferase/Renilla activities was displayed as relative luciferase activity.
Contractility assay on SMCs[39]
SMCs were passaged to about 20% confluent on gelatin-coated plate, and treated with or without SB431542 (10 μM) 24 h prior to the contractility assay. Cells were stained with Calcein AM (2 μM), starved in phenol-free DMEM, and treated with CCh (10 μM), followed by time-lapse recording for 30 minutes. Percentage of contractile cells was calculated as ratio of the number of contracting cells over the number of total cells per view, and displayed is the average of ratios from five separate views per group.
Method for analysis of Ca2+ signal assay
SMCs were plated on 25 mm glass coverslips, and loaded with 5-μM Fura-2 acetoxymethyl ester (Molecular Probe) and 0.1% pluronic F-127 (Sigma) in Tyrode solution for 20 minutes at room temperature. Non-incorporated dye was washed away with Tyrode solution containing NaCl 148 mM, KCl 5 mM, CaCl2 2 mM, MgCl2 1mM, glucose 10 mM, and Hepes 10 mM (pH 7.4). Ca2+ transients were evoked by treatment of 10-μM CCh in Tyrode solution. Ionomycin at 1 μM was used as an internal control. Fluorescence intensities at 510 nm with 340-nm and 380-nm excitation were collected at a rate of 1 Hz using CoolSNAP HQ2 (Photometrics) and data were analyzed using NIS-Elements (Nikon). Cytosolic Ca2+ was measured by ratio of fluorescence intensity at 340 nm and 380 nm (F340/F380) normalized to that of the Ca2+ signal elicited by 1-μM Ionomycin as previously reported [58].
Statistical analyses
Data are presented as mean ± SD. Student's t test was used for statistical analysis. Percentage data was arcsine transformed prior to analysis. P < 0.05 was considered significant, and P < 0.01 highly significant. Statistical analysis of the microarray data is described in Results.
Supplementary Material
Supplementary figures and tables.
Acknowledgements
This work was supported by Connecticut Stem Cell Research grants #12-SCD-UCHC-01 and 13-SCD-UCHC-01, and University of Macau SRG #2014-00008-FHS and MYRG #2015-00169-FHS and 2016-00070-FHS, and Macau Science and Technology Development Fund (FDCT) grants #128-2014-A3 and 028/2015/A1 to R.X.; MYRG #2016-00249-FHS to J.W.P., and NIH R01HL078960 and AHA 12GRNT12050683 to L.Y.
Author Contributions
R.X., L-X.Y., C.S., and S.-P. Y. conceived and designed the experiments. J.W.P., L.Y., C.S., X.W., L.C., T.R., Z.Y., K.D., K.M.-T., E.L., B.J., L.Y., and Z.Z. performed the experiments. J.W.P., H.N., F.G., W.S., T.X., and R.X. analyzed the data and wrote the manuscript. All the authors reviewed the manuscript.
Accession number
The microarray data sets have been deposited in the Gene Expression Omnibus of NCBI under accession number GSE78823.
Competing Interests
R.X. is a founder of ImStem Biotechnology, Inc., a stem cell company. He declares competing financial interests.
References
1. Pepe G, Giusti B, Sticchi E, Abbate R, Gensini GF, Nistri S. Marfan syndrome: current perspectives. Appl Clin Genet. 2016;9:55-65
2. Ramirez F, Sakai LY, Rifkin DB, Dietz HC. Extracellular microfibrils in development and disease. Cell Mol Life Sci. 2007;64:2437-46
3. Zhang H, Hu W, Ramirez F. Developmental expression of fibrillin genes suggests heterogeneity of extracellular microfibrils. J Cell Biol. 1995;129:1165-76
4. Yin W, Smiley E, Germiller J, Sanguineti C, Lawton T, Pereira L. et al. Primary structure and developmental expression of Fbn-1, the mouse fibrillin gene. J Biol Chem. 1995;270:1798-806
5. Ramirez F, Sakai LY. Biogenesis and function of fibrillin assemblies. Cell Tissue Res. 2010;339:71-82
6. Robinson PN, Godfrey M. The molecular genetics of Marfan syndrome and related microfibrillopathies. J Med Genet. 2000;37:9-25
7. Judge DP, Dietz HC. Marfan's syndrome. Lancet. 2005;366:1965-76
8. Pereira L, Andrikopoulos K, Tian J, Lee SY, Keene DR, Ono R. et al. Targetting of the gene encoding fibrillin-1 recapitulates the vascular aspect of Marfan syndrome. Nat Genet. 1997;17:218-22
9. Neptune ER, Frischmeyer PA, Arking DE, Myers L, Bunton TE, Gayraud B. et al. Dysregulation of TGF-beta activation contributes to pathogenesis in Marfan syndrome. Nature genetics. 2003;33:407-11
10. Habashi JP, Judge DP, Holm TM, Cohn RD, Loeys BL, Cooper TK. et al. Losartan, an AT1 antagonist, prevents aortic aneurysm in a mouse model of Marfan syndrome. Science. 2006;312:117-21
11. Cook JR, Clayton NP, Carta L, Galatioto J, Chiu E, Smaldone S. et al. Dimorphic effects of transforming growth factor-beta signaling during aortic aneurysm progression in mice suggest a combinatorial therapy for Marfan syndrome. Arterioscler Thromb Vasc Biol. 2015;35:911-7
12. Brooke BS, Habashi JP, Judge DP, Patel N, Loeys B, Dietz HC 3rd. Angiotensin II blockade and aortic-root dilation in Marfan's syndrome. N Engl J Med. 2008;358:2787-95
13. Gomez D, Coyet A, Ollivier V, Jeunemaitre X, Jondeau G, Michel JB. et al. Epigenetic control of vascular smooth muscle cells in Marfan and non-Marfan thoracic aortic aneurysms. Cardiovascular research. 2011;89:446-56
14. Chamberlain SJ, Chen PF, Ng KY, Bourgois-Rocha F, Lemtiri-Chlieh F, Levine ES. et al. Induced pluripotent stem cell models of the genomic imprinting disorders Angelman and Prader-Willi syndromes. Proceedings of the National Academy of Sciences of the United States of America. 2010;107:17668-73
15. Park IH, Arora N, Huo H, Maherali N, Ahfeldt T, Shimamura A. et al. Disease-specific induced pluripotent stem cells. Cell. 2008;134:877-86
16. Ebert AD, Yu J, Rose FF Jr, Mattis VB, Lorson CL, Thomson JA. et al. Induced pluripotent stem cells from a spinal muscular atrophy patient. Nature. 2009;457:277-80
17. Howden SE, Gore A, Li Z, Fung HL, Nisler BS, Nie J. et al. Genetic correction and analysis of induced pluripotent stem cells from a patient with gyrate atrophy. Proc Natl Acad Sci U S A. 2011;108:6537-42
18. Zou J, Maeder ML, Mali P, Pruett-Miller SM, Thibodeau-Beganny S, Chou BK. et al. Gene targeting of a disease-related gene in human induced pluripotent stem and embryonic stem cells. Cell Stem Cell. 2009;5:97-110
19. Hockemeyer D, Wang H, Kiani S, Lai CS, Gao Q, Cassady JP. et al. Genetic engineering of human pluripotent cells using TALE nucleases. Nat Biotechnol. 2011;29:731-4
20. Hockemeyer D, Soldner F, Beard C, Gao Q, Mitalipova M, DeKelver RC. et al. Efficient targeting of expressed and silent genes in human ESCs and iPSCs using zinc-finger nucleases. Nature biotechnology. 2009;27:851-7
21. Quarto N, Leonard B, Li S, Marchand M, Anderson E, Behr B. et al. Skeletogenic phenotype of human Marfan embryonic stem cells faithfully phenocopied by patient-specific induced-pluripotent stem cells. Proc Natl Acad Sci U S A. 2012;109:215-20
22. Marthaler AG, Schmid B, Tubsuwan A, Poulsen UB, Engelbrecht AF, Mau-Holzmann UA. et al. Generation of an isogenic, gene-corrected control cell line of the spinocerebellar ataxia type 2 patient-derived iPSC line H196. Stem Cell Res. 2016;16:162-5
23. Murray A, Letourneau A, Canzonetta C, Stathaki E, Gimelli S, Sloan-Bena F. et al. Brief report: isogenic induced pluripotent stem cell lines from an adult with mosaic down syndrome model accelerated neuronal ageing and neurodegeneration. Stem Cells. 2015;33:2077-84
24. Kim HS, Bernitz JM, Lee DF, Lemischka IR. Genomic editing tools to model human diseases with isogenic pluripotent stem cells. Stem Cells Dev. 2014;23:2673-86
25. Reinhardt P, Schmid B, Burbulla LF, Schondorf DC, Wagner L, Glatza M. et al. Genetic correction of a LRRK2 mutation in human iPSCs links parkinsonian neurodegeneration to ERK-dependent changes in gene expression. Cell Stem Cell. 2013;12:354-67
26. Costa M, Dottori M, Ng E, Hawes SM, Sourris K, Jamshidi P. et al. The hESC line Envy expresses high levels of GFP in all differentiated progeny. Nature methods. 2005;2:259-60
27. Sommer CA, Sommer AG, Longmire TA, Christodoulou C, Thomas DD, Gostissa M. et al. Excision of reprogramming transgenes improves the differentiation potential of iPS cells generated with a single excisable vector. Stem Cells. 2010;28:64-74
28. Muller FJ, Schuldt BM, Williams R, Mason D, Altun G, Papapetrou EP. et al. A bioinformatic assay for pluripotency in human cells. Nat Methods. 2011;8:315-7
29. Dennler S, Itoh S, Vivien D, ten Dijke P, Huet S, Gauthier JM. Direct binding of Smad3 and Smad4 to critical TGF beta-inducible elements in the promoter of human plasminogen activator inhibitor-type 1 gene. The EMBO journal. 1998;17:3091-100
30. Martins-Taylor K, Nisler BS, Taapken SM, Compton T, Crandall L, Montgomery KD. et al. Recurrent copy number variations in human induced pluripotent stem cells. Nature biotechnology. 2011;29:488-91
31. Narva E, Autio R, Rahkonen N, Kong L, Harrison N, Kitsberg D. et al. High-resolution DNA analysis of human embryonic stem cell lines reveals culture-induced copy number changes and loss of heterozygosity. Nat Biotechnol. 2010;28:371-7
32. Laurent LC, Ulitsky I, Slavin I, Tran H, Schork A, Morey R. et al. Dynamic changes in the copy number of pluripotency and cell proliferation genes in human ESCs and iPSCs during reprogramming and time in culture. Cell stem cell. 2011;8:106-18
33. Gore A, Li Z, Fung HL, Young JE, Agarwal S, Antosiewicz-Bourget J. et al. Somatic coding mutations in human induced pluripotent stem cells. Nature. 2011;471:63-7
34. Davis MR, Andersson R, Severin J, de Hoon M, Bertin N, Baillie JK. et al. Transcriptional profiling of the human fibrillin/LTBP gene family, key regulators of mesenchymal cell functions. Mol Genet Metab. 2014;112:73-83
35. Baker KE, Parker R. Nonsense-mediated mRNA decay: terminating erroneous gene expression. Curr Opin Cell Biol. 2004;16:293-9
36. Noda K, Dabovic B, Takagi K, Inoue T, Horiguchi M, Hirai M. et al. Latent TGF-beta binding protein 4 promotes elastic fiber assembly by interacting with fibulin-5. Proc Natl Acad Sci U S A. 2013;110:2852-7
37. Lu SJ, Ivanova Y, Feng Q, Luo C, Lanza R. Hemangioblasts from human embryonic stem cells generate multilayered blood vessels with functional smooth muscle cells. Regen Med. 2009;4:37-47
38. Feng Q, Lu SJ, Klimanskaya I, Gomes I, Kim D, Chung Y. et al. Hemangioblastic derivatives from human induced pluripotent stem cells exhibit limited expansion and early senescence. Stem Cells. 2010;28:704-12
39. Yamaguchi S, Yamahara K, Homma K, Suzuki S, Fujii S, Morizane R. et al. The role of microRNA-145 in human embryonic stem cell differentiation into vascular cells. Atherosclerosis. 2011;219:468-74
40. Lin Y, Luo E, Chen X, Liu L, Qiao J, Yan Z. et al. Molecular and cellular characterization during chondrogenic differentiation of adipose tissue-derived stromal cells in vitro and cartilage formation in vivo. J Cell Mol Med. 2005;9:929-39
41. Portron S, Merceron C, Gauthier O, Lesoeur J, Sourice S, Masson M. et al. Effects of in vitro low oxygen tension preconditioning of adipose stromal cells on their in vivo chondrogenic potential: application in cartilage tissue repair. PLoS One. 2013;8:e62368
42. Rensen SS, Doevendans PA, van Eys GJ. Regulation and characteristics of vascular smooth muscle cell phenotypic diversity. Neth Heart J. 2007;15:100-8
43. Owens GK, Kumar MS, Wamhoff BR. Molecular regulation of vascular smooth muscle cell differentiation in development and disease. Physiological reviews. 2004;84:767-801
44. Beamish JA, He P, Kottke-Marchant K, Marchant RE. Molecular regulation of contractile smooth muscle cell phenotype: implications for vascular tissue engineering. Tissue Eng Part B Rev. 2010;16:467-91
45. Kohlmeier L, Gasner C, Marcus R. Bone mineral status of women with Marfan syndrome. Am J Med. 1993;95:568-72
46. Kohlmeier L, Gasner C, Bachrach LK, Marcus R. The bone mineral status of patients with Marfan syndrome. J Bone Miner Res. 1995;10:1550-5
47. Moura B, Tubach F, Sulpice M, Boileau C, Jondeau G, Muti C. et al. Bone mineral density in Marfan syndrome. A large case-control study. Joint Bone Spine. 2006;73:733-5
48. LeMaire SA, Russell L. Epidemiology of thoracic aortic dissection. Nat Rev Cardiol. 2011;8:103-13
49. Rossi-Foulkes R, Roman MJ, Rosen SE, Kramer-Fox R, Ehlers KH, O'Loughlin JE. et al. Phenotypic features and impact of beta blocker or calcium antagonist therapy on aortic lumen size in the Marfan syndrome. Am J Cardiol. 1999;83:1364-8
50. Radonic T, de Witte P, Baars MJ, Zwinderman AH, Mulder BJ, Groenink M. et al. Losartan therapy in adults with Marfan syndrome: study protocol of the multi-center randomized controlled COMPARE trial. Trials. 2010;11:3
51. Rodriguez-Vita J, Sanchez-Lopez E, Esteban V, Ruperez M, Egido J, Ruiz-Ortega M. Angiotensin II activates the Smad pathway in vascular smooth muscle cells by a transforming growth factor-beta-independent mechanism. Circulation. 2005;111:2509-17
52. Sommer AG, Rozelle SS, Sullivan S, Mills JA, Park SM, Smith BW. et al. Generation of human induced pluripotent stem cells from peripheral blood using the STEMCCA lentiviral vector. J Vis Exp. 2012
53. Wang X, Lin G, Martins-Taylor K, Zeng H, Xu RH. Inhibition of caspase-mediated anoikis is critical for basic fibroblast growth factor-sustained culture of human pluripotent stem cells. The Journal of biological chemistry. 2009;284:34054-64
54. Soriano P. The PDGF alpha receptor is required for neural crest cell development and for normal patterning of the somites. Development. 1997;124:2691-700
55. Kimbrel EA, Kouris NA, Yavanian G, Chu J, Qin Y, Chan A. et al. Mesenchymal stem cell population derived from human pluripotent stem cells displays potent immunomodulatory and therapeutic properties. Stem cells and development. 2014
56. Wang X, Kimbrel EA, Ijichi K, Paul D, Lazorchak AS, Chu J. et al. Human ESC-Derived MSCs Outperform Bone Marrow MSCs in the Treatment of an EAE Model of Multiple Sclerosis. Stem cell reports. 2014;3:115-30
57. Schurmann C, Heim K, Schillert A, Blankenberg S, Carstensen M, Dorr M. et al. Analyzing illumina gene expression microarray data from different tissues: methodological aspects of data analysis in the metaxpress consortium. PLoS One. 2012;7:e50938
58. Du J, Xie J, Zhang Z, Tsujikawa H, Fusco D, Silverman D. et al. TRPM7-mediated Ca2+ signals confer fibrogenesis in human atrial fibrillation. Circulation research. 2010;106:992-1003
Author contact
![]() Corresponding authors: Ren-He Xu, M.D. Ph.D., Faculty of Health Sciences, University of Macau, Taipa, Macau, China Phone: +853 8822-4993 Fax: +853 8822-2314 Email: renhexumo Lixia Yue, Ph.D., Department of Cell Biology, University of Connecticut Health Center, Farmington, Connecticut, USA Phone: 860-679-3869 Fax: 860-679-1426 Email: lyueedu
Corresponding authors: Ren-He Xu, M.D. Ph.D., Faculty of Health Sciences, University of Macau, Taipa, Macau, China Phone: +853 8822-4993 Fax: +853 8822-2314 Email: renhexumo Lixia Yue, Ph.D., Department of Cell Biology, University of Connecticut Health Center, Farmington, Connecticut, USA Phone: 860-679-3869 Fax: 860-679-1426 Email: lyueedu