Impact Factor ISSN: 1449-2288
- Issue 12; 2026
- Issue 11; 2026
- Issue 10; 2026
- Issue 9; 2026
- Issue 8; 2026
- Volume 22; 2026
- Past Issues
- Advance Articles
- Editorial Board
- Cover Images
- Index & Coverage
- Cover Suggestion
- Special Issues
Introduction
Results
Discussion
Methods
Supplementary Material
Abbreviations
Acknowledgements
References

 Global reach, higher impact
Int J Biol Sci 2017; 13(9):1138-1151. doi:10.7150/ijbs.19436 This issue Cite
Research Paper
Effect of Population Size and Mutation Rate on the Evolution of RNA Sequences on an Adaptive Landscape Determined by RNA Folding
Ali R. Vahdati1, 2, Kathleen Sprouffske1, 2, Andreas Wagner1, 2, 3 ![]()
1. Institute of Evolutionary Biology and Environmental Studies, University of Zurich, Zurich, Switzerland;
2. The Swiss Institute of Bioinformatics, Lausanne, Switzerland;
3. The Santa Fe Institute, Santa Fe, USA.
Received 2017-2-1; Accepted 2017-7-5; Published 2017-9-5
Abstract

The dynamics of populations evolving on an adaptive landscape depends on multiple factors, including the structure of the landscape, the rate of mutations, and effective population size. Existing theoretical work often makes ad hoc and simplifying assumptions about landscape structure, whereas experimental work can vary important parameters only to a limited extent. We here overcome some of these limitations by simulating the adaptive evolution of RNA molecules, whose fitness is determined by the thermodynamics of RNA secondary structure folding. We study the influence of mutation rates and population sizes on final mean population fitness, on the substitution rates of mutations, and on population diversity. We show that evolutionary dynamics cannot be understood as a function of mutation rate µ, population size N, or population mutation rate Nµ alone. For example, at a given mutation rate, clonal interference prevents the fixation of beneficial mutations as population size increases, but larger populations still arrive at a higher mean fitness. In addition, at the highest population mutation rates we study, mean final fitness increases with population size, because small populations are driven to low fitness by the relatively higher incidence of mutations they experience. Our observations show that mutation rate and population size can interact in complex ways to influence the adaptive dynamics of a population on a biophysically motivated fitness landscape.
Keywords: population size, rate of adaptation, fitness landscape, RNA secondary structure.
Introduction
Perhaps the most fundamental process in Darwinian evolution is a population's exploration of an adaptive landscape [1] by mutation and selection. As a population scales ever higher peaks in such a landscape, its mean fitness increases. (A fitness peak refers to one or more sequences with higher fitness than all their neighbors.) Many factors influence this process. Among them is the structure of the landscape itself, including its number of peaks, environmental changes that might influence this structure, the presence and incidence of recombination, the rate of DNA mutations, the kinds of genetic changes that such mutations cause, and population size [2-9]. To understand these factors and how they interact to affect adaptive evolution is not just of academic interest. It may also help predict the outcome of adaptive evolution, for example in pathogens and their arms races with human and non-human hosts [10-14].
Unfortunately, the factors influencing adaptive evolution interact in complex ways. Here we focus on two such factors, mutations and their rate, as well as the effective size of a population Ne [15, 16]. We study how these factors interact in the adaptive evolution of RNA molecules subject to mutation and selection on an unchanging fitness landscape.
Both separately and jointly, the two factors influence adaptive evolution in complex ways. Consider population size. On the one hand, adaptive evolution may be more rapid in large populations. First, larger populations produce more mutant individuals per generation, which helps explore more genotypes and find optimal genotypes faster than smaller populations. Second, natural selection is more effective in larger populations [17]. Specifically, as effective population size Ne increases, natural selection becomes more effective in fixing beneficial mutations and removing deleterious mutations. In other words, the substitution rate of beneficial mutations is an increasing function of Ne, and the substitution rate of deleterious mutations a decreasing function of Ne [18, 19]. Third, if mutation rates and population sizes are large enough, then some individuals in large populations will experience double mutations that can help them cross fitness valleys and explore genotypes that would otherwise be inaccessible [11], a phenomenon also known as stochastic tunneling [20-24].
On the other hand, there are also reasons why adaptive evolution may be more rapid in smaller populations. First, such populations experience little or no clonal interference, a phenomenon that can slow down the adaptation rate in large and polymorphic populations [11, 25]. In clonal interference, multiple beneficial mutations coexist in a population at the same time. In the absence of recombination, individuals harboring different beneficial mutations compete with each other, which can slow down the fixation of beneficial mutations and thus adaptive evolution. Second, small populations experience stronger genetic drift and the stochastic changes in allele frequencies that can help a population cross a fitness valley [7, 8]. A different perspective on the same phenomenon is provided by considering the adaptive peaks in a multi-peaked adaptive landscape. Because only differences in fitness effects that are greater than the reciprocal of the population size (1/ Ne) are visible to selection [17], some fitness peaks separated by a valley will merge as population size decreases, thus reducing the number of peaks in the landscape [8, 11, 13]. This will decrease the likelihood that a population becomes trapped on a local peak, and increase its chances to find the landscape's global fitness peak.
Further complications ensue if one considers the influence of mutations and the distribution of their fitness effects [26, 27]. These effects fall into three broad categories, deleterious, neutral, and beneficial. While the fate of neutral mutations is independent of population size [17, 19], this does no longer hold for beneficial or deleterious mutations. To be sure, strongly deleterious (lethal) mutations get eliminated rapidly, and strongly beneficial mutations sweep to fixation rapidly, but the fate of weakly deleterious and weakly beneficial mutations can depend on stochastic events caused by genetic drift and thus on population size. For example, weakly deleterious mutations can persist for substantial amounts of time, or even become fixed in small populations.
As a result of these interactions between mutation rate and population size, the substitution rate of mutations is expected to show a U-shaped relationship with Ne [18]. That is, at small Ne, many slightly deleterious mutations become fixed. At large Ne, many slightly beneficial mutations become fixed, because positive selection is strong. At intermediate Ne, fewer mutations become fixed. The exact form of this relationship, however, depends strongly on the distribution of mutational fitness effects [26-28].
Existing work to elucidate the role of population size and mutation rate on adaptive dynamics falls into two categories. The first comprises computational and theoretical studies to understand these dynamics [5, 6, 9, 13, 29]. Because they do not use data from empirical adaptive landscapes, such studies usually make ad hoc assumptions about the structure of a fitness landscapes, the fitness effects of individual mutations, non-additive (epistatic) interactions of mutations [30, 31], and so on. Violations of these assumptions may affect the evolutionary dynamics [18]. For example, the effective population size Ne and the substitution rate of beneficial mutations are expected to show a positive association if beneficial mutations are rare [18]. However, the incidence of beneficial mutations may change when the environment changes, or while a population explores a fitness landscape. Such change can affect the substitution rate of beneficial mutations, and thus also the rate of adaptive evolution.
Other studies use experimental approaches. Unlike theoretical studies, they examine fitness landscapes of realistic complexity. However, because such landscapes are very large and may involve astronomically many genotypes, we usually have very limited knowledge about the structure of these landscapes and about a population's evolutionary trajectories on them [32, 33]. Moreover, experimental studies are subject to limited replication, and can thus vary mutation rates, population sizes, and other relevant parameters only to a limited extent.
Here we overcome some of these limitations by simulating adaptive evolution on a biophysically motivated adaptive landscape that does not require ad hoc assumptions about landscape structure. It is a landscape whose structure is determined by the thermodynamics of RNA folding [34-36]. RNA molecules fold into secondary structures by internal pairing of complementary base pairs (G-C, A-U). Driven by thermal motions, an RNA molecule can fold and re-fold incessantly and thus adopt a spectrum of different secondary structures that differ in their free energy. The structure in which a molecule spends most of its time is the minimum free energy (MFE) structure [35, 37]. In our simulations, we use the fraction of time a molecule spends in a given fold - the stability of this fold - as a measure of fitness. This stability may itself be subject to selection [38]. A potential example is the stability of yeast mRNA secondary structures, which increases with gene expression levels [39]. For reasons of tractability, and considering existing precedents in modeling RNA evolution [34, 36, 40, 41], we assume that selection acts only on the stability of a single structure, but note that in nature a balance between multiple secondary structures may be important [42-44].
Aside from using a biophysically motivated adaptive landscape, our simulation model also has the advantage that it does not require us to make ad hoc assumptions about fitness effects of mutations or about epistatic interactions of mutations, because these quantities are determined by the thermodynamics of folding. And with a simulation model, we can explore a wider range of mutation rates and population sizes than in experimental work. Although one might naively assume that evolutionary dynamics can be understood as a function of mutation rate µ or population mutation rate (Nµ) alone, our observations show otherwise.
Results
Short RNA sequences folding into any secondary structure are highly connected
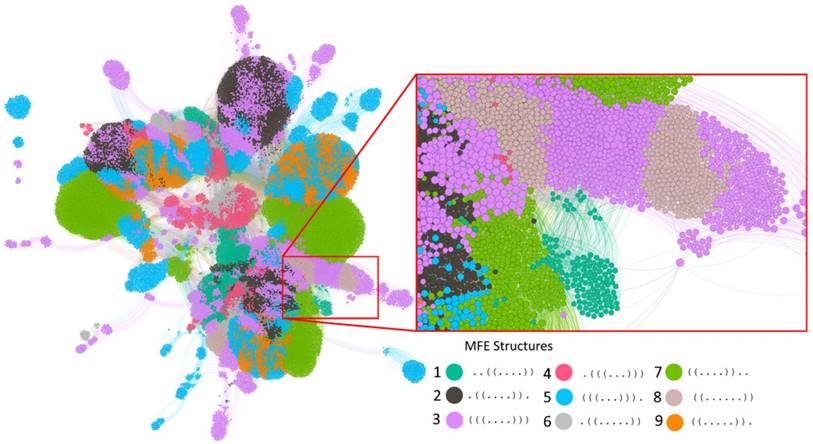
Our evolution simulations build on two different kinds of RNA sequences. The first comprise all of those 410 = 1,048,576 ten-nucleotide-long sequences that fold into some secondary structure in their minimum free energy (MFE) state. Before studying the evolutionary dynamics of these molecules, we first characterized how they are organized in RNA genotype space. To this end, we first determined by exhaustive enumeration that there are 39,410 sequences (3.76% of sequence space) with some MFE secondary structure, and that they form nine distinct secondary structures. Each of these structures has a single stem-loop but with different nucleotides involved in the stem (Table 1). Although these sequences comprise a small fraction of the whole genotype space, they are highly accessible from one another through single mutations. This can be shown by constructing a genotype network, i.e., a graph whose nodes are sequences that form some secondary structure (regardless of the identity of that structure), and whose edges connect two sequences that differ by a single point mutation. This graph has five connected components. (A component is a set of nodes that are accessible from each other through a path of one or more edges.) However, one of these components contains the vast majority (99.24%, 39,109) of sequences (Figure 1).
Properties of genotype networks of RNA molecules of length 10 that fold into the nine possible secondary structures.
| ID | Vertices | GC vertices | Components | Assortativity | Diameter | Structure | Min-Max time in MFE structure |
|---|---|---|---|---|---|---|---|
| Str1 | 1,728 | 731 | 3 | 0.75 | 9 | ..((....)) | 0.36-0.85 |
| Str2 | 5,717 | 2,445 | 6 | 0.70 | 11 | .((....)). | 0.38-0.98 |
| Str3 | 7,790 | 1,487 | 13 | 0.79 | 11 | (((....))) | 0.42-0.97 |
| Str4 | 2,286 | 506 | 10 | 0.67 | 6 | .(((...))) | 0.46-0.90 |
| Str5 | 6,934 | 1,335 | 21 | 0.82 | 10 | (((...))). | 0.52-0.98 |
| Str6 | 943 | 384 | 5 | 0.55 | 6 | .((.....)) | 0.40-0.64 |
| Str7 | 7,765 | 3,328 | 9 | 0.65 | 8 | ((....)).. | 0.38-0.98 |
| Str8 | 1,437 | 475 | 5 | 0.13 | 6 | ((......)) | 0.39-0.64 |
| Str9 | 4,801 | 2,115 | 4 | 0.58 | 8 | ((.....)). | 0.39-0.95 |
Columns from left to right: 'ID': an identifier for the secondary structure; 'Vertices': number of sequences folding into the structure; 'GC vertices': number of edges in the giant component of the genotype network formed by the sequences; 'Components': number of connected components within each network (a connected component is a set of sequences which are all accessible from each other through a series of single point mutations that preserve the structure); 'Assortativity': assortativity coefficient of the largest connected component. The assortativity coefficient indicates to what extent sequences have neighbors with degrees (numbers of neighbors) similar to themselves [82]; 'Diameter': the diameter of the largest connected component. The diameter of a network is the largest minimal distance between any pair of nodes in a connected component; 'Structure': MFE structure of the sequences in the network; 'Min-Max time in MFE structure': range of the fraction of times that sequences folding into the MFE structure spend in this structure. More time spent in a structure corresponds to higher fitness in our model.
The genotype network of RNA sequences of length 10. Each circle (node) corresponds to a sequence. Two nodes are connected if they differ by a single point mutation. Nodes with the same color have the same minimum free energy secondary structure (Legend). The inset enlarges a part of the largest component. Nodes are clustered based on their number of shared connections (based on ForceAtlas2 embedding in Gephi [73]. For clarity of representation, our display allows for overlapping nodes, such that the actual number of nodes may be more than the number of nodes that are visible. The graph in the figure illustrates the intertwined organization of different genotype networks and genotype sets. Because of its large number of nodes (39,401) and edges (311,000), not all nodes and edges are visible, and accurate accounting of component numbers is thus not possible.
One can subdivide the nodes (sequences) in this graph into subsets of sequences associated with each one of the nine MFE secondary structures. Each such subset itself forms a genotype network with multiple connected components. Specifically, depending on the structure, these networks comprise between 943 to 8,513 nodes, and have between 3 to 21 connected components each. All of them are positively assortative, with assortativity values between 0.13 and 0.82 (see Methods), meaning that highly connected sequences tend to be connected to other highly connected sequences. It takes 5 to 10 mutations to travel between the most distant two nodes while staying within the largest component of each network (see column "Diameter" in Table 1).
Our simulations of evolving populations use the fraction of time that sequences spend in their MFE structure as a measure of fitness. This fraction varies, depending on structure, between 0.27 and 0.97 among the nine structures. Here, a value of 0.27 (0.97) means that a sequence spends 27 (97) percent of the time in its MFE structure, and the remaining 73 (3) percent in some other structures with higher free energy. (The MFE structure can be viewed as the structure in which a sequence spends more time than in any other structure, even though it may not spend the majority of its time in this structure.) Within the genotype network of each structure, it varies between values ranging from 0.27 to 0.96 for structure. ((....)). to values ranging from 0.51 to 0.71 for structure. ((.....)).
How an evolving population explores a fitness landscape depends in part on the fraction of its sequences' neighbors that are neutral. If a population has a larger neutral neighborhood, it may be able to access larger regions of the landscape through non-deleterious mutations, and may have a higher chance of finding beneficial mutations and new phenotypes. We computed the size of neutral neighborhoods, because it may be important for our evolutionary analysis. This size is a function of effective population size Ne [45], which in our case is identical to the census population size N, because the populations we simulate are unstructured, do not experience migration, and do not fluctuate in size. Following standard population genetic theory [46, 47], we consider two neighboring sequences neutral if their fitness differs by less than 1/N. Figure S1a shows neutral neighborhood size as an average over 1,000 randomly sampled RNA molecules of length 10 that fold into one of the nine structures we consider (Table 1). Unsurprisingly, neutral neighborhood size decreases with increasing population size, where neutral evolution and crossing of fitness valleys becomes more difficult.
To ensure that any observations we obtain from our simulations are not artefacts of using very short and non-biological sequences, we also simulated the evolution of four longer biological RNA molecules (30-43nts) that originate from different organisms, have different functions, and fold into different predicted secondary structures (Table 2). Specifically, these sequences include a ribozyme, a noncoding transcript, a small non-messenger RNA (snmRNA), and a small nuclear RNA (snoRNA). (We note that even though the secondary structures of these sequences occur in nature, most of the sequences that we analyze and that fold into these structures may not occur in nature.) While the large number of sequences folding into such longer structures [34] precludes an exhaustive analysis of their genotype networks, we find that the neutral neighborhoods of these genotype networks also decrease in size with increasing population size (Figure S1b).
Biological RNA sequences used in this study.
| Identifier | Organism | RNA type | Sequence | Secondary structure |
|---|---|---|---|---|
| AF357483 | Mus musculus | snmRNA | AAGCAAUUGUUUUACUUACAGUCUGGAGAA | ...(((((((.......))))).))..... |
| Z71666 | Saccharomyces cerevisiae | snoRNA | AGGCGUGUAACAUUUAUUGGUUACAACAUG | .....((((((........))))))..... |
| AB055777 | Homo sapiens | noncoding transcript | CUCUUUUACCAAGGACCCGCCAACAUGGGC | .(((((....)))))((((......)))). |
| AF036740 | Schistosoma mansoni | ribozyme | AUCCAGCUCACGAGUCCCAAAUAGGACGAAACGCGUCCUCCAU | ......................((((((.....)))))).... |
Columns from left to right: 'Identifier': the fRNAdb database identifiers [74] for the four sequences considered here; 'Organism': the organism in which the RNA sequence was identified; 'RNA type': functional classification of the RNA sequence; 'Sequence': the sequence of the RNA; 'Secondary structure': the secondary structure of the RNA sequence. We computed secondary structures using the fold function from the ViennaRNA package [75].
We quantified the ruggedness of the fitness landscapes of our RNA molecules in two ways. First, we counted the number of fitness peaks in each landscape of sequences of length 10, where we define a fitness peak as one or more sequences whose neighbors all have lower fitness. With the exception of structure 2 (Str2) and structure 3 (Str3), which have 10 and 23 peaks, respectively, all structures have fewer than 10 peaks (Figure S2). This analysis was not possible for the biological sequences, where too many sequences fold into any one structure. Second, we estimated the incidence of reciprocal sign epistasis, which causes fitness valleys to exist between a sequence and its two-mutant neighbor. In epistasis, the fitness effect of an allele depends on other alleles. Sign epistasis occurs when the sign of the fitness effect of an allele changes (e.g. from beneficial to deleterious) due to epistatic interactions. When a sequence and its two-mutant neighbor both show higher fitness than the two single-mutants connecting them in sequence space, one speaks of reciprocal sign epistasis [48]. We find that fewer than 10 percent of such sequence quadruplets show reciprocal sign epistasis. This holds regardless of whether we consider sequences of length 10 or longer sequences (Figure S3). Overall, these analyses show that the landscapes we examine are not highly rugged.
We simulated the adaptive evolution of sequences forming each one of the nine secondary structures of length 10, as well as each one of the four biological secondary structures. That is, we evolved populations of such sequences through 800 cycles (generations) of mutation and selection favoring an increase in the time that a sequence spends in the focal secondary structure (see Methods). We performed 50 replicates for each population simulation. Because we were interested in the influence of population size N and mutation rate µ on the speed of adaptive evolution, we varied both parameters systematically (0.0001 < µ < 1, 0.01 < Nµ < 10). In the following, we find it most useful to analyze our observations separately for varying µ and varying population mutation rates Nµ.
Adaptive evolution under varying mutation rate µ
µ=0.0001
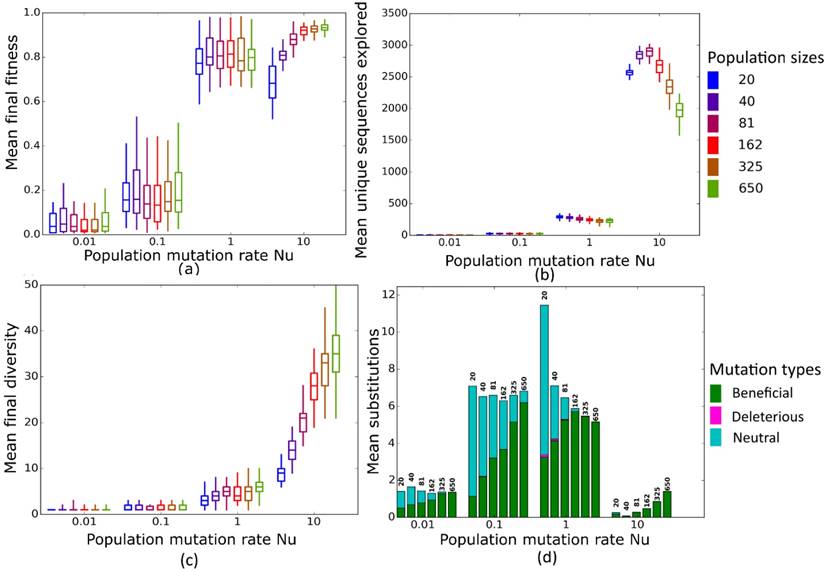
At this low mutation rate Ne<<1 for all population sizes we considered. All populations of sequences with length 10 reach similar mean fitness at the end of evolution (Figure 2a), except for a minority of structures where the largest populations reach a significantly higher mean fitness (Str2, Str7 and Str9, Figure S4). In contrast, our longer sequences show a consistent and significant increase in final mean fitness as population size increases (Figure 3a). The likely reason of this difference between sequences of length 10 and biological sequences is that the incidence of neutral, beneficial, and deleterious mutations differs between them. In sequences of length 10, beneficial mutations are less common than deleterious ones, whereas in longer sequences, they are more common (Figure S5). These differences may result from differences in landscape size. Our biological sequences, due to their length, have a vastly larger landscape (430-443 sequences) than sequences of length 10 (410 sequences), which may influence the distribution of fitness effects. An additional difference may come from how we implemented selection. In sequences of length 10, we allowed only sequences whose MFE secondary structure matches the target structure to survive, which permitted us to restrict the evolutionary dynamics to sequences with the same MFE structure. In contrast, for longer sequences, we allowed any sequence that folds into a given target structure to survive. Moreover, we initialized populations of the longer RNAs from random sequences whose fitness was less than 0.01, whereas populations of 10-nucleotide sequences started from sequences with a fitness in the bottom 5%. This is because the landscapes of our longer (biological) RNA structures were too large to analyze exhaustively. These two differences may also affect the distribution of fitness effects and consequently, the prevalence of beneficial mutations between the 10-nucleotide and longer sequences. As a result of the greater incidence of beneficial mutations, larger populations of longer sequences can increase their fitness more easily. It may seem surprising that population size makes a difference at mutation rates this small, but larger populations have an advantage at several levels. Firstly, in every generation, larger populations are slightly more diverse (Figures 2c and S6a), even though the difference between larger and smaller populations is minute. Second, across all 50 simulation replicates, larger populations visit more unique sequences than smaller populations (Figures 2b and S6b). In other words, because larger populations produce more mutations per generation than smaller populations, they are better at exploring genotype space. Third, and consistent with this observation, larger populations also experience more nucleotide substitutions (Figure 2d), the majority of which are beneficial (e.g. Figure 2d). The reason is that selection is more efficient in larger populations [8, 11, 13]. The difference between sequences of length 10 and longer sequences highlights the importance of the distribution of mutational effects and of its interactions with population size for adaptation. When deleterious mutations are prevalent, larger populations may not adapt faster. However, when beneficial mutations are prevalent, larger populations may adapt significantly faster.
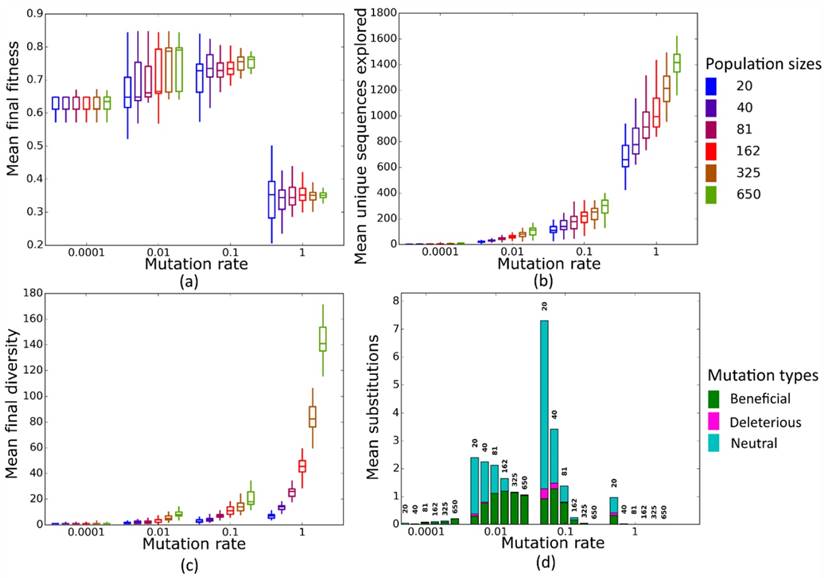
Simulated evolution of sequences with secondary structure 1 (Str1, Table 1) at varying mutation rates and population sizes. We randomly-selected a low-fitness sequence to initialize each simulation, and then simulated 800 generations of mutation and selection. We performed 50 replicate simulations for each mutation rate (horizontal axes) and population size (see Methods). Boxplots show (a) final mean population fitness, (b) total unique sequences explored, and (c) final population diversity (number of unique sequences at generation 800). Each box encloses the second and third quartiles of the 50 replicates, the center line corresponds to the median, and whiskers depict the minimum and maximum values obtained from any replicate, excluding the outliers. (d) Mean numbers of unique beneficial, deleterious, and neutral substitutions (green, pink, and cyan) are summarized as bars for the 50 replicates at each mutation rate (horizontal axis) and population size (labels above bars).
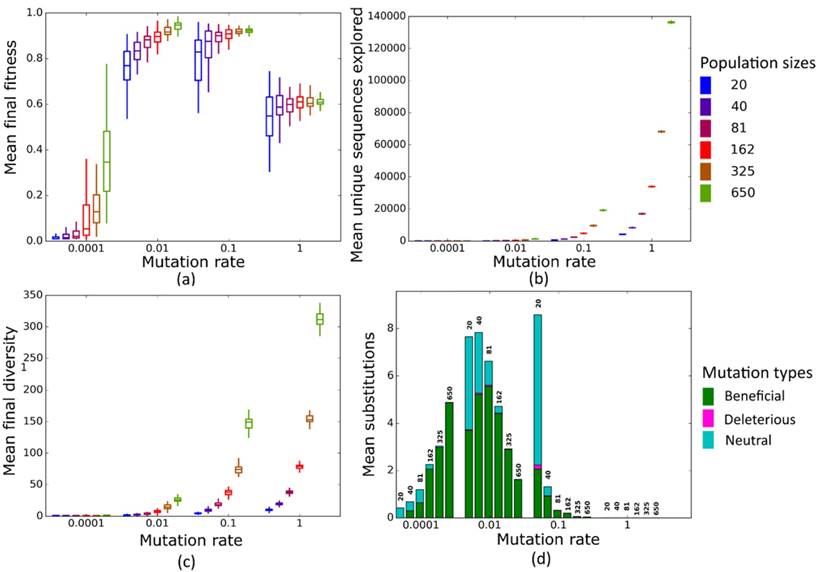
Simulated evolution of sequences with secondary structure AF036740 (Table 2) at varying mutation rates and population sizes. We randomly-selected a low-fitness sequence to initialize each simulation, and then simulated 800 generations of mutation and selection. We performed 50 replicate simulations for each mutation rate (horizontal axes) and population size (see Methods). Boxplots show (a) final mean population fitness, (b) total unique sequences explored, and (c) final population diversity (number of unique sequences at generation 800). Each box encloses the second and third quartiles of the 50 replicates, the center line corresponds to the median, and the whiskers depict the minimum and maximum values obtained from any replicate, excluding the outliers. (d) Mean numbers of unique beneficial, deleterious, and neutral substitutions (green, pink, and cyan) are summarized as bars for the 50 replicates at each mutation rate (horizontal axis) and population size (labels above bars).
µ=0.01
At this mutation rate, all populations reach a higher final mean fitness than at µ=0.0001 (Figures 2a and 3a). Two different regimes are relevant to understand the evolutionary dynamics of populations at different sizes N. At smaller population sizes (N=20, N=40, and N=81), Nµ < 1, whereas at larger sizes (N=162, N=325, and N=650) Nµ > 1. In the latter case, populations are expected to be polymorphic most of the time [49], which raises the possibility of clonal interference. That is, a population may harbor more than one beneficial sequence variant, and the two sequences may compete for fixation, resulting in lower fixation rates for either variant. We first wished to find out whether clonal interference occurs in our populations. Figures S7a and S7b show the frequency of the average number of unique sequences per generation in each population, and classify these sequences according to their fitness effect -- beneficial, neutral, or deleterious -- relative to the ancestral sequence at the start of the simulation. Clearly, as N increases, the number of unique beneficial alleles that are present at any one time in a population increases as well (Figures S7a and S7b). We also find that nucleotide substitution rates drop for populations with population mutation rates Nµ > 1 (i.e. N=162, N=325, and N=650), both for sequences of length 10 (Figure 2d) and for our longer sequences (Figure 3d). But despite increased clonal interference and decreased substitutions in large populations, we also find that larger populations generally have higher final mean fitness (Figure S8a). Specifically, final fitness is significantly higher for seven out of the nine structure of length 10 (all but Str4 and Str9), and for all our longer, biological sequences (Figure S8b). To find out what may be responsible for this increase, we pooled data from simulations at different population sizes, and asked whether final mean population fitness is correlated with two measures of population diversity, namely the total number of sequences explored by a population, and the total diversity of a population in the last generation (generation 800, see Methods). In populations of sequences of length 10, mean final population fitness showed a significant positive association with the total number of explored sequences (Table S2, Figure S9a), and a significantly positive association with population diversity for all structures except Str1 (Table S1, Figure S9b). Mean final fitness has a significant positive association with total number of explored sequences and population diversity for longer (biological) sequences (Figures S10a and S10b). We note that larger populations explore more unique sequences during evolution (Figure 2b) and are on average more diverse in the last generation (Figure 2c). Taken together, these observations suggest an explanation for the consistently higher fitness in large populations: Such populations explore more sequences and thus have higher standing variation, which increases the prevalence of beneficial alleles (Figures S7c and S7d). A greater number of beneficial alleles, in turn, is associated with an increase in the average fitness of a population (Figures S11a and S11b), even when no mutations are fixed. In sum, the final mean fitness of a population is not completely determined by clonal interference, but also depends on a population's genetic diversity.
µ=0.1
At this mutation rate, populations arrive at a mean final fitness similar to that at µ=0.01 (Figures 2a and 3a). All population sizes are in the regime of Nµ > 1 where clonal interference occurs and becomes stronger in large populations. For all but four sequences of length 10 (Figure S12a), we no longer observe a significant increase in average population fitness as population size increases, but such an increase still exists for longer sequences (Figure S12b). To explain the observation that mean fitness does not decline in larger populations, even though clonal interference becomes stronger, it helps again to consider the incidence of nucleotide substitutions and population diversity. At µ=0.1, smaller populations fix more mutations than large populations, whereas large populations fix hardly any mutations (Figures 2d and 3d) due to clonal interference. However, not unexpectedly, larger populations again explore more unique sequences than smaller populations (Figure 2b). This reinforces the notion that increased sequence exploration can override the influence of clonal interference on final mean fitness. Populations with few substitutions but high diversity and more beneficial mutations (Figure S13) have a higher average fitness than sequences with lower diversity and exploration but more substitutions. The difference between sequences of length 10 (little increase in mean fitness at larger N) and longer sequences (larger increase in mean fitness) is consistent with this notion. For example, populations with size N=650 and size N=20 differ in mean fitness by approximately 10% for the biological structure AF036740, but only by about 5% for Str1 of length 10. The reason is that the total number of explored sequences increases to a much greater extent between the smallest and largest population size in our longer sequences (ca. 30-fold) than for sequences of length 10 (7-fold) (Figure S14, similar patterns exist between other structures (data not shown)). This may be because longer (biological) structures have larger landscapes.
µ=1
In this regime, all populations have Nµ >> 1. Just as for µ=0.1, we do not observe dramatic differences in final mean fitness as population sizes vary (Figures 2a and 3a). More strikingly, however, mean fitness at all population sizes is lower than at smaller mutation rates. The reason of this fitness decrease is the high fraction of mutant sequences per generation. Each individual sequence on average experiences one mutation per generation, which drives a population away from high-fitness sequences. Consequently, the mean fitness of the population fluctuates around a low value, and populations fix few mutations.
Adaptive evolution under varying population mutation rates Nµ
As the preceding observations showed, mutation rates interact with population sizes to influence adaptive evolution. We next wanted to find out whether the population mutation rate Nµ, a central quantity in population genetics, is sufficient to capture this interaction.
Nµ=0.01 to Nµ=1
At these low to moderate population mutation rates, mean population fitness does not depend on population size (Figures 4a and 5a), nor does the mean final diversity of populations (Figures 4c and 5c), which suggests that Nµ may be sufficient to describe the evolutionary dynamics of populations. However, at least for Nµ =1, the number of explored sequences decreases with population size N (Figure 4b and 5b). The likely reason is that smaller populations have larger neutral neighborhoods (Figures S1a and S1b), which means that fewer mutations will be eliminated by natural selection, and more sequences can be explored through mutation. This is also consistent with the observation that larger populations experience fewer nucleotide substitutions, especially of neutral mutations, at Nµ=1 (Figures 4d and 5d). It can also be explained by the larger size of neutral neighborhoods at small N, which leads to more neutral mutations, and thus to more neutral substitution events. In sum, even though final mean fitness does not depend on N for small to moderate Nµ, population diversity and substitution rates do depend on population size. Nµ is thus not the only relevant parameter describing the evolutionary dynamics of our populations.
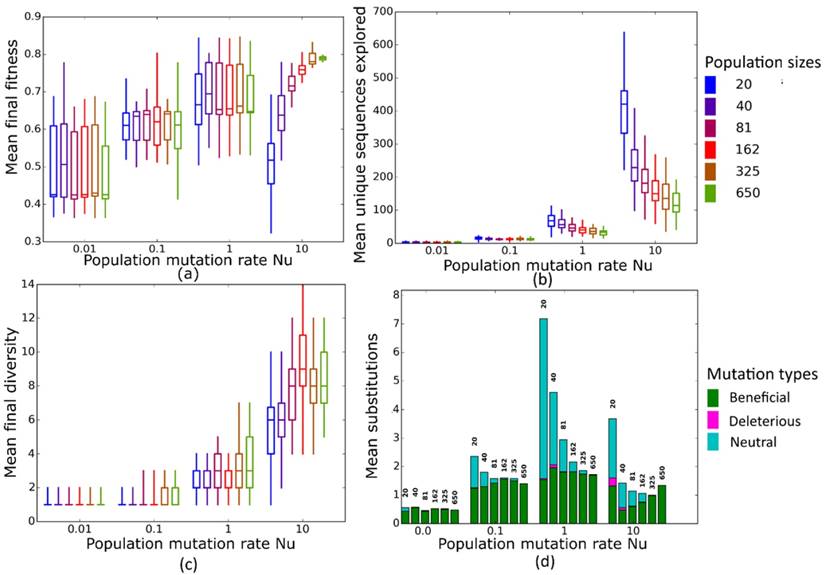
Simulated evolution of sequences with secondary structure 1 (Str1, Table 1) at varying population mutation rates Nµ and population sizes. We randomly-selected a low-fitness sequence to initialize each simulation, and then simulated 800 generations of mutation and selection. We performed 50 replicate simulations for each mutation rate (horizontal axes) and population size (see Methods). Boxplots show (a) final mean population fitness, (b) total unique sequences explored, and (c) final population diversity (number of unique sequences at generation 800). Each box encloses the second and third quartiles of the 50 replicates, the center line corresponds to the median, and the whiskers depict the minimum and maximum values obtained from any replicate, excluding the outliers. (d) Mean numbers of unique beneficial, deleterious, and neutral substitutions (green, pink, and cyan) are summarized as bars for the 50 replicates at each mutation rate (horizontal axis) and population size (labels above bars).
Simulated evolution of sequences with secondary structure AF036740 (Table 2) at varying population mutation rates Nµ and population sizes. We randomly-selected a low-fitness sequence to initialize each simulation, and then simulated 800 generations of mutation and selection. We performed 50 replicate simulations for each mutation rate (horizontal axes) and population size (see Methods). Boxplots show (a) final mean population fitness, (b) total unique sequences explored, and (c) final population diversity (number of unique sequences at generation 800). Each box encloses the second and third quartiles of the 50 replicates, the center line corresponds to the median, and the whiskers depict the minimum and maximum values obtained from any replicate, excluding the outliers. (d) Mean numbers of unique beneficial, deleterious, and neutral substitutions (green, pink, and cyan) are summarized as bars for the 50 replicates at each mutation rate (horizontal axis) and population size (labels above bars).
Nµ=10
At the largest population mutation rates, N affects not only the number of explored sequences (Figures 4c and 5c), the final population diversity (Figures 4b and 5b), and the number of substitution events (Figures 4d and 5d), but also the final mean fitness (Figures 4a and 5a). This underscores that Nµ cannot account for all aspects of the evolutionary dynamics. Specifically, at constant Nµ =10, mean final fitness increases strongly with N (Figures 4a and 5a). At least two causes can help explain this pattern. First, at constant Nµ, larger populations may fix more beneficial mutations, because selection is stronger in such populations. Second, and more importantly, a higher population mutation rate may be more destabilizing for smaller populations than for larger populations. For example, ten new mutations per population and generation means that half of all sequences in the smallest populations (N=20) are mutated per generation, whereas only about 1.5 percent of sequences in the largest populations (N=650) are mutated. Such a high incidence of mutation in the largest populations can drive a population away from a fitness peak, and overwhelm natural selection's power to increase mean fitness.
Discussion
Understanding the rate at which populations undergo evolutionary adaptation is central to research areas such as conservation biology [50-52], and microbial evolutionary biology [2, 53-55]. Experimental approaches often have difficulties measuring quantities that are crucial to understand a population's evolutionary dynamics completely [13, 56-58], whereas theoretical approaches are often forced to make simplifying assumptions [5, 6, 9, 29]. Here we tried to overcome some of these limitations by simulating the adaptive evolution of RNA molecules on a biophysically determined adaptive landscape. This helped us avoid making ad hoc assumptions about landscape structure, and allowed us to study adaptive dynamics in more detail than experimental approaches could. Our observations suggest an unexpectedly complex interaction between mutation rate and population size. First, at any one mutation rate, final population mean fitness tends to increase with population size, and especially for the longer, biological RNA structures we analyzed (Figure 3a). This holds even where Nµ > 1 and thus where clonal interference reduces the number of nucleotide substitutions. This observation is significant, because the substitution rate, especially that of beneficial mutations, is sometimes treated as being equivalent to the rate of adaptive evolution [18, 29, 49, 59-62]. On the adaptive landscape we study, this is not the case. Even though larger populations with more clonal interference experience fewer substitution events, their final fitness is higher. At very high mutation rates, large populations hardly have any substitutions (Figures 2d and 3d), but they can still achieve a higher final mean fitness (Figures 2a and 3a). The likely reason is that large populations are more likely to discover beneficial mutations, as long as enough such mutations exist (Figures 2b and 3b). And when such beneficial alleles occur in a population, they may help increase final mean fitness, even when they do not become fixed. This pattern is consistent with a prevalence of soft selective sweeps ([63] p. 472), where multiple beneficial mutations can co-occur and rise in frequency, even though none of them goes to fixation [64,65].
Second, at large Nµ, final mean fitness does not just depend on Nµ, but also on population size N. Specifically, at a given Nµ, larger populations achieve higher mean fitness. The reason is that a high population mutation rate translates into higher mutation rate per individual in smaller populations, which can overwhelm selection.
Third, the mean number of unique sequences explored by an evolving population, as well as the mean final population diversity depend on population size, both for any given µ, and for any given Nµ.
Our observations also speak to the question whether adaptive evolution is more rapid in large or small populations, because several conflicting factors can influence the speed of adaptation in such populations [18]. We find that smaller populations have no adaptive advantage over larger populations, because they do not reach higher mean final fitness at any given mutation rate. Thus, even though smaller populations can escape local fitness peaks more easily, have larger neutral neighborhoods (Figures S1a and S1b), and could thus explore more sequences (Figure 4b), they are at a disadvantage, at least on the relatively smooth fitness landscape we study (Figures S3 and S2).
Among the limitations of our study is that we considered only asexual populations. Recombination may alter the evolutionary dynamics substantially [66-71]. In addition, the landscapes we study are not very rugged, with few fitness peaks for most structures (Figures S2 and S3), and little reciprocal sign epistasis that might slow down adaptive evolution (Figure S3). More rugged landscapes could yield substantially different evolutionary dynamics.
In sum, our observations suggest that simple models of evolutionary dynamics, especially on highly simplified fitness landscapes, need to be taken with caution, because evolutionary adaptation on a complex landscape can reveal interdependencies between various factors affecting adaptive evolution, particularly when Nµ is very large.
Methods
Network analysis
We constructed all networks and characterized their graph-theoretical properties using the iGraph library (version 0.7.1) [72] for Python. We used Gephi (version 0.9.1) [73] for network visualization.
RNA molecules
Our analysis focuses on two different kinds of RNA molecules. The first kind comprises all RNA molecules of length 10 that have at least a paired base in their minimum free energy (MFE) secondary structure. We chose these short sequences to be able to fully analyze and visualize their genotype space. The second kind comprises a small number of longer RNA sequences with biological functions, which we chose from the database of functional RNA molecules fRNAdb [74]. Specifically, we chose four short RNA molecules from different organisms and with different functions, a snmRNA (small non-messenger RNAs), a snoRNA (small nucleolar RNA), a non-coding transcript, and a ribozyme (Table 2). The major difference between sequences of length 10 and biological sequences is their length, but this difference may influence other properties, such as the incidence of neutral and deleterious mutations.
Calculating the fitness of RNA sequences
Our measure of fitness is based on the amount of time that an RNA molecule spends in a given structure, such as its minimum free energy (MFE) secondary structure. To calculate the MFE secondary structure of a sequence we used the function fold in the ViennaRNA package (version 2.1.9) [75]. To calculate the time that a sequence spends in a given structure (the probability that it is found in this structure at any given time), we used the following procedure. First, we calculated the ensemble free energy F of the sequence using again the fold program, where F= -kT ln(Z) [75]. Here, Z is the partition function of the sequence, K is the Boltzmann constant (1.98717 × 10⁻³ kcal/K), and T is the absolute temperature (310.15 K or 37° C in our case) [41]. Thus, the partition function of a sequence is equal to Z=eF/-kT. Second, we calculated the free energy E of the focal structure using the energy_of_struct function within the ViennaRNA package. These calculations also allowed us to compute the probability that the sequence can be found in the focal structure as p=e(-E/kT)/Z [41]. For a structure whose free energy lies outside an energy interval of 5kT (3 kcal/mol at 37° C) above the MFE of the sequence, the time spent in the structure is very small, and we thus set it to zero for the purpose of our simulations.
We used two different measures of fitness, which are both defined relative to an arbitrary target secondary structure S. For the first measure, we set an RNA molecule's fitness to zero if its MFE secondary structure was different from S. If the molecule's MFE was identical to S, we assumed that its fitness was equal to the time that the sequence spent in S. We used this measure to calculate the fitness of our RNA sequences of length 10. This measure of fitness ensures that the evolution of RNA populations is confined to the set or network of genotypes that have S as their MFE structure.
The second fitness measure, which we used only for the longer sequences, is identical to the first, except that we did not assign sequences whose MFE structure differs from the target structure S a fitness value of 0. Instead, we assumed that their fitness is equal to the time they spend in the target structure.
Population evolution model
We used only non-modified ribonucleotides [76-79], i.e. A, C, G and U, in our discrete-time simulations of RNA sequence evolution. Any one evolving population initially consisted of identical sequences whose MFE structure is the target structure for selection. Because we wanted to explore how such sequences evolve towards high fitness, that is, a large fraction of time spent in the MFE structure, we wanted to initialize populations to a state of low fitness. Specifically, in our simulations of sequence evolution for sequences of length 10, we arbitrarily chose a sequence of length 10, whose fitness was in the bottom 5% of the fitness distribution (i.e., it spends little time in its MFE structure) as the initial sequences for each replicate simulation. For each of our 50 replicate evolution simulations of longer, biological sequences, we arbitrarily chose an initial sequence whose fitness was smaller than one percent, i.e. it spent less than 1% of its time in the target structure. The length of this sequence was exactly the same as that of the biological sequence, so that it could in principle fold into the same target structure. Each of these replicate simulations thus started from a different initial sequence, but with otherwise identical parameters.
Our simulations proceeded through repeated cycles (“generations”) of mutation and selection. For a given mutation rate µ per sequence and generation (0.0001 < µ < 1), we mutated individual sequences as follows. We chose a random number n from a Poisson distribution with mean µ as the number n of nucleotides to be mutated in the sequence. To mutate the sequence, we chose a random position (with a uniform distribution along the sequence) for mutation, replaced its nucleotide by a randomly chosen one of the three possible alternative nucleotides, and repeated this process n times.
After all sequences had been mutated, we determined their fitness, and chose sequences for survival into the next generation by randomly sampling with replacement from the mutated population, where we weighted the probability that a sequence is sampled by its fitness. Sampling with replacement ensures a constant population size across generations.
Neutral neighborhood size calculation
We chose 1,000 random sequences and calculated their fitness based on the MFE structure of a reference sequence, which could be one of our natural RNA sequences, or, for sequences of length 10, a sequence with maximum fitness for a given structure. For each of these 1,000 sequences, we calculated the fitness of all one mutant neighbors. If the fitness difference between a sequence and any one of its neighbors was smaller than 1/N, we considered the neighbor to be in the sequence's neutral neighborhood. We report the average fraction of neighbors of the 1,000 sequences that are neutral.
Estimating reciprocal sign epistasis for different sequences
As a measure of landscape ruggedness, we used the fraction of sequences that are separated from their two-mutant neighbors (sequences separated by two single nucleotide changes) by a fitness valley, i.e., where both one-mutant neighbors have lower fitness than the sequence itself and the two-mutant neighbor. As in our other analyses, we considered two fitness values different if they differed by more than 1/N.
To compute the incidence of reciprocal sign epistasis for any one secondary structure, we first chose from genotype space 1,000 random sequences that were capable of forming this secondary structure. To do so for biological sequences, we generated random RNA sequences (with uniform and independent nucleotide distributions across the nucleotide sites), and verified for each sequence whether it could form the desired structure, until we had identified 1,000 such sequences. We considered a sequence as being able to form the desired structure, if this structure occurred among all structures within an energy interval of 5kT above the sequence's MFE structure. For sequences of length 10, we simply chose 1,000 random sequences from each genotype network (or all sequences in the genotype network if the size of the network was less than 1,000). For all 1,000 sequences thus generated, we counted the number of fitness valleys between that sequence and all its two-mutant neighbors that had higher fitness.
Computing population diversity
We used the number of sequences that exist in an evolving population in any one generation as a measure of diversity of the population. More specifically, we computed two complementary measures of population diversity. The first is the average number of unique sequences in the last generation (800), where the average is taken over all replicate simulations. The second is the total number of unique sequences that occurred during the entire course of a simulation, i.e., each sequence that existed in a population during at least one generation, averaged over all replicates.
Counting the incidence of deleterious, neutral and beneficial mutations
To identify the number and type of mutations that occur in any one generation of a simulation, we tracked every mutation in single sequences that occurred during a simulation. We compared the fitness of a sequence before and after each mutation, and considered the mutation neutral if this difference was less than 1/N. If the fitness of the sequence increased (decreased) by more than 1/N after a mutation, we considered the mutation beneficial (deleterious).
Number of substitutions
At each generation of a population's simulation, we considered any mutant sequence as having become fixed if it was different from the founding sequence of the population, and if its population frequency exceeded a value of 90% (following common practice in population simulations [5, 80] to limit computational cost). We counted any sequence fixation event only once. That is, if a sequence exceeded this fixation threshold in any one generation, dropped below this threshold later on, and then exceeded the threshold once again at a later time, we considered that the sequence underwent only one fixation event.
Finding network peaks
We used the Python package Genonets [81] to find fitness peaks in the adaptive landscape defined on the genotype network of sequences with the same structure. The package requires a minimal fitness differential Δ between two neighboring sequences to call two sequences different in their fitness. The smaller this minimal fitness differential, the greater may be the number of apparent peaks in a rugged fitness landscape. We used Δ=0.
Supplementary Material
Supplementary figures and tables.
Abbreviations
MFE: Minimum Free energy; snmRNA: small non-messenger RNA; snoRNA: small nuclear RNA
Acknowledgements
AW acknowledges support by Swiss National Science Foundation grant 31003A_146137, by an EpiphysX RTD grant from SystemsX.ch, as well as by the University Priority Research Program in Evolutionary Biology at the University of Zurich.
Author's contributions
ARV, KS, and AW designed the study. ARV performed all simulation analyses. ARV, KS, and AW analyzed data and wrote the manuscript.
Competing Interests
The authors have declared that no competing interest exists.
References
1. Wright S. The roles of mutation, inbreeding, crossbreeding and selection in evolution. Proceedings of the Sixth International Congress on Genetics. 1932;1:356-66
2. Allen Orr H. The rate of adaptation in asexuals. Genetics. 2000;155(2):961-8
3. McDonald B a, Linde C. Pathogen population genetics, evolutionary potential, and durable resistance. Annu Rev Phytopathol. 2002;40:349-79
4. Wilke CO. The speed of adaptation in large asexual populations. Genetics. 2004;167(August):2045-53
5. Desai MM, Fisher DS. Beneficial mutation-selection balance and the effect of linkage on positive selection. Genetics. 2007;176(3):1759-98
6. Desai MM, Fisher DS, Murray AW. The speed of evolution and maintenance of variation in asexual populations. Curr Biol. 2007;17(5):385-94
7. Handel A, Rozen DE. The impact of population size on the evolution of asexual microbes on smooth versus rugged fitness landscapes. BMC Evol Biol. 2009;9:236
8. Jain K, Krug J, Park S-CC. Evolutionary advantage of small populations on complex fitness landscapes. Evolution. 2011;65(7):1945-55
9. Lourenço JM, Glémin S, Galtier N. The rate of molecular adaptation in a changing environment. Mol Biol Evol. 2013;30(6):1292-301
10. Lobkovsky AE, Wolf YI, Koonin E V. Predictability of evolutionary trajectories in fitness landscapes. PLoS Comput Biol. 2011;7(12):e1002302
11. Szendro IG, Franke J, de Visser JAGM, Krug J. Predictability of evolution depends nonmonotonically on population size. Proc Natl Acad Sci. 2013;110(2):571-6
12. de Visser JAGM, Krug J. Empirical fitness landscapes and the predictability of evolution. Nat Rev Genet. 2014;15(7):480-90
13. Lachapelle J, Reid J, Colegrave N. Repeatability of adaptation in experimental populations of different sizes. Proc R Soc B Biol Sci. 2015;282(1805):20143033-20143033
14. Gandon S, Day T, Metcalf CJE, Grenfell BT. Forecasting epidemiological and evolutionary dynamics of infectious diseases. Trends Ecol Evol. 2016;31(10):776-88
15. Charlesworth B. Effective population size. Curr Biol. 2002;12(21):R716-7
16. Luikart G, Ryman N, Tallmon DA, Schwartz MK, Allendorf FW. Estimation of census and effective population sizes: the increasing usefulness of DNA-based approaches. Conserv Genet. 2010;11(2):355-73
17. Ohta T. The nearly neutral theory Of molecular evolution. Annu Rev Ecol Syst. 1992;23(1992):263-86
18. Lanfear R, Kokko H, Eyre-Walker A. Population size and the rate of evolution. Trends Ecol Evol. 2014;29(1):33-41
19. Akashi H, Osada N, Ohta T. Weak selection and protein evolution. Genetics. 2012;192(1):15-31
20. Komarova NL, Sengupta A, Nowak MA. Mutation-selection networks of cancer initiation: tumor suppressor genes and chromosomal instability. J Theor Biol. 2003;223(4):433-50
21. Iwasa Y. Stochastic tunnels in evolutionary dynamics. Genetics. 2004;166(3):1571-9
22. Weinreich DM, Chao L. Rapid evolutionary escape by large populations from local fitness peaks is likely in nature. Evolution. 2005;59(6):1175-82
23. Weissman DB, Feldman MW, Fisher DS. The rate of fitness-valley crossing in sexual populations. Genetics. 2010;186:1389-410
24. Altland A, Fischer A, Krug J, Szendro IG. Rare events in population genetics: stochastic tunneling in a two-locus model with recombination. Phys Rev Lett. 2011;106(8):88101
25. Gerrish PJ, Lenski RE. The fate of competing beneficial mutations in an asexual population. Genetica. 1998;102-103(1-6):127-44
26. Cowperthwaite MC, Bull JJ, Meyers LA. Distributions of beneficial fitness effects in RNA. Genetics. 2005;170(4):1449-57
27. Eyre-Walker A, Keightley PD. The distribution of fitness effects of new mutations. Nat Rev Genet. 2007;8(8):610-8
28. Tamuri AU, dos Reis M, Goldstein RA. Estimating the distribution of selection coefficients from phylogenetic data using sitewise mutation-selection models. Genetics. 2012;190(3):1101-15
29. Campos PRA, Wahl LM. The adaptation rate of asexuals: deleterious mutations, clonal interference and population bottlenecks. Evolution. 2010;64(7):1973-83
30. Cordell HJ. Epistasis: what it means, what it doesn't mean, and statistical methods to detect it in humans. Hum Mol Genet. 2002;11(20):2463-8
31. de Visser JAGM, Cooper TF, Elena SF. The causes of epistasis. Proc Biol Sci. 2011;278(1725):3617-24
32. Rozen DE, Habets MGJL, Handel A, de Visser JAGM. Heterogeneous adaptive trajectories of small populations on complex fitness landscapes. PLoS One. 2008;3(3):e1715
33. Kryazhimskiy S, Rice DP, Desai MM. Population subdivision and adaptation in asexual populations of Saccharomyces cerevisiae. Evolution. 2012;66(6):1931-41
34. Schuster P, Fontana W, Stadler PF, Hofacker IL. From sequences to shapes and back - a case study in RNA secondary structures. Proc R Soc B Biol Sci. 1994;255(1344):279-84
35. Schuster P. Prediction of RNA secondary structures: from theory to models and real molecules. Reports Prog Phys. 2006;69(5):1419-77
36. Schuster P, Fontana W. Chance and necessity in evolution: lessons from RNA. Phys D Nonlinear Phenom. 1999;133(1-4):427-52
37. Wuchty S, Fontana W, Hofacker IL, Schuster P. Complete suboptimal folding of RNA and the stability of secondary structures. Biopolymers. 1999;49(2):145-65
38. Mortimer SA, Kidwell MA, Doudna JA. Insights into RNA structure and function from genome-wide studies. Nat Rev Genet. 2014;15(7):469-79
39. Zur H, Tuller T. Strong association between mRNA folding strength and protein abundance in S. cerevisiae. EMBO Rep. 2012Mar1;13(3):272-7
40. Fontana W. Continuity in Evolution: On the Nature of Transitions. Science. 1998;280(5368):1451-5
41. Ancel LW, Fontana W. Plasticity, evolvability, and modularity in RNA. J Exp Zool. 2000;288(3):242-83
42. Zhuang X. Correlating structural dynamics and function in single ribozyme molecules. Science. 2002;296(5572):1473-6
43. Solomatin S V, Greenfeld M, Chu S, Herschlag D. Multiple native states reveal persistent ruggedness of an RNA folding landscape. Nature. 2010;463(7281):681-4
44. Tan E, Wilson TJ, Nahas MK, Clegg RM, Lilley DMJ, Ha T. A four-way junction accelerates hairpin ribozyme folding via a discrete intermediate. Proc Natl Acad Sci. 2003;100(16):9308-13
45. Hartl DL, Clark AG. Principles of Population Genetics. Third. Sinauer Associates, Inc. Sunderland, Massachusetts: Sinauer Associates, Inc. 1997
46. Kimura M. On the probability of fixation of mutant genes in a population. Genetics. 1962;47(6):713-719
47. Ohta T, Gillespie J. Development of neutral and nearly neutral theories. Theor Popul Biol. 1996;49(2):128-42
48. Poelwijk FJ, Kiviet DJ, Weinreich DM, Tans SJ. Empirical fitness landscapes reveal accessible evolutionary paths. Nature. 2007;445(7126):383-6
49. Park S-C, Krug J. Clonal interference in large populations. Proc Natl Acad Sci U S A. 2007;104(46):18135-40
50. Lynch M, Lande R. The critical effective size for a genetically secure population. Anim Conserv. 1998;1(1):S136794309822110X
51. Franklin IR, Frankham R. How large must populations be to retain evolutionary potential? Anim Conserv. 1998;1(1):69-70
52. Stockwell CA, Hendry AP, Kinnison MT. Contemporary evolution meets conservation biology. Trends Ecol Evol. 2003;18(2):94-101
53. de Visser JAGM, Rozen DE. Limits to adaptation in asexual populations. J Evol Biol. 2005;18(4):779-88
54. Barrick JE, Yu DS, Yoon SH, Jeong H, Oh TK, Schneider D. et al. Genome evolution and adaptation in a long-term experiment with Escherichia coli. Nature. 2009;461(7268):1243-7
55. Wiser MJ, Ribeck N, Lenski RE. Long-term dynamics of adaptation in asexual populations. Science (80- ). 2013;342(6164):1364-7
56. Lenski RE, Rose MR, Simpson SC. Long-term experimental evolution in Escherichia coli. I. Adaptation and divergence during 2,000 generations. Am Nat. 1991;138(6):1315-41
57. Lenski RE, Travisano M. Dynamics of adaptation and diversification: a 10,000-generation experiment with bacterial populations. Proc Natl Acad Sci U S A. 1994;91(15):6808-14
58. Elena SF, Lenski RE. Evolution experiments with microorganisms: the dynamics and genetic bases of adaptation. Nat Rev Genet. 2003;4(6):457-69
59. Campos PRA, Wahl LM. The effects of population bottlenecks on clonal interference, and the adaptation effective population size. Evolution. 2009;63(4):950-8
60. Gossmann TI, Keightley PD, Eyre-Walker A. The effect of variation in the effective population size on the rate of adaptive molecular evolution in eukaryotes. Genome Biol Evol. 2012;4(5):658-67
61. Pokalyuk C, Mathew LA, Metzler D, Pfaffelhuber P. Competing islands limit the rate of adaptation in structured populations. Theor Popul Biol. 2013;90:1-11
62. Wong A, Seguin K. Effects of genotype on rates of substitution during experimental evolution. Evolution. 2015;69(7):1772-85
63. Losos JB, Baum DA, Futuyma DJ, Hoekstra HE, Lenski RE, Moore AJ. et al. The Princeton Guide to Evolution. Princeton: Princeton University Press. 2013
64. Hermisson J, Pennings PS. Soft sweeps: molecular population genetics of adaptation from standing genetic variation. Genetics. 2005;169(4):2335-52
65. Pennings PS, Hermisson J. Soft sweeps II-molecular population genetics of adaptation from recurrent mutation or migration. Mol Biol Evol. 2006;23(5):1076-84
66. Muller HJ. Some genetic aspects of sex. Am Nat. 1932;66(703):118-38
67. Evans R. Niche expansion in bacteria: can infectious gene exchange affect the rate of evolution? Genetics. 1986;113(3):775-95
68. Ochman H, Lawrence JG, Groisman EA. Lateral gene transfer and the nature of bacterial innovation. Nature. 2000;405(6784):299-304
69. Zhang Y-X, Perry K, Vinci VA, Powell K, Stemmer WPC, del Cardayré SB. Genome shuffling leads to rapid phenotypic improvement in bacteria. Nature. 2002;415(6872):644-6
70. Otto SP, Gerstein AC. Why have sex? The population genetics of sex and recombination. Biochem Soc Trans. 2006;34(Pt 4):519-22
71. Cooper TF. Recombination speeds adaptation by reducing competition between beneficial mutations in populations of Escherichia coli. PLoS Biol. 2007;5(9):e225
72. Csardi G, Nepusz T. The igraph software package for complex network research. InterJournal. 2006 Complex Sy: 1695
73. Bastian M, Heymann S, Jacomy M. Gephi: an open source software for exploring and manipulating networks. Int AAAI Conf Weblogs Soc Media. 2009
74. Kin T, Yamada K, Terai G, Okida H, Yoshinari Y, Ono Y. et al. fRNAdb: A platform for mining/annotating functional RNA candidates from non-coding RNA sequences. Nucleic Acids Res. 2007:35 (SUPPL 1)
75. Lorenz R, Bernhart SH, Höner zu Siederdissen C, Tafer H, Flamm C, Stadler PF. et al. ViennaRNA Package 2.0. Algorithms Mol Biol. 2011;6(1):26
76. Paul MS. Inosine exists in mRNA at tissue-specific levels and is most abundant in brain mRNA. EMBO J. 1998;17(4):1120-7
77. Czerwoniec A, Dunin-Horkawicz S, Purta E, Kaminska KH, Kasprzak JM, Bujnicki JM. et al. MODOMICS: a database of RNA modification pathways. 2008 update. Nucleic Acids Res. 2009;37(Database):D118-21
78. Oleksyk TK, Smith MW, O'Brien SJ. Genome-wide scans for footprints of natural selection. Philos Trans R Soc Lond B Biol Sci. 2010;365(1537):185-205
79. Carlile TM, Rojas-Duran MF, Zinshteyn B, Shin H, Bartoli KM, Gilbert W V. Pseudouridine profiling reveals regulated mRNA pseudouridylation in yeast and human cells. Nature. 2014;515(7525):143-6
80. Vatsiou AI, Bazin E, Gaggiotti OE. Detection of selective sweeps in structured populations: a comparison of recent methods. Mol Ecol. 2016;25(1):89-103
81. Khalid F, Aguilar-Rodríguez J, Wagner A, Payne JL. Genonets server-a web server for the construction, analysis and visualization of genotype networks. Nucleic Acids Res. 2016;44(W1):gkw313
82. Barabási A-L. Assortativity and disassortativity. Network Science. Cambridge, UK: Cambridge University Press. 2016
Author contact
![]() Corresponding author: andreas.wagneruzh.ch
Corresponding author: andreas.wagneruzh.ch