Impact Factor ISSN: 1449-2288

 Global reach, higher impact
Int J Biol Sci 2017; 13(9):1192-1202. doi:10.7150/ijbs.21379 This issue Cite
Research Paper
Chronic Osteomyelitis Increases the Incidence of Type 2 Diabetes in Humans and Mice
Yicun Wang1*, Jun Wang1*, Zhantao Deng1, 2, 3*, Jiewen Jin2, 3, Hui Jiang1, Jia Meng1, Haidong Xu1, Jianning Zhao1, Guojing Sun1 ![]() , Hongbo Qian1
, Hongbo Qian1 ![]()
1. Department of Orthopedics, Jinling Hospital, School of Medicine, Nanjing University, Nanjing, Jiangsu, China;
2. Center for Translational Medicine, Nanjing University Medical School, Nanjing, Jiangsu, PR China;
3. Jiangsu Key Laboratory for Molecular Medicine, Nanjing University Medical School, Nanjing, PR China.
* These authors contributed equally to this work.
Received 2017-6-7; Accepted 2017-7-31; Published 2017-9-5
Abstract

Background: To compare the risk of type 2 diabetes (T2DM) between patients with and without chronic osteomyelitis (COM), both in humans and in mice, and to explore risk factors in COM patients who developed T2DM.
Methods: One hundred seven patients with COM and 114 patients without COM were consecutively enrolled and retrospectively analysed. Clinical data concerning the time to develop diabetes, glucose metabolism, lipid metabolism, inflammatory factors, mental health and frequency of specialist visits were collected. A mouse model of osteomyelitis was used to verify the presence of impaired glucose metabolism and depression. All data were processed by SPSS.
Results: The incidence of T2DM was 2.37-fold higher in patients with COM than in those without. In COM patients, subjects with T2DM (DDM) had higher BMI, less exercise and more frequent visits to specialists than those without (Con). Glucose and lipid metabolism were worse in patients with DDM. Patients with DDM had higher levels of white blood cells (12.9±2.1×10⁹/L vs. 11.7±2.2×10⁹/L, p=0.027), CRP (28.4±4.5 mg/L vs. 22.0±4.8 mg/L, p<0.001), TNF-α (13.5±5.0 pg/mL vs. 9.4±2.6 pg/mL, p= 0.003) and IL-6 (12.9±3.2 pg/mL vs. 9.2±2.7 pg/mL, p<0.001). Significantly increased fasting blood glucose concentrations and impairment of oral glucose tolerance tests were also observed in mice modelling osteomyelitis, which were accompanied by elevated TNF-α and IL-6 levels. Furthermore, the proportion of depression (63.2% vs. 35.2%, p=0.003) and severe anxiety (31.6% vs. 9.1%, p=0.002) were significantly higher in the DDM group. Osteomyelitis mice showed obvious depressive-like behaviours. The levels of TNF-α, IL-6, CRP, BMI, and LDL; lack of exercise; SAS; HAQ; and SF36 assessment were risk factors for the development of T2DM in COM patients.
Conclusions: Chronic osteomyelitis increased the incidence of T2DM in both humans and mice. Inflammation, mental illness and lack of exercise were risk factors for the occurrence of T2DM in osteomyelitis. Comprehensive consideration of patient history, including metabolism and mental health, is needed in planning future treatment.
Keywords: chronic osteomyelitis, diabetes, risk, inflammation, insulin resistance, mental health.
Introduction
Chronic osteomyelitis (COM) is one of the most common musculoskeletal infectious diseases [1] and is accompanied by various co-morbidities, such as diabetes, pressure ulcers and peripheral vascular disease [2]. Among these conditions, diabetes is one of the most important diseases.
Type 2 diabetes (T2DM) is one of the most common endocrine diseases worldwide, and it is estimated that by 2035, the population affected by T2DM will reach 592 million [3]. In China, the prevalence of T2DM reached 11.6% in 2010, which meant that there were 113.9 million people suffering from T2DM [4]. Among serious related complications, diabetic foot is the most disabling and poses a heavy burden on patients and society [5]. Diabetic patients are at higher risk for osteomyelitis [6]. An estimated 60% of diabetic foot ulcers are complicated by infection [7], and more than two-thirds of diabetic patients with foot ulcers suffer from lower limb amputation because of infection [8]. The treatment of osteomyelitis is complicated, and infections always recur in patients with T2DM [9, 10]. Additionally, patients with both osteomyelitis and T2DM have an increased risk of mortality (HR 1.70, 95% CI 1.57-1.83)[11].
T2DM is characterized by dysfunction in insulin secretion and insulin resistance. Recent studies show that oxidative stress, glucose toxicity, lipid toxicity, mitochondrial dysfunction and endoplasmic reticulum stress all make contributions to the pathogenesis [12, 13]. The increasing prevalence of obesity contributes to the development of type 2 diabetes via abdominal adiposity, abnormal hormone secretion, silent inflammation, insulin secretory defects and insulin resistance [14]. Hyperlipidaemia is associated with changes in oxidative metabolism, which results in reduced capacity of mitochondrial oxidative phosphorylation, plasticity of mitochondria and ADP-stimulated oxidative phosphorylation [15]. All the mechanisms mentioned above are related to inflammation [16]. COM is a well-known chronic infectious disease and is expected to increase the risk of T2DM since inflammation is regarded as an important risk factor for T2DM. However, only a few studies have focused on the impact of COM in the development of T2DM [17].
Here, we retrospectively analysed a series of patients with osteomyelitis and explored the characteristics and risk factors of patients who developed T2DM.
Methods
Subjects
In this study, data from 107 patients with COM and 114 patients without COM were collected and retrospectively reviewed between January 2007 and December 2015. All enrolled COM patients were diagnosed according to clinical symptoms (such as exposed bone, tissue necrosis overlying bone and persistent sinus tract), laboratory studies (such as positive blood cultures, elevated c-reactive protein levels and erythrocyte sedimentation rate) and imaging studies demonstrating contiguous soft tissue infection or bony destruction [18]. Patients diagnosed with T2DM before osteomyelitis and lacking laboratory studies concerning blood glucose, C-peptide and glycosylated haemoglobin (HbA1c) were excluded. For control cases, those inpatients in orthopaedics who did not have chronic osteomyelitis and who were matched for age and gender with COM patients were included. Subjects with diabetes at diagnosis, chronic inflammatory disease, evidence of congestive heart failure, kidney diseases, or liver diseases were excluded. Patients who had no regular visits (less than two medical records after surgery between January 2007 and December 2015) to a hospital were also excluded.
Collection of clinical data
The time to develop T2DM was reviewed in the retrospective analysis. The data from the last specialist visit were collected, which consisted of demographics, duration of COM, body mass index (BMI), current smoking status, hypertension history, exercise history, the organisms identified from bone infections, site of infections, frequency of specialist visits, HbA1c, fasting blood glucose, fasting insulin, calculated HOMA-IR, total cholesterol, triglyceride, low density lipoprotein, white blood cells (WBC), erythrocyte sedimentation rate (ESR), C-reactive protein (CRP) and procalcitonin (PCT). Informed consent was obtained from each patient, and the privacy rights of patients were always observed. The study protocol of our research conformed to the ethical guidelines of the 1975 Declaration of Helsinki as reflected in approval by the local ethical committee.
Evaluation the expression of inflammatory factors
The serum levels of tumour necrosis factor α (TNF-α) and interleukin-6 (IL-6) of COM patients and mice were detected by an enzyme-linked immunosorbent assay (Wuhan USCN Business Co., Ltd.) according to the instructions of the manufacturer.
Assessment questionnaires
Four questionnaires were used to assess walking ability, quality of life and mental health. The Health Assessment Questionnaire (HAQ) walking subscale was used to assess self-reported walking difficulty with a score range from 0 (represented as no difficulty) to 3 (represented as severe difficulty). The Activity of Daily Living Scale (ADL) was used to assess the general quality of life. Total scores of less than 16 were defined as normal function, and total scores between 16 and 22 were defined as early loss of function. The Self-Rating Anxiety Scale (SAS) (total score between 50 and 60 was defined as mild anxiety, total score between 61 and 70 was defined as moderate anxiety, and total score more than 70 was defined as severe anxiety) and Short Form 36 Health Survey Questionnaire (SF-36) mental health subscale (a score greater than 60 was defined as normal, while a score less than 60 was defined as probable depression) were used to assess mental health status.
Murine osteomyelitis model
All animal studies were performed under protocols approved by the Animal Research Inspectorate. The surgical procedure was based on a previous report [19]. Ten-week-old female C57Bl/6 mice were included in the present study, and 20 animals comprised each group. After anaesthesia, a steel pin colonized with S. aureus was implanted transcortically through the metaphysis of the tibia. Animals that received only sterile pins were selected as the sham-operated group. Body weights and fasting blood glucose were measured every 7 days. Fifty-six days after surgery, the status of osteomyelitis was examined and confirmed by X-ray. An oral glucose tolerance test (OGTT) was used as previously described [20] to evaluate the glucose metabolism in animals with osteomyelitis. Serum was harvested at 56 days of modelling after fasting for 8 hours and tested for TNF-α and IL-6.
Mice behavioural assessment
The forced swimming test (FST), tail suspension test (TST) and open field test (OF) were used to assess depressive-like behaviours in mice with osteomyelitis. In FST, mice were placed into glass beakers filled with 40 cm of water and forced to swim for 5 min. Mice were defined as immobile when they ceased struggling and passively floated, with only slight movements to keep their head above the water. In TST, mice were suspended at a height of 50 cm with adhesive tape placed 2 cm from the tip of the tail. A 5-min test was used to observe the duration of immobility, which was defined as passive hanging and complete lack of motion. In OF, a square arena (30 cm×30 cm×30 cm) with clear Plexiglass walls and a white floor was used. Mice were placed in the centre of the arena for 15 min, and the exploration track was recorded by a camera. Data were analysed using a video-tracking system [21].
Statistical analyses
Data were presented as the mean ± standard deviation (SD) for continuous variables and percentages for dichotomous variables. All data were processed using SPSS (22.0, USA). The Kaplan-Meier analysis was used to establish the diabetes-free rate in patients with COM. Student's t test was used for continuous variables. The chi-square test or Fisher's exact test were used for dichotomous variables. To assess the differences in the diabetes-free rates between two cohorts, the Kaplan-Meier analysis and log-rank test were applied. The Cox proportional hazard model was used to assess the risk of developing T2DM associated with COM. Pearson analysis was used to assess correlations between glucose metabolic indicators and potential risk factors. Multivariate logistic regression analysis was performed to identify risk factors for the occurrence of T2DM. A p value of less than 0.05 was considered significant.
Results
Incidence of T2DM was increased in COM
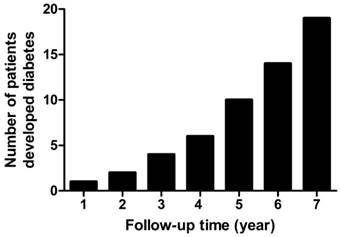
In the present retrospective study, a total of 107 patients with COM and 114 patients without COM were enrolled. There were no significant differences in age, gender, BMI, smoking and hypertension (Table 1) between these groups. Patients with COM had a significantly lower proportion of exercise (47.7% vs. 86.0%, p<0.001) and higher levels of fasting blood glucose (5.6±0.8 mmol/L vs. 5.2±0.5 mmol/L, p=0.007) and low-density lipoprotein (2.15±0.33 mmol/L vs. 2.02±0.27 mmol/L, p=0.001) than non-COM subjects. The median follow-up time was 4 years (range from 1 to 7 years). The diabetes-free rates decreased significantly in patients with COM compared with those without (Fig. 1). The overall incidence of T2DM was 2.37-fold greater in COM patients than in non-COM patients (hazard ratio=2.37, 95%CI=1.03-5.45). The proportion of subjects who were free of T2DM in the first, third and fifth years of follow-up were 99.0%, 95.4% and 84.5% in COM patients, respectively. The number of patients who developed T2DM increased rapidly after 4 years (Fig. 2). At the last retrospective follow up, a total of 19 COM patients developed T2DM, and the proportion of T2DM was 17.1%.
Characteristics of patients with and without chronic osteomyelitis
| Chronic osteomyelitis | P value | ||
|---|---|---|---|
| No | Yes | ||
| N | 114 | 107 | - |
| Age (year) | 44.6±5.8 | 44.8±2.9 | 0.887 |
| Gender (male, %) | 60.5 | 68.2 | 0.233 |
| BMI (kg/m2) | 24.9±3.0 | 24.5±2.5 | 0.298 |
| Any exercise (%) | 86.0 | 47.7 | <0.001** |
| Smoking (%) | 31.6 | 34.6 | 0.636 |
| Hypertension (%) | 30.7 | 28.0 | 0.664 |
| Fasting blood glucose (mmol/L) | 5.2±0.5 | 5.6±0.8 | 0.007** |
| Total cholesterol (mmol/L) | 4.06±0.56 | 4.14±0.36 | 0.242 |
| Triglyceride (mmol/L) | 1.25±0.20 | 1.27±0.21 | 0.324 |
| Low-Density Lipoprotein (mmol/L) | 2.02±0.27 | 2.15±0.33 | 0.001** |
| WBC (×109/L) | 7.07±1.72 | 11.95±2.2.5 | 0.009** |
| CRP (mg/L) | 6.3±2.7 | 23.1±5.4 | <0.001** |
BMI, body mass index. **, p<0.01
The Kaplan-Meier curves of the diabetes-free rates in patients with and without chronic osteomyelitis

The number of subjects who developed diabetes in chronic osteomyelitis
Clinical characteristics of COM patients enrolled
In the present study, data from 19 patients who developed T2DM after COM (DDM) and 88 COM patients without T2DM (Con) were collected. There were no differences in age, gender, duration of COM, the proportion of current smokers, the history of hypertension, the distribution of organisms in infected bone and site of infection between the DDM group and the Con group. Compared with the Con group, patients in the DDM group had higher BMI (24.1±2.1 kg/m2 vs. 26.6±3.0 kg/m2, p<0.001), less propensity to exercise (53.4% vs. 21.0%, p=0.010) and higher frequency of specialist visits (Table 2).
Characteristics of COM patients enrolled
| Con | DDM | P value | ||
|---|---|---|---|---|
| N | 88 | 19 | - | |
| Age (year) | 44.7±2.6 | 45.1±3.6 | 0.703 | |
| Gender (male, %) | 68.2 | 68.4 | 0.984 | |
| COM duration (year) | 5.8±2.1 | 6.1±1.9 | 0.702 | |
| BMI (kg/m2) | 24.1±2.1 | 26.6±3.0 | <0.001** | |
| BMI in categories (%) | <18 kg/m2 | 5.6 | 5.2 | <0.001** |
| 18-24 kg/m2 | 73.9 | 15.7 | ||
| 24-28 kg/m2 | 19.4 | 42.2 | ||
| >28 kg/m2 | 1.1 | 36.9 | ||
| Any exercise (%) | 53.4 | 21.0 | 0.010* | |
| Smoking (%) | 34.1 | 36.8 | 0.819 | |
| Hypertension (%) | 38.6 | 31.5 | 0.564 | |
| Organisms (%) | Staph. aureus | 48.9 | 52.6 | 0.976 |
| Staph. epidermidis | 26.1 | 26.3 | ||
| Enterococcus faecalis | 17.0 | 15.8 | ||
| Others | 8.0 | 5.3 | ||
| Site of infection (%) | Tibia | 42.1 | 52.6 | 0.636 |
| Femur | 30.7 | 21.1 | ||
| Toe | 27.2 | 26.3 | ||
| Specialist visits frequency (%) | Every three months | 30.6 | 68.4 | 0.014* |
| Every half year | 37.5 | 21.1 | ||
| Every year | 14.8 | 10.5 | ||
| Less than once a year | 17.1 | 0.0 | ||
COM, chronic osteomyelitis; Con, chronic osteomyelitis patients without diabetes; DDM, chronic osteomyelitis patients with diabetes; BMI, body mass index. *, p<0.05; **, p<0.01.
Metabolic indicators of enrolled patients
All patients enrolled had laboratory studies concerning glucose and lipid metabolism. Patients in the DDM group had higher HbA1c (6.4±0.6% vs. 5.2±0.4%, p<0.001), fasting blood glucose (7.1±0.8 mmol/L vs. 5.2±0.6 mmol/L, p<0.001), fasting insulin (10.5±2.4 µU/ml vs. 8.9±2.1 µU/ml, p<0.001) and calculated HOMA-IR (2.3±0.6 vs. 1.4±0.3, p<0.001) than those in the Con group. Furthermore, the serum levels of total cholesterol (4.38±0.35 mmol/L vs. 4.09±0.34 mmol/L, p=0.001) and low-density lipoprotein (2.34±0.35 mmol/L vs. 2.11±0.31 mmol/L, p=0.005) were higher in the DDM group than in the Con group (Table 3).
Glucose and lipid metabolism indicators of enrolled patients
| Con | DDM | P value | |
|---|---|---|---|
| N | 88 | 19 | - |
| HbA1c (%) | 5.2±0.4 | 6.4±0.6 | <0.001** |
| FBG (mmol/L) | 5.2±0.6 | 7.1±0.8 | <0.001** |
| Fasting insulin (µU/ml) | 8.9±2.1 | 10.5±2.4 | <0.001** |
| HOMA-IR | 1.4±0.3 | 2.3±0.6 | <0.001** |
| Total cholesterol (mmol/L) | 4.09±0.34 | 4.38±0.35 | 0.001** |
| Triglyceride (mmol/L) | 1.27±0.19 | 1.29±0.26 | 0.795 |
| LDL (mmol/L) | 2.11±0.31 | 2.34±0.35 | 0.005** |
Con, chronic osteomyelitis patients without diabetes; DDM, chronic osteomyelitis patients with diabetes; HbA1c, glycosylated haemoglobin; FBG, fasting blood glucose; LDL, low density lipoprotein. **, p<0.01.
Inflammatory indicators of enrolled patients
Both the Con group and the DDM group had elevated levels of serum inflammatory indicators. Compared with the Con group, patients with DDM had higher levels of WBC (12.9±2.1×10⁹/L vs. 11.7±2.2×10⁹/L, p=0.027), CRP (28.4±4.5 mg/L vs. 22.0±4.8 mg/L, p<0.001), TNF-α (13.5±5.0 pg/mL vs. 9.4±2.6 pg/mL, p= 0.003) and IL-6 (12.9±3.2 pg/mL vs. 9.2±2.7 pg/mL, p<0.001). There were no differences in the levels of ESR and PCT between the DDM group and the Con group (Table 4).
Inflammatory indicators of enrolled patients
| Con | DDM | P value | |
|---|---|---|---|
| N | 88 | 19 | |
| WBC (×109/L) | 11.7±2.2 | 12.9±2.1 | 0.027* |
| ESR (mm/h) | 51.9±3.7 | 52.0±4.2 | 0.961 |
| CRP (mg/L) | 22.0±4.8 | 28.4±4.5 | <0.001** |
| PCT (ng/mL) | 0.31±0.06 | 0.32±0.05 | 0.125 |
| TNF-α (pg/mL) | 9.4±2.6 | 13.5±5.0 | 0.003** |
| IL-6 (pg/mL) | 9.2±2.7 | 12.9±3.2 | <0.001** |
Con, chronic osteomyelitis patients without diabetes; DDM, chronic osteomyelitis patients with diabetes; WBC, white blood cells; ESR, erythrocyte sedimentation rate; CRP, C-reactive protein; PCT, procalcitonin; TNF-α, tumour necrosis factor α; IL-6, interleukin-6. *, p<0.05; **, p<0.01.
Questionnaire assessments
In the HAQ assessment, the percentages of patients scoring 0, 1, 2, and 3 were 14.7%, 11.4%, 64.8% and 9.1% in the Con group and 5.3%, 10.5%, 47.4% and 36.8% in the DDM group, respectively. Patients in the DDM group had a higher proportion of walking difficulty than those in the Con group. There was no difference in daily living activity between the DDM group and the Con group. The proportion of depression was significantly higher in the DDM group (63.2% vs. 35.2%, p=0.003). The percentage of patients with severe anxiety was also significantly higher in subjects with DDM than in patients in the Con group (31.6% vs. 9.1%, p=0.002) (Table 5).
Questionnaires assessment of enrolled patients
| Con | DDM | P value | ||
|---|---|---|---|---|
| N | 88 | 19 | ||
| HAQ assessment (%) | Score 0 | 14.7 | 5.3 | 0.015* |
| Score 1 | 11.4 | 10.5 | ||
| Score 2 | 64.8 | 47.4 | ||
| Score 3 | 9.1 | 36.8 | ||
| ADL assessment (%) | Normal function | 82.9 | 78.9 | 0.742 |
| Early loss function | 17.1 | 21.1 | ||
| SAS assessment (%) | Mild anxiety | 47.7 | 10.5 | 0.002** |
| Moderate anxiety | 43.2 | 57.9 | ||
| Severe anxiety | 9.1 | 31.6 | ||
| SF-36 assessment (%) | Normal | 64.8 | 36.8 | 0.003** |
| Probable depression | 35.2 | 63.2 | ||
Con, chronic osteomyelitis patients without diabetes; DDM, chronic osteomyelitis patients with diabetes; HAQ, Health Assessment Questionnaire walking subscale; ADL, Activity of Daily Living Scale; SAS, Self-Rating Anxiety Scale; SF-36, Short Form 36 Health Survey Questionnaire mental health subscale. *, p<0.05; **, p<0.01.
Risk factors for the incidence of T2DM in patients with COM
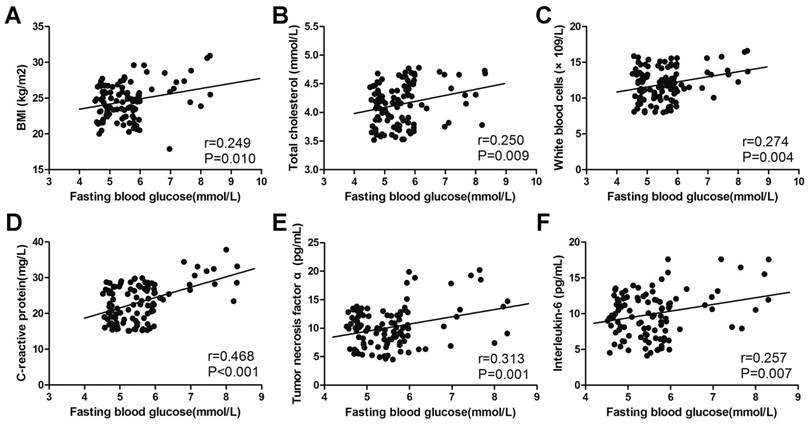
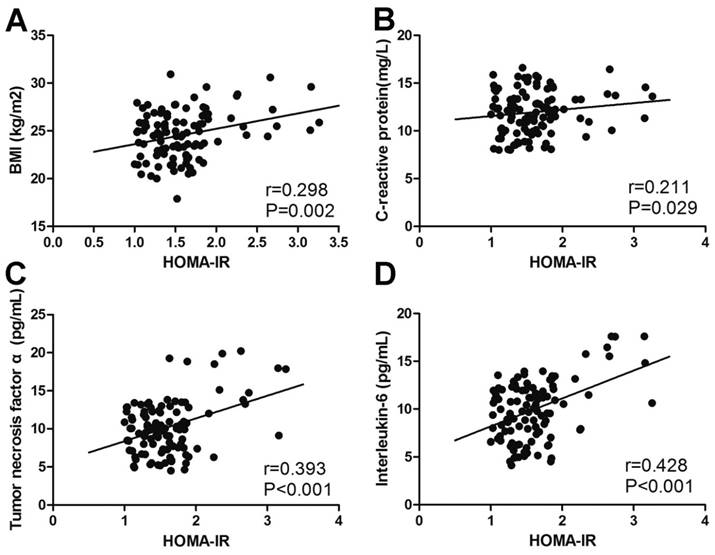
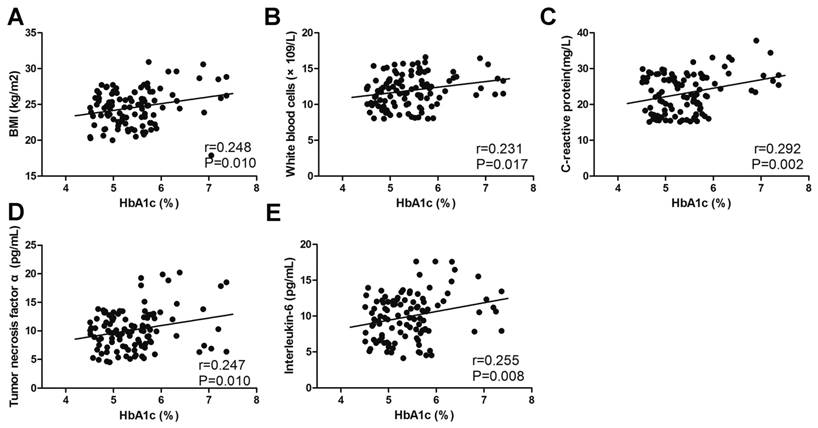
A Pearson analysis was performed to measure correlations between glucose metabolic indicators and potential risk factors. The level of fasting blood glucose positively correlated with BMI (r=0.249, p=0.010), total cholesterol (r=0.250, p=0.009), WBC (r=0.274, p=0.004), CRP (r=0.468, p<0.001), TNF-α (r=0.313, p=0.001) and IL-6 (r=0.257, p=0.007) (Fig. 3). A similar correlation could also be found in the level of HbA1c and HOMA-IR (Fig. 4, Fig. 5). The correlation between fasting blood glucose and potential risk factors has also been explored in patients without COM (Supplemental Table 1). The level of fasting blood glucose was positively correlated with triglyceride (r=0.154, p=0.022), WBC (r=0.210, p=0.002) and CRP (r=0.302, p<0.001). A multivariate logistic regression analysis was performed to identify risk factors for the occurrence of T2DM in COM patients. The level of BMI (OR=1.662, p<0.001), low density lipoprotein (OR=8.735, p=0.009), WBC (OR=1.299, p=0.032), CRP (OR=1.386, p<0.001), TNF-α (OR=1.435, p<0.001), IL-6 (OR=1.598, p<0.001), SAS assessment (OR=20.433, p<0.001), HAQ assessment (OR=5.754, p=0.002) and SF36 assessment (OR=18.255, p=0.001) were risk factors, and exercise (OR=0.121, p=0.002) was a protective factor for the development of T2DM in patients with COM (Table 6).
The correlation between fasting blood glucose and potential risk factors. The correlation between fasting blood glucose and BMI (A), total cholesterol (B), white blood cells (C), C-reactive protein (D), tumour necrosis factor α (E) and interleukin-6 (F).
The correlation between HOMA-IR and potential risk factors. The correlation between HOMA-IR and BMI (A), C-reactive protein (B), tumour necrosis factor α (C) and interleukin-6 (D).
The correlation between HbA1c and potential risk factors. The correlation between HbA1c and BMI (A), white blood cells (B), C-reactive protein (C), tumour necrosis factor α (D) and interleukin-6 (E).
Multivariate logistic analysis of the correlation between selected variables and the incidence of diabetes
| OR | 95% CI | P value | |
|---|---|---|---|
| Model 1 | |||
| BMI (kg/m2) | 1.662 | 1.254-2.202 | <0.001** |
| LDL (mmol/L) | 8.735 | 1.723-44.277 | 0.009** |
| WBC (×109/L) | 1.299 | 1.022-1.650 | 0.032* |
| CRP (mg/L) | 1.386 | 1.178-1.632 | <0.001** |
| TNF-α (pg/mL) | 1.435 | 1.201-1.714 | <0.001** |
| IL-6 (pg/mL) | 1.598 | 1.257-2.030 | <0.001** |
| Exercise (%) | 0.121 | 0.032-0.467 | 0.002** |
| SAS (%) | 20.433 | 4.358-95.812 | <0.001** |
| HAQ (%) | 5.754 | 1.916-17.283 | 0.002** |
| SF36 (%) | 18.255 | 3.506-95.052 | 0.001** |
| Model 2 | |||
| LDL (mmol/L) | 7.490 | 1.268-44.250 | 0.026* |
| WBC (×109/L) | 1.248 | 0.946-1.645 | 0.117 |
| CRP (mg/L) | 1.392 | 1.169-1.659 | <0.001** |
| TNF-α (pg/mL) | 1.413 | 1.163-1.716 | <0.001** |
| IL-6 (pg/mL) | 1.556 | 1.222-1.981 | <0.001** |
| Exercise (%) | 0.145 | 0.032-0.658 | 0.012* |
| SAS (%) | 16.523 | 3.351-81.460 | 0.001** |
| HAQ (%) | 4.386 | 1.435-13.407 | 0.010* |
| SF36 (%) | 26.559 | 3.399-207.545 | 0.002** |
| Model 3 | |||
| WBC (×109/L) | 1.324 | 0.979-1.790 | 0.068 |
| CRP (mg/L) | 1.459 | 1.189-1.789 | <0.001** |
| TNF-α (pg/mL) | 1.402 | 1.143-1.719 | 0.001** |
| IL-6 (pg/mL) | 1.720 | 1.269-2.333 | <0.001** |
| Exercise (%) | 0.162 | 0.034-0.760 | 0.021* |
| SAS (%) | 15.819 | 3.136-79.798 | 0.001** |
| HAQ (%) | 3.966 | 1.298-12.121 | 0.016* |
| SF36 (%) | 25.162 | 2.823-224.241 | 0.004** |
Model 1 adjusted for age, duration of chronic osteomyelitis and gender; Model 2 adjusted for age, duration of chronic osteomyelitis, gender and body mass index; Model 3 adjusted for age, duration of chronic osteomyelitis, gender, body mass index and low-density lipoprotein. BMI, body mass index; LDL, low density lipoprotein WBC, white blood cells; CRP, C-reactive protein; TNF-α, tumour necrosis factor α; IL-6, interleukin-6; SAS, Self-Rating Anxiety Scale; HAQ, Health Assessment Questionnaire walking subscale; SF-36, Short Form 36 Health Survey Questionnaire mental health subscale. *, p<0.05; **, p<0.01
Animal model of osteomyelitis
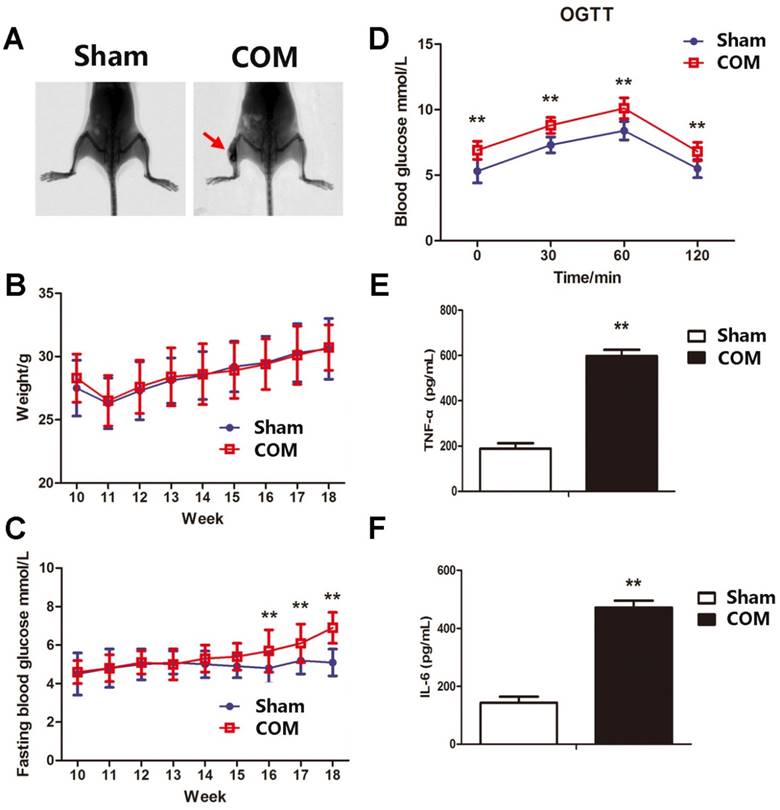
Since the sample size of DDM patients was small and may generate a great bias, a mouse model of osteomyelitis was established to verify the presence of hyperglycaemia in chronic osteomyelitis. The model of osteomyelitis was examined 56 days after surgery by X-ray. Periosteal reactions, destruction of bone, sequestrum and soft tissue swelling were obvious in osteomyelitis groups (Fig. 6A). There were no significant differences in body weights between the two groups. The fasting blood glucose and OGTT were significantly higher in osteomyelitis mice than in sham-operated mice (Fig. 6C and D). The levels of TNF-α and IL-6 were also significantly elevated in osteomyelitis mice (Fig. 6E and F), which was consistent with data in COM patients.
The metabolic and inflammatory indicators in the mouse model of osteomyelitis. A, representative X-ray images of the mouse model of osteomyelitis (COM) and sham-operated mice (Sham). B, body weight of mice in Sham and COM. C, the level of fasting blood glucose in mice in Sham and COM. **, p<0.01. D, oral glucose tolerance test in mice in Sham and COM. **, p<0.01. E, serum level of tumour necrosis factor α (TNF-α) in mice in Sham and COM. **, p<0.01. F, serum level of interleukin-6 (IL-6) in mice in Sham and COM. **, p<0.01.
Depression-like behaviours in osteomyelitis mice
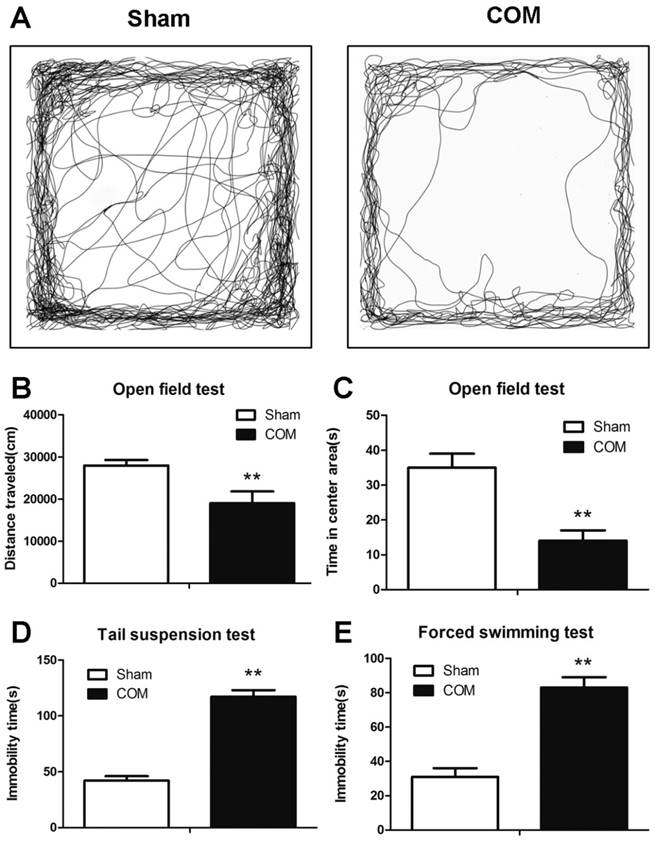
The depression-like behaviours (OF, FST and TST tests) were detected at 56 days after surgery. The time spent in the central area and the total distance travelled in the OF test were significantly decreased in osteomyelitis mice (Fig. 7 A-C). The immobility time in FST and TST were significantly increased in mice with osteomyelitis compared with sham-operated mice (Fig. 7 D and E).
The depression-like behaviours in the mouse model of osteomyelitis. A, representative types of travel strategies in the open field test of mice in Sham and COM. B, the travel distance of mice in Sham and COM. C, the time spent in the centre area of mice in Sham and COM. D, the immobility time in the tail suspension test of mice in Sham and COM. E, the immobility time in the forced swimming test of mice in Sham and COM. **, p<0.01.
Discussion
In the present retrospective study, the incidence of T2DM was 2.37-fold higher in patients with COM than in those without. The proportion of COM patients who were free of T2DM in the first, third and fifth years of follow-up were 99.0%, 95.4% and 84.5%, respectively. Patients in the DDM group had higher BMI, exercised less, and had more frequent specialist visits than those in the Con group. Considering the metabolic indicators, the DDM group had higher levels of HbA1c, fasting blood glucose, and fasting insulin and higher HOMA-IR. Although COM is a chronic inflammatory disease, the levels of pro-inflammatory factors were still significantly higher in DDM patients. In the mouse model of osteomyelitis, elevated levels of fasting blood glucose, TNF-α and IL-6 were observed, which was consistent with data from COM patients. Furthermore, patients with DDM also experienced worse mental health as assessed by different questionnaires, while more depression-like behaviours were also observed in osteomyelitis mice.
To date, only one study has focused on the incidence of T2DM in patients with COM. Lin et al. used the Taiwan National Health Insurance Database (NHIRD) and identified 20641 patients with COM and 82564 age- and sex-matched controls from 1997 to 2010 [22]. COM patients had 1.6-fold higher incidence of T2DM than control subjects, and a higher risk of T2DM still existed (adjusted HR=1.64) after adjustments for the baseline and co-morbidities in patients with COM. Additionally, subjects with younger age and higher incomes had greater incidence rates of T2DM than their counterparts. In the present study, the overall incidence of T2DM was 2.37-fold greater in COM patients than in non-COM patients, which was consistent with a previous study. Our study was the second study concerning the occurrence of T2DM in COM patients and had more details regarding metabolic indicators, pro-inflammatory factors and mental health.
Because exercise in the COM group is severely limited due to chronic pain and difficulties in participating in physical activities, a higher proportion of obesity is observed in COM patients. In the present study, 36.9% of patients were obese and 42.2% of patients were overweight in the DDM group. Excess weight, which is accompanied with chronic inflammation and insulin resistance, is a strong antecedent of T2DM [23].
Chronic inflammation is a common feature of T2DM, and levels of inflammatory biomarkers were related to the incidence of T2DM [24]. White adipose tissue is the main site for production of cytokines, such as TNF-α, IL-6, IL-1, IL-10, adiponectin, leptin and resistin [25]. Adipose tissue is not only the main source of inflammatory cytokines but also an important target in the inflammatory responses of T2DM, which makes a vicious circle to produce chronic inflammatory cytokines and dysfunction of adipose tissue [23]. Adiponectin is a cytokine that is derived from adipose cells and promotes the production of anti-inflammatory factors, such as the IL-1 receptor agonist IL-10, by monocytes while impairing the production of pro-inflammatory factors in macrophages [26, 27]. However, pro-inflammatory factors (such as IL-6 and TNF-α) inhibit mRNA expression and protein secretion of adiponectin in adipose tissue [28, 29], and decreased adiponectin levels are related to the incidence of T2DM [30]. In a recent meta-analysis, which included 19,709 participants and 4,480 cases, showed that increased expression of CRP and IL-6 was significantly correlated with higher incidence of T2DM [31]. In the present study, the levels of IL-6 and TNF-α were elevated in both COM patients and the osteomyelitis mouse model. TNF-α and IL-6 were risk factors for the development of T2DM in COM patients after adjusting for confounding variables.
Apart from chronic production of pro-inflammatory factors in a vicious cycle, cytokines can also directly affect glucose and lipid metabolism [32]. Insulin signalling is a vital pathway for maintaining glucose homeostasis and regulating glucose metabolism in insulin sensitive organs, such as muscle, liver and adipose tissues. Pro-inflammatory cytokines modulate glucose absorption by affecting the insulin signalling pathway [33]. TNF-α increases the release of fatty acids and thereby deteriorate insulin signalling pathway [34]. TNF-α inhibits transduction of insulin signals, which results in a decrease in insulin secretion [35, 36]. Additionally, TNF-α can increase lactate production and glucose uptake in myotubes, which activates the NF-κB pathway and results in the elevated expression of multiple effectors in muscle glycolytic metabolism [37]. IL-6 can suppress the expression of IRS-1 and Akt phosphorylation in HepG2 cells [38]. IL-6 released from skeletal muscle is involved in the regulation of exercise training-induced counteraction of changes in carbohydrate and lipid metabolism in the liver in response to a high-fat diet [39]. Glucose uptake in human skeletal muscle is increased when IL-6 combined with IL-6R, which is independent of the PKB/Akt pathway [40]. IL-6 suppresses feeding in the absence of neuronal IL-6-receptor (IL-6R) expression in hypothalamic or forebrain neurons of mice, and deletion of gp130 in the PVH attenuates the beneficial central IL-6 effects on metabolism [41]. In the present study, patients in the DDM group had higher levels of CRP, TNF-α and IL-6 and logistic analysis further demonstrated the significant role of inflammatory factors in the occurrence of T2DM.
Apart from inflammation, obesity and insulin resistance, mental health also correlated with T2DM. Since the treatment regimen of T2DM is complex, adherence to daily tasks is tightly correlated with treatment effectiveness. Mental health is an important influence factor in the adherence of patients, where mental health comorbidities are associated with high risk for short and long-term complications [42]. In type 1 diabetes patients, mental health comorbidities are always accompanied with poor adherence to complex diabetic treatment and poor glycaemic control, which increased the risk for cognitive decline, blindness, stroke, and amputations and decreased quality of life [43]. In the present study, patients with DDM had a higher proportion of anxiety and depression. In osteomyelitis mice, depression-like behaviours were significantly increased compared with the sham-operated group. Poor mental health is related to poor compliance to treatment. Additionally, those patients with anxiety tended to visit specialists at a high frequency, which may facilitate the detection of glucose metabolism dysfunctions.
The mechanism underlining how COM promotes T2DM is speculated as follows. First, COM patients' lack of physical activity increases the risks of metabolic syndrome, obesity, and subsequent T2DM. Second, elevated levels of pro-inflammatory factors (such as IL-6 and TNF-α) interrupted the insulin signalling pathway and contributed to pre-diabetes conditions [44]. Third, COM patients who had poor mental health (such as depression and anxiety) complied poorly with treatment. Patients with anxiety trended toward frequent medical visits, which increased the likelihood of T2DM detection.
In the present study, the baseline characteristics of patients in the two groups are similar, making our results comparable and accurate. Moreover, all patients enrolled had comprehensive tests on glucose metabolism, lipid metabolism and metal health. Third, dysfunction in glucose metabolism was also observed both in patients and the animal model, which made the correlation more explicit. However, the number of enrolled patients is relatively small, especially in the case group, which will be improved in our future investigations.
In conclusion, COM patients had higher risk for T2DM. In those patients who developed T2DM, higher BMI, higher HOMA-IR index, higher levels of inflammatory markers, lower rates of regular exercise and poorer mental health were observed. BMI, low-density lipoprotein, WBC, CRP, TNF-α, IL-6, SAS assessment, HAQ assessment and SF36 assessment were risk factors, and exercise was a protective factor for the development of T2DM in patients with COM.
Supplementary Material
Supplementary table 1.
Acknowledgements
This study was supported by the National Natural Science Foundation of China (81702175, 81572111), the Clinical Science and Technology Project Foundation of Jiangsu Province (BL2012002), the Scientific Research Project of Nanjing (201402007), the Natural Science Foundation of Jiangsu Province (BK20161385) and the Special Foundation of the Chinese Medical Doctor Association (2015COS0810).
Competing Interests
The authors have declared that no competing interest exists.
References
1. Huang CC, Tsai KT, Weng SF. et al. Chronic osteomyelitis increases long-term mortality risk in the elderly: a nationwide population-based cohort study. BMC Geriatr. 2016;16:72
2. Schmitt SK. Osteomyelitis. Infect Dis Clin North Am. 2017;31:325-38
3. Donath MY. Targeting inflammation in the treatment of type 2 diabetes: time to start. Nat Rev Drug Discov. 2014;13:465-76
4. Xu Y, Wang L, He J. et al. Prevalence and control of diabetes in Chinese adults. JAMA. 2013;310:948-59
5. Petrakis I, Kyriopoulos IJ, Ginis A. et al. Losing a foot versus losing a dollar; a systematic review of cost studies in diabetic foot complications. Expert Rev Pharmacoecon Outcomes Res. 2017;17:165-80
6. Butalia S, Palda VA, Sargeant RJ. et al. Does this patient with diabetes have osteomyelitis of the lower extremity? JAMA. 2008;299:806-13
7. Prompers L, Huijberts M, Apelqvist J. et al. High prevalence of ischaemia, infection and serious comorbidity in patients with diabetic foot disease in Europe. Baseline results from the Eurodiale study. Diabetologia. 2007;50:18-25
8. Nicolau DP, Stein GE. Therapeutic options for diabetic foot infections: a review with an emphasis on tissue penetration characteristics. J Am Podiatr Med Assoc. 2010;100:52-63
9. Tone A, Nguyen S, Devemy F. et al. Six-week versus twelve-week antibiotic therapy for nonsurgically treated diabetic foot osteomyelitis: a multicenter open-label controlled randomized study. Diabetes Care. 2015;38:302-7
10. Lazaro-Martinez JL, Aragon-Sanchez J, Garcia-Morales E. Antibiotics versus conservative surgery for treating diabetic foot osteomyelitis: a randomized comparative trial. Diabetes Care. 2014;37:789-95
11. Brennan MB, Hess TM, Bartle B. et al. Diabetic foot ulcer severity predicts mortality among veterans with type 2 diabetes. J Diabetes Complications. 2017;31:556-61
12. Janikiewicz J, Hanzelka K, Kozinski K. et al. Islet beta-cell failure in type 2 diabetes-Within the network of toxic lipids. Biochem Biophys Res Commun. 2015;460:491-6
13. Robertson RP, Harmon J, Tran PO. et al. Beta-cell glucose toxicity, lipotoxicity, and chronic oxidative stress in type 2 diabetes. Diabetes. 2004;53(Suppl 1):S119-24
14. Scheen AJ, Van Gaal LF. Combating the dual burden: therapeutic targeting of common pathways in obesity and type 2 diabetes. Lancet Diabetes Endocrinol. 2014;2:911-22
15. Szendroedi J, Phielix E, Roden M. The role of mitochondria in insulin resistance and type 2 diabetes mellitus. Nat Rev Endocrinol. 2011;8:92-103
16. Hotamisligil GS, Erbay E. Nutrient sensing and inflammation in metabolic diseases. Nat Rev Immunol. 2008;8:923-34
17. Jin J, Wang Y, Deng Z. Increased risk of diabetes in inflammatory orthopedics diseases. AME Med J. 2017:2
18. Hatzenbuehler J, Pulling TJ. Diagnosis and management of osteomyelitis. Am Fam Physician. 2011;84:1027-33
19. de Mesy Bentley KL, Trombetta R, Nishitani K. et al. Evidence of Staphylococcus Aureus Deformation, Proliferation, and Migration in Canaliculi of Live Cortical Bone in Murine Models of Osteomyelitis. J Bone Miner Res. 2017;32:985-90
20. Steenberg VR, Jensen SM, Pedersen J. et al. Acute disruption of glucagon secretion or action does not improve glucose tolerance in an insulin-deficient mouse model of diabetes. Diabetologia. 2016;59:363-70
21. Li XM, Meng J, Li LT. et al. Effect of ZBD-2 on chronic pain, depressive-like behaviors, and recovery of motor function following spinal cord injury in mice. Behav Brain Res. 2017;322:92-9
22. Lin SY, Lin CL, Tseng CH. et al. The association between chronic osteomyelitis and increased risk of diabetes mellitus: a population-based cohort study. Eur J Clin Microbiol Infect Dis. 2014;33:1647-52
23. Lontchi-Yimagou E, Sobngwi E, Matsha TE. et al. Diabetes mellitus and inflammation. Curr Diab Rep. 2013;13:435-44
24. Dihingia A, Kalita J, Manna P. Implication of a novel Gla-containing protein, Gas6 in the pathogenesis of insulin resistance, impaired glucose homeostasis, and inflammation: A review. Diabetes Res Clin Pract. 2017;128:74-82
25. Sonnett TE, Levien TL, Gates BJ. et al. Diabetes mellitus, inflammation, obesity: proposed treatment pathways for current and future therapies. Ann Pharmacother. 2010;44:701-11
26. Elfeky M, Kaede R, Okamatsu-Ogura Y. et al. Adiponectin Inhibits LPS-Induced HMGB1 Release through an AMP Kinase and Heme Oxygenase-1-Dependent Pathway in RAW 264 Macrophage Cells. Mediators Inflamm. 2016;2016:5701959
27. Lira FS, Rosa JC, Pimentel GD. et al. Both adiponectin and interleukin-10 inhibit LPS-induced activation of the NF-kappaB pathway in 3T3-L1 adipocytes. Cytokine. 2012;57:98-106
28. Brunetti L, Leone S, Orlando G. et al. Hypotensive effects of omentin-1 related to increased adiponectin and decreased interleukin-6 in intra-thoracic pericardial adipose tissue. Pharmacol Rep. 2014;66:991-5
29. Auerbach P, Nordby P, Bendtsen LQ. et al. Differential effects of endurance training and weight loss on plasma adiponectin multimers and adipose tissue macrophages in younger, moderately overweight men. Am J Physiol Regul Integr Comp Physiol. 2013;305:R490-8
30. Marques-Vidal P, Schmid R, Bochud M. et al. Adipocytokines, hepatic and inflammatory biomarkers and incidence of type 2 diabetes. the CoLaus study. PLoS One. 2012;7:e51768
31. Wang X, Bao W, Liu J. et al. Inflammatory markers and risk of type 2 diabetes: a systematic review and meta-analysis. Diabetes Care. 2013;36:166-75
32. Hotamisligil GS, Shargill NS, Spiegelman BM. Adipose expression of tumor necrosis factor-alpha: direct role in obesity-linked insulin resistance. Science. 1993;259:87-91
33. de Luca C, Olefsky JM. Inflammation and insulin resistance. FEBS Lett. 2008;582:97-105
34. Ruan H, Miles PD, Ladd CM. et al. Profiling gene transcription in vivo reveals adipose tissue as an immediate target of tumor necrosis factor-alpha: implications for insulin resistance. Diabetes. 2002;51:3176-88
35. Kong P, Zhang L, Guo Y. et al. Phillyrin, a natural lignan, attenuates tumor necrosis factor alpha-mediated insulin resistance and lipolytic acceleration in 3T3-L1 adipocytes. Planta Med. 2014;80:880-6
36. Wilkes JJ, Lloyd DJ, Gekakis N. Loss-of-function mutation in myostatin reduces tumor necrosis factor alpha production and protects liver against obesity-induced insulin resistance. Diabetes. 2009;58:1133-43
37. Remels AH, Gosker HR, Verhees KJ. et al. TNF-alpha-induced NF-kappaB activation stimulates skeletal muscle glycolytic metabolism through activation of HIF-1alpha. Endocrinology. 2015;156:1770-81
38. Boonloh K, Kukongviriyapan U, Pannangpetch P. et al. Rice bran protein hydrolysates prevented interleukin-6- and high glucose-induced insulin resistance in HepG2 cells. Food Funct. 2015;6:566-73
39. Knudsen JG, Joensen E, Bertholdt L. et al. Skeletal muscle IL-6 and regulation of liver metabolism during high-fat diet and exercise training. Physiol Rep. 2016:4
40. Saini A, Faulkner SH, Moir H. et al. Interleukin-6 in combination with the interleukin-6 receptor stimulates glucose uptake in resting human skeletal muscle independently of insulin action. Diabetes Obes Metab. 2014;16:931-6
41. Timper K, Denson JL, Steculorum SM. et al. IL-6 Improves Energy and Glucose Homeostasis in Obesity via Enhanced Central IL-6 trans-Signaling. Cell Rep. 2017;19:267-80
42. Hoban C, Sareen J, Henriksen CA. et al. Mental health issues associated with foot complications of diabetes mellitus. Foot Ankle Surg. 2015;21:49-55
43. Ducat L, Rubenstein A, Philipson LH. et al. A review of the mental health issues of diabetes conference. Diabetes Care. 2015;38:333-8
44. Hotamisligil GS. Inflammation and metabolic disorders. Nature. 2006;444:860-7
Author contact
![]() Corresponding authors: Dr. Guojing Sun and Dr. Hongbo Qian, Department of Orthopedics, Jinling Hospital, School of Medicine, Nanjing University, No. 305, Zhongshan East Road, Nanjing 210002, Jiangsu, China. E-mail: Dr. Guojing Sun, suginecom; Dr. Hongbo Qian, dg1535025nju.edu.cn
Corresponding authors: Dr. Guojing Sun and Dr. Hongbo Qian, Department of Orthopedics, Jinling Hospital, School of Medicine, Nanjing University, No. 305, Zhongshan East Road, Nanjing 210002, Jiangsu, China. E-mail: Dr. Guojing Sun, suginecom; Dr. Hongbo Qian, dg1535025nju.edu.cn