Impact Factor ISSN: 1449-2288
- Issue 12; 2026
- Issue 11; 2026
- Issue 10; 2026
- Issue 9; 2026
- Issue 8; 2026
- Volume 22; 2026
- Past Issues
- Advance Articles
- Editorial Board
- Cover Images
- Index & Coverage
- Cover Suggestion
- Special Issues
Introduction
Results
Discussion
Materials and Methods
Supplementary Material
Acknowledgements
References

 Global reach, higher impact
Int J Biol Sci 2017; 13(11):1420-1437. doi:10.7150/ijbs.20742 This issue Cite
Research Paper
Adhesion Regulating Molecule 1 Mediates HAP40 Overexpression-Induced Mitochondrial Defects
Zih-Ning Huang1, Her Min Chung1, Su-Chiung Fang2,3, Lu-Shiun Her1 ![]()
1. Department of Life Sciences, College of Bioscience and Biotechnology, National Cheng Kung University, Tainan 70101, Taiwan;
2. Biotechnology Center in Southern Taiwan, Academia Sinica, Tainan 741, Taiwan;
3. Agricultural Biotechnology Research Center, Academia Sinica, Taipei 115, Taiwan.
Received 2017-4-26; Accepted 2017-9-10; Published 2017-11-1
Abstract

Striatal neuron death in Huntington's disease is associated with abnormal mitochondrial dynamics and functions. However, the mechanisms for this mitochondrial dysregulation remain elusive. Increased accumulation of Huntingtin-associated protein 40 (HAP40) has been shown to be associated with Huntington's disease. However, the link between increased HAP40 and Huntington's disease remains largely unknown. Here we show that HAP40 overexpression causes mitochondrial dysfunction and reduces cell viability in the immortalized mouse striatal neurons. HAP40-associated mitochondrial dysfunction is associated with reduction of adhesion regulating molecule 1 (ADRM1) protein. Consistently, depletion of ADRM1 by shRNAs impaired mitochondrial functions and increased mitochondrial fragmentation in mouse striatal cells. Moreover, reducing ADRM1 levels enhanced activity of fission factor dynamin-related GTPase protein 1 (Drp1) via increased phosphorylation at serine 616 of Drp1 (Drp1Ser616). Restoring ADRM1 protein levels was able to reduce HAP40-induced ROS levels and mitochondrial fragmentation and improved mitochondrial functions and cell viability. Moreover, reducing Drp1 activity by Drp1 inhibitor, Mdivi-1, ameliorates both HAP40 overexpression- and ADRM1 depletion-induced mitochondrial dysfunction. Taken together, our studies suggest that HAP40-mediated reduction of ADRM1 alters the mitochondrial fission activity and results in mitochondrial fragmentation and mitochondrial dysfunction.
Keywords: Huntington's disease, mitochondrial dynamics, HAP40, ADRM1, Drp1.
Introduction
Mitochondria play key roles in cell survival by controlling energy metabolism, Ca2+ homeostasis, and apoptosis pathways. The defects in mitochondrial functions are the common pathological features shared by many neurodegenerative diseases. For example, impaired mitochondrial dynamics and interaction of dynamin-related protein 1 (Drp1, a mitochondrial fission factor) with amyloid beta have been found in neurons of patients with Alzheimer's disease [1]. In the case of Charcot-Marie-Tooth disease, mutation in the mitochondrial fusion factor, mitofusin 2 (Mfn2), induces axon degeneration that is correlated with disruption of mitochondrial positioning within axons [2, 3]. Mutation in another mitochondrial fusion factor optic atrophy 1 (OPA1) is associated with the autosomal dominant optic atrophy [2-4]. Therefore, mitochondrial functions are important to maintain neuronal health and functions.
Huntington's disease (HD) is an autosomal dominant neurodegenerative disorder characterized by severe motor and cognition dysfunction [5]. Defects in mitochondrial functions and onset of oxidative stresses are detected in brains of HD patients [6-8]. Additionally, a great number of studies have demonstrated that mitochondrial dysfunction lead to cell demise in both cell and animal models of HD [9]. The structure and function of the mitochondrial network is regulated by mitochondrial biogenesis, fission, fusion, transport and degradation. It has been shown that abnormal mitochondrial dynamics including fission, fusion, and mitochondrial permeability transition are associated in striatum and frontal cortex of HD patients [10]. In addition, interaction of mutant Htt with Drp1 increases the GTPase activity of Drp1 that subsequently results in abnormal mitochondrial dynamics, defective anterograde mitochondrial movement, and synaptic deficiencies [1, 10, 11]. These data infers that mitochondrial dysfunction is associated with the pathophysiology of HD. However, what specific aspects of mitochondrial functions are affected in HD and how HD-induced mitochondrial dysfunction is different from those associated with other neurodegenerative diseases remain largely unclear.
The onset of HD is linked to an expansion of the CAG repeats in interesting transcript 15 (IT15) gene that leads to an abnormally long poly glutamine (PolyQ) tract at the N-terminus of the encoded huntingtin (Htt) protein [12]. Huntingtin is a large ubiquitously 350-kDa protein that is expressed predominately in cytosol and associates with microtubules and various vesicles including endoplasmic reticulum, mitochondria and synaptic vesicles [13-17]. The polyQ stretch of mutant Htt has been shown to be important to interact with proteins involved in endocytosis, neuronal transport processes, and postsynaptic signaling [18]. Among these interacting proteins, HAP40 (Huntingtin Associated Protein of 40 kDa) is a 40-kDa cytosolic protein with unknown cellular function [19] whose levels are elevated in the mouse STHdhQ111/Q111 striatal cells and fibroblasts and brain tissue of HD patients [20]. The Huntingtin-HAP40 complex has been reported to modulate binding of Rab5, a small guanosine triphosphate hydrolase, to cytoskeletal fibers that subsequently affects early endosome motility [20, 21]. Despite these observations, the molecular mechanism connecting HAP40 and HD pathology remains largely unclear.
Impaired mitochondrial functions in STHdhQ111/Q111 mutant HD cells had been reported previously [22, 23]. However, the molecular mechanism leading to the HD-associated mitochondrial defects is unclear. Our previous studies have shown that overexpression of HAP40 impairs proteasome activity and increases accumulation of mutant Htt in the striatal HD model cells [24]. Interestingly, the level of ADRM1, an ubiquitin receptor, is reduced after HAP40 overexpression. Knowing that ADRM1 is involved in mitophagy [25], we hypothesized that HAP40-associated downregulation of ADRM1 may affect mitochondrial functions. In this study, we report that overexpression of HAP40 affects the mitochondrial dynamics, mitochondrial membrane potential, cellular ATP level, and intracellular ROS levels. In addition, HAP40-associated mitochondrial defects were associated with decreased expression of adhesion regulating molecule 1 (ADRM1). Interestingly, reduction of endogenous ADRM1 caused an increase of phosphorylated Drp1Ser616, the mitochondrial fission marker, and an accumulation of fragmented mitochondria. Moreover, depletion of ADRM1 reduced mitochondrial membrane potential and cellular ATP level, and increased intracellular ROS levels. On the other hand, overexpression of ADRM1 was able to reduce phosphorylated Drp1Ser616 and alleviate HAP40-induced mitochondrial dysfunction. Moreover, inhibition of Drp1 activity ameliorates HAP40 overexpression and ADRM1 depletion-induced mitochondrial dysfunctions. Therefore, our data presented here demonstrates that HAP40 affects mitochondrial dynamics and functions at least partly through decreasing ADRM1 protein and increasing Drp1-associated mitochondrial division processes.
Results
Overexpression of HAP40 impairs mitochondrial functions in an immortalized mouse striatal neuronal cell line
Mitochondria carry out many essential cellular functions including ATP synthesis, Ca++ homeostasis and ROS regulation. Accumulating evidence suggests that mitochondrial morphology and functions are regulated by cytoskeleton via mostly uncharacterized pathways [26-29]. HAP40 modulates the binding of Rab5, a small guanosine triphosphate hydrolase, to cytoskeletal fibers that subsequently affects early endosome motility [20, 21]. Therefore, we tested whether an increasing expression of HAP40 affected mitochondrial functions by monitoring mitochondrial membrane potential, ATP content, and reactive oxygen species (ROS) levels.
To examine the effect of HAP40 overexpression on mitochondrial membrane potential, the FLAG-HAP40 protein was overexpressed in STHdhQ7/Q7 striatal cells (Figure 1A). The mitochondrial membrane potential was tracked by staining with JC-1. JC-1 enters mitochondria in a potential-dependent manner and displays as red color by formation of red fluorescent J-aggregates (Figure S1A). As a control for depolarization, protonophore FCCP treatment depolarized the membrane potential and the vast majority of JC-1 was localized in cytoplasm as a green monomer (Figure S1B). As a result, red/green fluorescent intensity ratio was decreased significantly (from 1 to 0.43; p= 0.0069) (Figure S1C). We found that overexpression of FLAG-HAP40 caused a significant decrease in the red/green fluorescence intensity ratio (from 1 to 0.85; p= 0.038) (Figure 1B) in the immortalized mouse striatal STHdhQ7/Q7 cells, indicating that excess HAP40 disrupted the mitochondrial membrane potential.
Overexpression of HAP40 impairs mitochondrial functions. (A) Immunoblot detection of STHdhQ7/Q7 striatal cells transfected with FLAG or FLAG-HAP40 plasmids. (B) Quantification of JC-1 associated red/green fluorescent intensity ratio in STHdhQ7/Q7 striatal cells transfected with the indicated plasmids. Flow cytometric analysis of mitochondrial membrane potential by JC-1 staining in STHdhQ7/Q7 striatal cells in the presence of FLAG or FLAG-HAP40. (C) The ATP content measured 48 hrs after transfection with the indicated plasmids. The ATP content of cells expressing FLAG only was arbitrarily set to be 1. (D) The total cell number of the STHdhQ7/Q7 striatal cells transfected with the FLAG or FLAG-HAP40 plasmid measured by the MTT assay. Cell number was measured 48 hours after transfection. The percentage number of cells expressing FLAG only was arbitrarily set to be 100%. (E) The normalized ATP content of STHdhQ7/Q7 striatal cells transfected with the FLAG or FLAG-HAP40 plasmid. (F) Flow cytometric analysis of ROS in STHdhQ7/Q7 striatal cells in the presence of FLAG or FLAG-HAP40 plasmid. Quantification of percentage of the cells with positive ROS in STHdhQ7/Q7 striatal cells transfected with indicated plasmids. Data are from three independent experiments and presented as mean normalized units ± SEM. Data showing significant differences with P < 0.05 are labeled with one asterisk (*); with P < 0.01 are labeled with two asterisks (**).
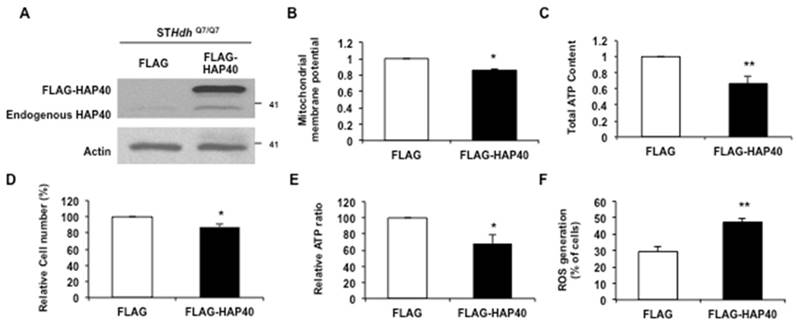
To test the effect of HAP40 overexpression on the mitochondrial-related energy metabolism, the intracellular ATP content was measured in the STHdhQ7/Q7 cells transfected with the FLAG or FLAG-HAP40 construct. As shown in Figure 1C, overexpression of the HAP40 resulted in a significant decrease in the overall ATP content (from 1 to 0.66; p=0.0062). However, overexpression of HAP40 also led to a decrease in total cell number (Figure 1D, from 100 to 87 %; p=0.024). To eliminate the effect of reduced cell number on ATP content, ATP level was normalized to cell number to reflect the ATP content on a per cell basis. As shown in Figure 1E, cellular ATP level was reduced by approximately 31% in cells overexpressing HAP40 (from 100 to 69 %; p= 0.033) (Figure 1E), supporting the effect of HAP40 on ATP homeostasis.
Defective mitochondrial functions are associated with an accumulation of ROS [30]. Therefore, we asked whether the HAP40-associated mitochondrial defects described above are also associated with increased intracellular ROS levels. The ROS levels were monitored in the STHdhQ7/Q7 cells overexpressing FLAG-HAP40 protein. Comparing to FLAG-expressing control cells, FLAG-HAP40 overexpressed cells greatly increased the percentage of cells with positive ROS signals (from 30 to 48%; p=0.0069) (Figure 1F). Taken together, our data demonstrated that overexpression of HAP40 led to a decrease in mitochondrial membrane potential and ATP level; and an increase in intracellular ROS level.
Overexpression of HAP40 leads to mitochondrial fragmentation
Mitochondrial network undergoes constant morphological changes that are directly relevant to their functional status and energy metabolism [31]. Keeping the appropriate ratio of mitochondrial morphology state is therefore essential for mitochondrial functions [32, 33]. It has been shown that decreased mitochondrial membrane potential and energetics is linked to fragmented mitochondria [34, 35], which subsequently induce an increase in ROS levels [36, 37]. Therefore, we tested whether overexpression of HAP40 also leads to alteration of mitochondrial morphology.
Mitochondria in tubular, intermediate, and fragmented shapes (Figure 2A-C) can be used as the readouts for normal and fragmental mitochondria when mitochondrial size, a common indicator for mitochondrial state, can not be readily measured due to its great number [23, 38, 39]. In wild-type STHdhQ7/Q7 cells, approximately 25% of total cells contained tubular mitochondria and approximately 13% of cells contained fragmented mitochondria (black bars in Figure S2). By comparison with the STHdhQ7/Q7 cells, there was a significant increase in the percentage of cells with fragmented mitochondria (from 13 to 31%; p=0.0069) with concurrent reduction of cells with tubular mitochondrial morphology in the STHdhQ111/Q111 cells expressing mutant Htt protein (from 25 to 13%; p=0.024) (Figure S2). Therefore, in line with the previous study [23], the percentage of fragmented mitochondria was increased in mutant HD striatal cells.
Overexpression of HAP40 leads to mitochondrial fragmentation. Images showing mitochondria in (A) tubular, (B) intermediate, (C) fragmented morphology in STHdhQ7/Q7 striatal cells transfected with mito-eGFP plasmids. (D) STHdhQ7/Q7 striatal cells were co-transfected with the mito-eGFP and the FLAG or FLAG-HAP40 plasmids. Quantification of percentage of the cells with different mitochondrial morphology in STHdhQ7/Q7 striatal cells transfected with the indicated plasmids. Primary cortical neurons were co-transfected with (E) mito-eGFP and mCherry plasmids, or (F) mito-eGFP and HAP40-mCherry plasmids. (G) Average length of mitochondria was quantified in primary cortical neurons with the mCherry or HAP40-mCherry construct. (H) Frequency distribution of mitochondrial length was quantified in primary cortical neurons transfected with the mCherry or HAP40-mCherry construct. Results from three independent experiments were subjected to statistical analysis. Data are represented as mean ± SEM. Data showing significant differences with P < 0.05 are labeled with one asterisk (*); with P < 0.01 are labeled with two asterisks (**); with P < 0.005 are labeled with three asterisks (***); N.S., no significance.
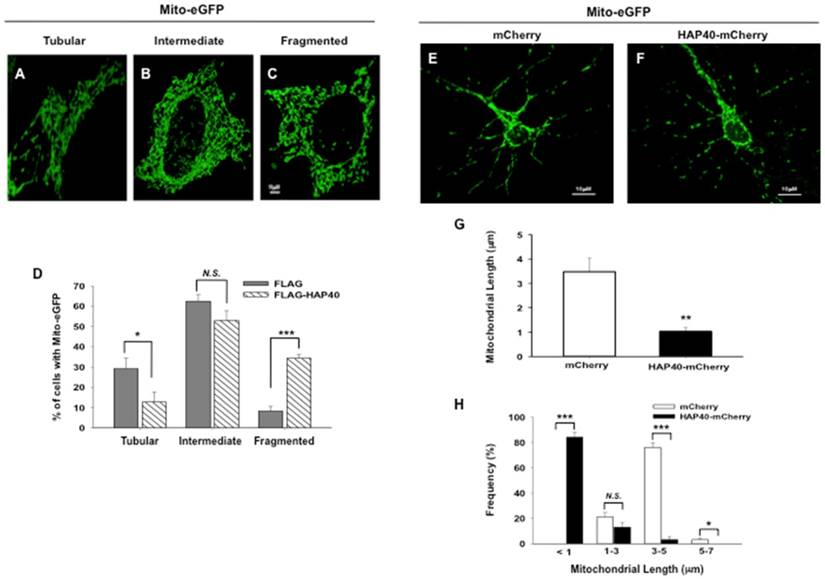
To test the effects of HAP40 overexpression on mitochondrial morphology, mitochondria were monitored in STHdhQ7/Q7 striatal cells co-transfected with either the FLAG or FLAG-HAP40 construct together with mito-eGFP plasmid. In STHdhQ7/Q7 striatal cells transfected with the FLAG construct, approximately 30% of total cells contained tubular mitochondria and approximately 8% of cells contained fragmented mitochondria. Comparing to the FLAG-expressing control cells, overexpression of FLAG-HAP40 greatly increased the percentage of cells with fragmented mitochondria (from 8 to 32%; p=0.0033) with concurrent reduction of cells with tubular mitochondrial morphology (from 30 to 13%; p=0.027) (Figure 2D).
The effect of HAP40 overexpression on mitochondrial morphology was also examined in primary mouse neurons. As opposed to striatal cells, mitochondria are sparsely distributed in neurites of primary neurons so that mitochondrial length was instead determined to reflect the state of mitochondrial morphology [40]. Comparing to mCherry-expressing control cells (Figure 2E), overexpression of HAP40 decreased the average length of mitochondria (from 3.4 μm to 1 μm; p= 0.0088) (Figure 2F and 2G). The percentage of mitochondrion with a length between 3-5 μm decreased from 76% in control cells to 3% in HAP40-mCherry-expressing cells (p= 0.0038) (Figure 2H). Concurrently, the percentage of mitochondrion with a length shorter than 1 μm increased from 1% in control cells to 84% in HAP40-mCherry-expressing cells (p= 0.0027) (Figure 2H). Taken together, our data indicate that overexpression of HAP40 results in an increase in the number of fragmented mitochondria in immortalized mouse striatal neuron cells and primary mouse neurons.
Overexpression of HAP40 increases the levels of total Drp1 protein and phosphorylated Drp1Ser616
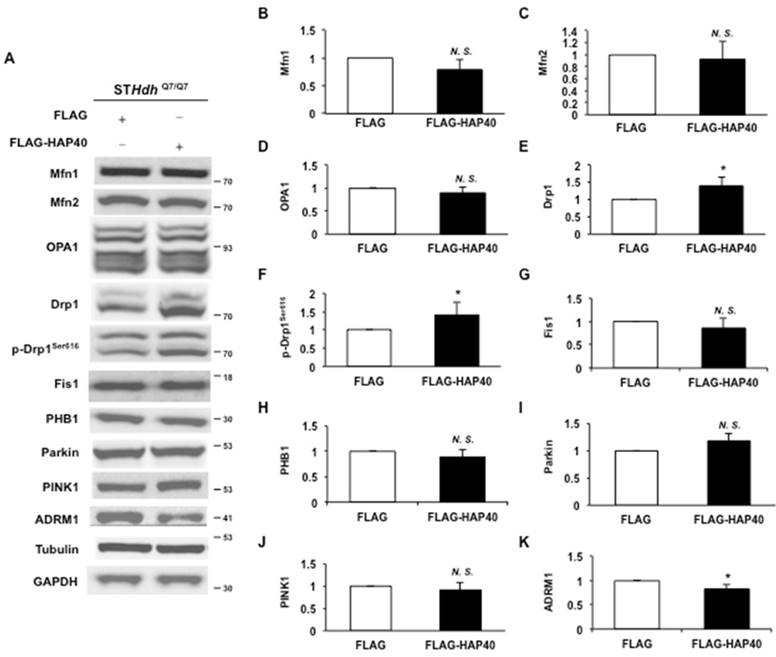
To dissect the specific effects of excess HAP40 on mitochondrial functions, we investigated whether regulatory proteins required for mitochondrial dynamics were affected by excess HAP40 expression in STHdhQ7/Q7 striatal cells. As shown in Figure 3A, overexpression of HAP40 did not affect the protein levels of mitochondrial fusion factors Mfn1, Mfn2 and OPA1 (Figure 3A). Protein quantification analysis also validated the results of Western blotting (p> 0.05) (Figure 3B-D). Therefore, overexpression of HAP40 does not affect the major components required for mitochondrial membrane fusion. However, the level of Drp1, a GTPase required for fission of mitochondrial outer membrane, was increased by approximately 38% when HAP40 was overexpressed (from 1 to 1.38; p=0.037) (Figure 3A, and 3E). Because Drp1-mediated fission activity is increased through phosphorylation of Drp1 at Ser616 [41-43], we then asked whether Drp1-mediated fission activity was also enhanced in the presence of excess HAP40 by examining Drp1Ser616 phosphorylation. Phosphorylated Drp1Ser616 was increased by approximately 41% when HAP40 was overexpressed (from 1 to 1.41; p=0.045) (Figure 3A, and 3F). On the other hand, neither the levels of Drp1 receptor mitochondrial fission 1 (Fis1) nor mitochondrial scaffold protein prohibitin-1 (PHB1) were affected in HAP40-overexpressing cells (p> 0.05) (Figure 3A, and 3G-H). The effect of HAP40 on mitochondrial fission seems to be Drp1 specific because proteins that have been found to facilitate fission such as Parkin (an ubiquitin E3 ligase) [44] and Parkin activator-PTEN-induced putative kinase 1 (PINK1) were not affected by overexpression of HAP40 (p> 0.05) (Figure 3A, and 3I-J).
Overexpression of HAP40 increases the level and phosphorylation state of Drp1. (A) Immunoblot detection for Mfn1, Mfn2, OPA1, Drp1, p-Drp1Ser616, Fis1, PHB1, Parkin, PINK1, ADRM1, GAPDH, and tubulin in STHdhQ7/Q7 striatal cells transfected with the FLAG or FLAG-HAP40 plasmid. (B-K) Quantification analyses on protein levels with the indicated protein normalized to the tubulin (B-H) or GAPDH (I-K). Data are from three independent experiments and presented as mean normalized units ± SEM. Data showing significant differences compared with the control (P < 0.05) are labeled with asterisk (*); N.S., no significance.
The positive correlation of HAP40 overexpression and phosphorylated Drp1Ser616 was also validated in the mouse neuroblastoma N2a cells overexpressing HAP40 (Figure S3A and S3F). In addition to the mouse cells, overexpression of HAP40 also caused increase in phosphorylated Drp1Ser616 levels in two human cell lines, HeLa and SK-N-SH cells (Figure S4A, S4D and S4E). Taken together, we conclude that overexpression of HAP40 facilitates mitochondrial fragmentation by enhancing phosphorylated Drp1Ser616-mediated membrane scission process.
Reduction of ADRM1 results in mitochondrial dysfunction
Previous report has shown that the proteasome ubiquitin receptor ADRM1 negatively regulates Parkin, implicating a potential role of ADRM1 in mitochondrial homeostasis [25]. However, the effects of ADRM1 on mitochondrial functions and morphology have not been characterized. Overexpressing HAP40 caused reduction of ADRM1 protein in STHdhQ7/Q7 striatal cells (from 1 to 0.82, p= 0.048) (Figure 3A and 3K). Similarly, overexpression of HAP40 led to reduction of ADRM1 protein in N2a, HeLa and SK-N-SH cell lines (Figure S3A, 3J, 4A, and 4H). As a result, we hypothesized that HAP40 affects mitochondrial functions and morphology through ADRM1 and investigated the requirement of ADRM1 on mitochondrial functions and morphology in STHdhQ7/Q7 striatal cells.
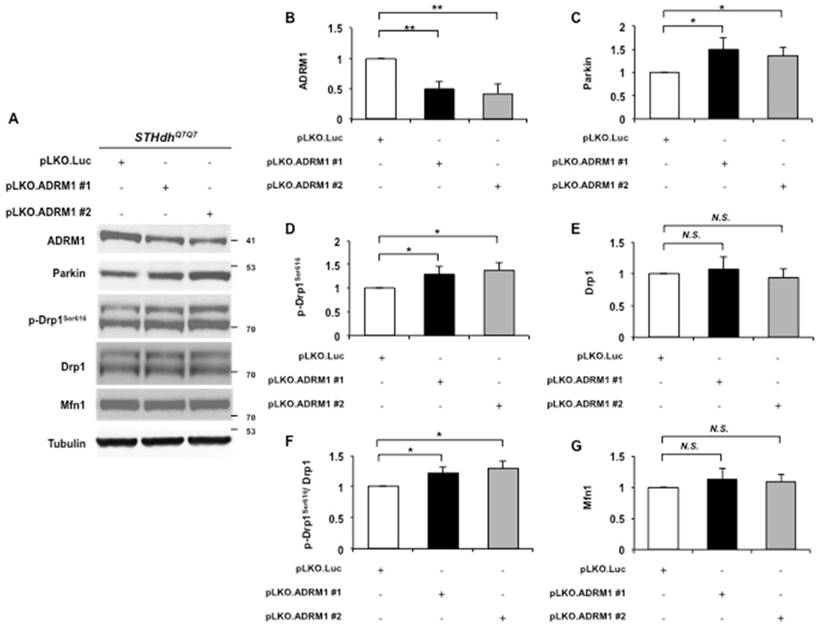
To test this, two shRNAs engineered to target two independent regions of the ADRM1 mRNA (pLKO.ADRM1 #1 and pLKO.ADRM1 #2) were generated and introduced into STHdhQ7/Q7 striatal cells. Two days after transfection, ADRM1 protein was reduced to approximately 50% in pLKO.ADRM1 #1 and pLKO.ADRM1 #2 transfected cells as compared to the pLKO.Luc. transfected control cells (0.49 and 0.41 folds; p= 0.0071 and 0.0082, respectively) (top panel in Figure 4A, and 4B). Consistent with the previous report [25], reducing ADRM1 increased the Parkin protein levels (from 1 to 1.5, and 1.35; p=0.036, and p=0.031, respectively) (Figure 4A, and 4C). In addition, reducing ADRM1 also increased levels of phosphorylated Drp1Ser616, a mitochondrial fission marker (from 1 to 1.29, and 1.38; p=0.048, and p=0.016, respectively) without affecting the levels of total Drp1 (Figure 4A, and 4D-F). Similar to HAP40 overexpressing cells, there was no detectable change on mitochondrial fusion factor Mfn1 protein in ADRM1 shRNA knockdown cells (Figure 4A and 4G). Taken together, our results provide evidence that ADRM1 regulates Parkin- and Drp1-dependent fission activity to regulate the mitochondrial functions.
Reducing ADRM1 increases the phosphorylation state of Drp1. (A) Immunoblot detection for ADRM1, Parkin, p-Drp1Ser616, Drp1, Mfn1, and tubulin in STHdhQ7/Q7 striatal cells transfected with the pLKO.ADRM1 #1, pLKO.ADRM1 #2, or pLKO.Luc. (B-E and G) Quantification analyses on protein levels with the indicated protein normalized to the tubulin. (F) Quantification analyses on phosphorylated Drp1Ser616 normalized to total Drp1 protein in STHdhQ7/Q7 striatal cells transfected with the indicated plasmids. Data are from three independent experiments and presented as mean normalized units ± SEM. Data showing significant differences with P < 0.05 are labeled with one asterisk (*); with P < 0.01 are labeled with two asterisks (**); N.S., no significance.
The effects of reduction of endogenous ADRM1 protein on mitochondrial membrane potential were monitored by the JC-1 stained ADRM1 shRNA knockdown cells. Reducing ADRM1 levels decreased the ratio of red/green fluorescence intensity in STHdhQ7/Q7 striatal cells depleting of ADRM1 (from 1 to 0.77; p=0.034, and from 1 to 0.85; p=0.032, respectively) (Figure 5A), indicating that ADRM1 is important to maintain mitochondrial membrane potential.
Depletion of ADRM1 impairs mitochondrial functions and leads to mitochondrial fragmentation. STHdhQ7/Q7 striatal cells were transfected with pLKO.ADRM1 #1, pLKO.ADRM1 #2, or pLKO.Luc shRNA construct. pLKO.Luc that targeted luciferase gene was used as a negative control. (A) Flow cytometric analysis of mitochondrial membrane potential by JC-1 staining in STHdhQ7/Q7 striatal cells depleted for ADRM1. Quantification of the JC-1 associated red/green fluorescent intensity ratio in STHdhQ7/Q7 striatal cells transfected with the indicated plasmids. The ratio of red to green JC-1 signals of cells expressing control pLKO.Luc. was arbitrarily set to be 1. (B) The ATP content of the STHdhQ7/Q7 striatal cells transfected the indicated plasmids. The ATP content of cells expressing control pLKO.Luc. was arbitrarily set to be 1. (C) The total cell number of the STHdhQ7/Q7 striatal cells transfected with the indicated plasmids were measured by the MTT assay. The percentage number of cells expressing pLKO.Luc only was arbitrarily set to be 100%. (D) The normalized ATP content of STHdhQ7/Q7 striatal cells transfected with the pLKO.ADRM1 #1, pLKO.ADRM1 #2, or pLKO.Luc plasmid. (E) Flow cytometric analysis of ROS accumulation in STHdhQ7/Q7 striatal cells depleted for ADRM1. Quantification of percentage of the cells with positive ROS in STHdhQ7/Q7 striatal cells transfected with indicated plasmids. (F) Quantification of percentage of the cells with different mitochondrial morphology in STHdhQ7/Q7 striatal cells transfected with indicated plasmids. Data are from three independent experiments and presented as mean normalized units ± SEM. Data showing significant differences with P < 0.05 are labeled with one asterisk (*); with P < 0.01 are labeled with two asterisks (**); N.S., no significance.
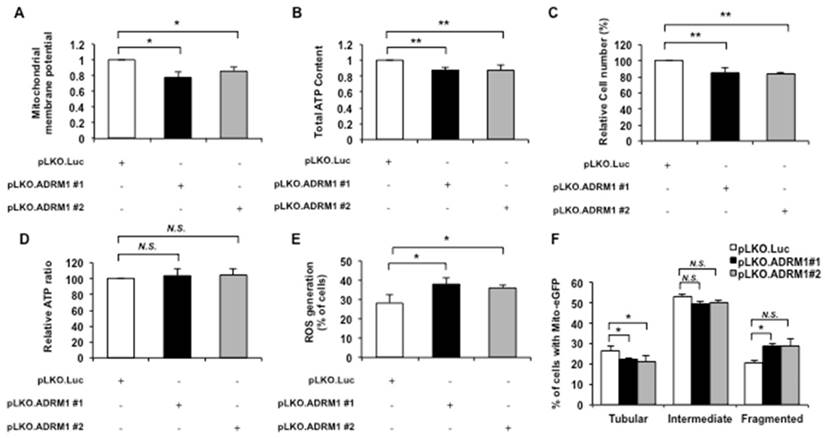
The mitochondrial energy metabolism represented by the intracellular ATP content was also examined in ADRM1 shRNA knock-down cells. Reducing ADRM1 protein caused a significant decrease in overall ATP levels in STHdhQ7/Q7 striatal cells (from 1 to 0.87, and 0.87; p=0.0061, and p=0.0069, respectively) (Figure 5B) and total cell number (from 100 to 85 %, and 83%; p=0.0066, and p=0.0053, respectively) (Figure 5C). After normalization to the cell number, however, the cell-based ATP levels were similar in control and ADRM1-reducing cells (p> 0.05) (Figure 5D). Therefore, reducing approximately 50% of ADRM1 has no effect on the ATP-related energy metabolism.
Cellular accumulation of ROS was also examined in cells depleted for ADRM1. By comparison with the pLKO.Luc. transfected control cells, pLKO.ADRM1 #1 and pLKO.ADRM1 #2 transfected cells greatly increased the percentage of cells with positive ROS signal (from 28 to 38%, and 36%; p=0.036, and p=0.042, respectively) (Figure 5E).
Since reducing ADRM1 protein led to increase in mitochondrial fission markers and mitochondrial dysfunction, the effect of ADRM1 on mitochondrial morphology was also examined. The mito-eGFP construct was co-transfected with pLKO.Luc control or ADRM1 knockdown shRNA plasmids in STHdhQ7/Q7 striatal cells. By comparison with pLKO.Luc transfected control cells, ADRM1 levels caused an increase in the percentage of cells with fragmented mitochondria (from 20 to 28%, and 28%; p=0.019, and p>0.05, respectively) and a concurrent decrease in cells with tubular mitochondria (from 27 to 21%, and 20%; p=0.039, and p=0.047, respectively) (Figure 5F). These data indicates that ADRM1 is required for maintaining the proper state of mitochondrial morphology. Taken together, we conclude that ADRM1 is important to maintain the mitochondrial membrane potential, ROS homeostasis and mitochondrial morphology.
Overexpression of ADRM1 rescues HAP40-induced mitochondrial dysfunction
Because ADRM1 is required to maintain normal mitochondrial functions and dynamics (Figure 5), we reasoned that the downregulation of ADRM1 in HAP40 overexpressing cells probably contributed to the mitochondrial dysfunction. If this is the case, increasing ADRM1 protein in cells overexpressing HAP40 would have restored mitochondrial functions. To test this, the ADRM1 (FLAG-ADRM1) protein was co-overexpressed with FLAG-HAP40 in STHdhQ7/Q7 striatal cells (Figure 6A). The effect of increasing ADRM1 expression on mitochondrial membrane potential was monitored by JC-1 staining. Overexpression of ADRM1 alone did not affect mitochondrial membrane potential (p > 0.05) (Figure 6B). However, overexpression of the ADRM1 improved mitochondrial membrane potential in STHdhQ7/Q7 striatal cells overexpressing HAP40 as indicated by the increased ratio of red/green fluorescence intensity (from 1 to 1.29; p = 0.02) (Figure 6C). These results indicate that an increased expression of ADRM1 relieves HAP40-induced depolarization of mitochondrial membrane potential.
Overexpression of ADRM1 restores mitochondrial functions and reduces HAP40-induced mitochondrial fragmentation. (A) Immunoblot detection for HAP40 and ADRM1 in STHdhQ7/Q7 striatal cells transfected with the FLAG or FLAG-HAP40 plasmid with or without the FLAG-ADRM1 plasmid. Tubulin was used as an internal control for protein loading. (B) Flow cytometric analysis of mitochondrial membrane potential by JC-1 staining in STHdhQ7/Q7 striatal cells in the presence of FLAG or FLAG-ADRM1 plasmids. Quantification of the JC-1 associated red/green fluorescent intensity ratio in STHdhQ7/Q7 striatal cells transfected with indicated plasmids. The ratio of red to green JC-1 signals of cells expressing FLAG only was arbitrarily set to be 1. (C) Flow cytometric analysis of mitochondrial membrane potential by JC-1 in STHdhQ7/Q7 striatal cells in the presence of FLAG-HAP40 and FLAG or FLAG-ADRM1 plasmids. Quantification of the JC-1 associated red/green fluorescent intensity ratio in STHdhQ7/Q7 striatal cells transfected with the FLAG-HAP40 and FLAG or FLAG-ADRM1 plasmids. The ratio of red to green JC-1 signals of cells co-expressing FLAG and FLAG-HAP40 was arbitrarily set to be 1. (D) The cellular ATP content of STHdhQ7/Q7 striatal cells transfected with the indicated plasmids. The ATP content was measured 48 hrs after transfection. The ATP content of cells co-expressing FLAG and HAP40-mCherry was arbitrarily set to be 1. (E) The total cell number of the STHdhQ7/Q7 striatal cells transfected with the indicated plasmids was measured by the MTT assay. Cell number was measured 48 hours after transfection. The percentage number of cells co-expressing FLAG and HAP40-mCherry was arbitrarily set to be 100%. (F) The normalized ATP content of STHdhQ7/Q7 striatal cells transfected with the indicated plasmids. (G) Flow cytometric analysis of ROS accumulation in STHdhQ7/Q7 striatal cells transfected with the indicated plasmids. Quantification of percentage of the cells with positive ROS in STHdhQ7/Q7 striatal cells transfected with indicated plasmids. (H) Quantification of percentage of the cells with different mitochondrial morphology in STHdhQ7/Q7 striatal cells co-transfected with the mito-eGFP and FLAG or FLAG-ADRM1 plasmids. (I) Quantification of percentage of the cells with different mitochondrial morphology in STHdhQ7/Q7 striatal cells co-transfected with the mito-eGFP and FLAG-HAP40 plasmids in the presence or absence of the FLAG or FLAG-ADRM1 plasmid. Data are from three independent experiments and presented as mean normalized units ± SEM. Data showing significant differences with P < 0.05 are labeled with one asterisk (*); N.S., no significance.
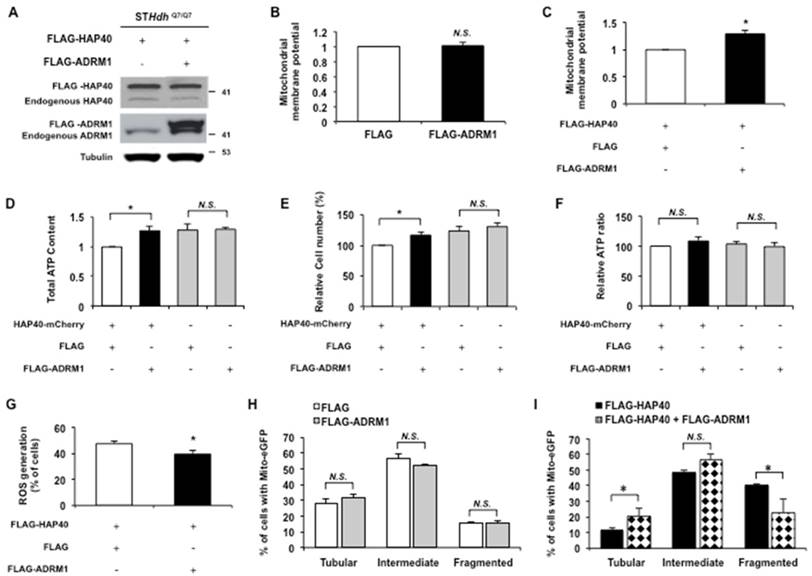
The effect of ADRM1 overexpression on intracellular ATP content was also monitored in cells overexpressing HAP40. Overexpression of the ADRM1 increased the total ATP content in STHdhQ7/Q7 striatal cells overexpressing HAP40 (from 1 to 1.27; p=0.047) (Figure 6D). In addition, overexpression of ADRM1 increased the cell proliferation as indicated by the total cell number (from 100 to 117 %; p=0.033) (Figure 6E). However, the cell number-normalized ATP levels were not affected significantly in cells overexpressing HAP40 and ADRM1 simultaneously (Figure 6F). The intracellular ATP level was not affected by overexpression of ADRM1 alone (p> 0.05) (Figure 6F).
The effect of increased ADRM1 protein expression on accumulation of ROS in HAP40 overexpressing striatal cells was also monitored. By comparison with the FLAG-expressing control cells, overexpression of FLAG-ADRM1 decreased the percentage of cells with ROS signal in HAP40 overexpressing cells (from 48 to 40%; p=0.019) (Figure 6G).
Next, we tested the ability of ADRM1 to relieve the HAP40-associated morphology defects. Overexpression of ADRM1 alone did not have any significant effect on overall mitochondrial morphology (p> 0.05) (Figure 6H). Comparing to cells overexpressing FLAG-HAP40 alone, simultaneous overexpression of FLAG-ADRM1 and FLAG-HAP40 significantly decreased the percentage of cells with fragmented mitochondria (from 40 to 23%; p=0.029) and increased the percentage of cells with tubular mitochondria (from 11 to 21%; p=0.034) (Figure 6I). Taken together, our data shows that overexpression of ADRM1 ameliorates HAP40-induced mitochondrial dysfunction by improving mitochondrial membrane potential, decreasing intracellular ROS levels, and reducing mitochondria fragmentation. However, overexpression of ADRM1 has no effects on HAP40-induced imbalance of the intracellular ATP.
ADRM1 overexpression decreases the levels of phosphorylated Drp1Ser616 in HAP40-expressing cells
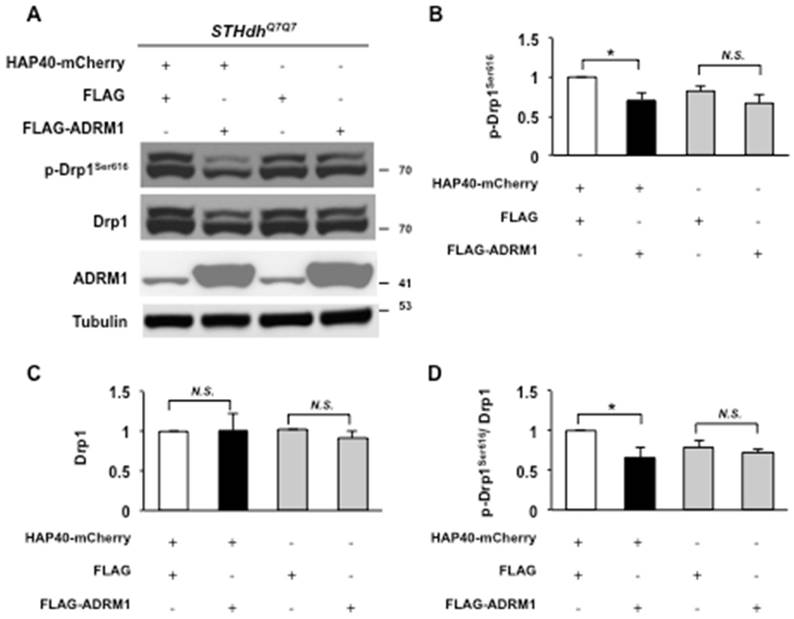
We were interested in understanding whether ADRM1 improved HAP40-induced mitochondrial defects by adjusting fission activity through Drp1-dependent pathway. The levels of Drp1 proteins were monitored in STHdhQ7/Q7 striatal cells overexpressing ADRM1 in the presence or absence of excess HAP40. In HAP40 overexpressing cells, overexpression of ADRM1 caused a decrease in level of phosphorylated Drp1Ser616 but had no significant effect on total Drp1 protein levels (from 1 to 0.7, and 1; p =0.041, and p>0.05, respectively) (Figure 7A, and 7B-D). This indicates that restoring ADRM1 in HAP40 overexpressing cells was able to reduce phosphorylated Drp1Ser616 and alleviate mitochondrial defects. Overexpression of ADRM1 alone had no effect on the total Drp1 protein levels or its phosphorylated form (p > 0.05) (Figure 7A, and 7B-C). Taken together, our results show that ADRM1 regulates Drp1-dependent mitochondrial fission activity to alleviate HAP40-induced mitochondrial fragmentation.
Overexpression of ADRM1 reduces the level of phosphorylated Drp1Ser616 in HAP40-expressing cells. (A) Immunoblot detection for p-Drp1Ser616, Drp1, ADRM1, and tubulin in STHdhQ7/Q7 striatal cells co-transfected with the HAP40-mCherry with FLAG or FLAG-ADRM1 plasmid and FLAG or FLAG-ADRM1 plasmid alone. (B-C) Quantification analyses on the indicated protein normalized to the tubulin. (D) Quantification analyses on phosphorylated Drp1Ser616 normalized to total Drp1 protein in STHdhQ7/Q7 striatal cells co-transfected with the indicated plasmids. Data are from three independent experiments and presented as mean normalized units ± SEM. Data showing significant differences compared to the control (P < 0.05) are labeled with asterisk (*); N.S., no significance.
Inhibition of Drp1 alleviates HAP40 overexpression-induced mitochondrial dysfunction
To test the causal effect of Drp1 on HAP40-associated mitochondrial defects, Mdivi-1, a specific Drp1 inhibitor that has been show to inhibit mitochondrial fission [39, 45, 46], was used to inhibit Drp1 activity in HAP40 overexpressing STHdhQ7/Q7 striatal cells. If Drp1 plays a major role in causing mitochondrial defects in HAP40 overexpressing cells, it is predicted that reducing Drp1 activity would alleviate the mitochondrial defects. Indeed, adding 50 μM but not 25 μM of Mdivi-1 to cells overexpressing HAP40 caused a significant decrease in the percentage of cells with fragmented mitochondria (from 34 to 18%; p=0.032) and increased the percentage of cells with tubular mitochondria (from 14 to 30%; p=0.037) comparing to non-treated cells (Figure 8A). Therefore, Mdivi-1 treatment is able to reverse HAP40-induced mitochondrial morphology defects.
Inhibition of Drp1 alleviates HAP40 overexpression-induced mitochondrial dysfunction. (A) Quantification of percentage of cells with different mitochondrial morphology in STHdhQ7/Q7 striatal cells co-transfected with the mito-eGFP and FLAG-HAP40 plasmids in the presence or absence of Mdivi-1 treatment. (B) Quantification of JC-1 associated red/green fluorescent intensity ratio in STHdhQ7/Q7 striatal cells transfected with FLAG or FLAG-HAP40 plasmids with or without Mdivi-1. (C) Flow cytometric analysis of ROS levels in STHdhQ7/Q7 striatal cells transfected with the FLAG or FLAG-HAP40 plasmid in the presence or absence of Mdivi-1 treatment. Quantification of percentage of the cells with positive ROS in STHdhQ7/Q7 striatal cells transfected with the indicated plasmids. Data are from three independent experiments and presented as mean normalized units ± SEM. Data showing significant differences with P < 0.05 are labeled with one asterisk (*); with P < 0.01 are labeled with two asterisks (**); N.S., no significance.
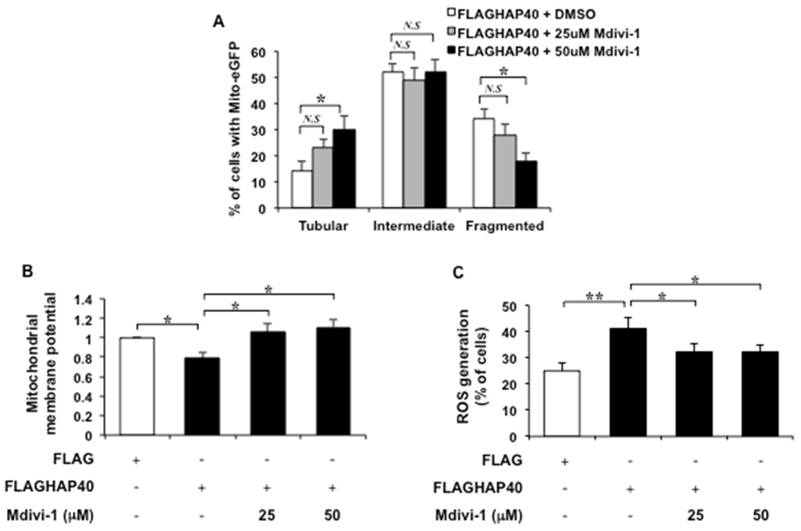
Next, we investigated whether Mdivi-1 treatment could restore mitochondrial functions in cells overexpressing HAP40. The effect of Mdivi-1 on mitochondrial membrane potential was monitored by JC-1 staining. As expected, overexpression of HAP40 resulted in reduction of the mitochondrial membrane potential (from 1 to 0.79; p=0.029) (Figure 8B). Fifty μM of Mdivi-1 treatment, on the other hand, resulted in significant increase in mitochondrial membrane potential as indicated by the increased ratio of red/green fluorescence intensity (from 0.79 to 1.11; p=0.035) (Figure 8B). Twenty-five μM of Mdivi-1 treatment also increased mitochondrial membrane potential but with less extent (from 0.79 to 1.06; p=0.042) (Figure 8B). These results support that Mdivi-1 mediated reduction of Drp1 activity is able to relieve HAP40-induced depolarization of mitochondrial membrane potential.
The effect of Mdivi-1 on accumulation of ROS in HAP40 overexpressing striatal cells was also monitored. As expected, HAP40 overexpression led to accumulation of ROS level (from 25 to 42%; p=0.0089). Mdivi-1 treatment, on the other hand, caused decrease in the percentage of cells with ROS signal in HAP40 overexpressing cells (from 42 to 32%, and 32%; p=0.047, and p=0.041, respectively) (Figure 8C).
Taken together, our data provides compelling evidence that Drp1 plays an important role in HAP40-induced mitochondrial dysfunctions and reducing Drp1 activity is able to restore mitochondria functions by reducing mitochondria fragmentation, improving mitochondrial membrane potential, and decreasing intracellular ROS levels.
Mdivi-1 treatment relieves mitochondrial dysfunction caused by down-regulation of ADRM1
Similar to cells overexpressing HAP40, reduction of endogenous ADRM1 also caused an increase in both phosphorylated Drp1Ser616 level and mitochondrial fragmentation. Because Mdivi-1 treatment could ameliorate HAP40-induced mitochondrial dysfunction, we were interested in testing the ability of Mdivi-1 to restore ADRM1 depletion-induced mitochondrial dysfunctions.
The effect of Mdivi-1 on ADRM1 reduction-associated mitochondrial morphology defects in STHdhQ7/Q7 striatal cells was also monitored. Comparing to control cells depleted for ADRM1 in the absence of Mdivi-1 treatment, 50 μM but not 25 μM of Mdivi-1 treatment caused significant decrease in percentage of ADRM1-depleting STHdhQ7/Q7 cells with fragmented mitochondria (from 31 to 20%; p=0.042, and from 32 to 20%; p=0.038, respectively) and increased the percentage of cells with tubular mitochondria (from 19 to 28%; p=0.039, and from 20 to 30%; p=0.043, respectively) (Figure 9A and 9B). Thus, Mdivi-1 treatment is able to restore ADRM1 depletion-induced mitochondrial morphology defects.
Mdivi-1 treatment relieves mitochondrial dysfunction caused by down-regulation of ADRM1. Quantification of percentage of the cells with different mitochondrial morphology in STHdhQ7/Q7 striatal cells co-transfected with the mito-eGFP and pLKO.ADRM1 #1 (A) or pLKO.ADRM1 #2 (B) shRNA construct in the presence or absence of the Mdivi-1 treatment. (C) Quantification of JC-1 associated red/green fluorescent intensity ratio in STHdhQ7/Q7 striatal cells transfected with pLKO.ADRM1 #1, pLKO.ADRM1 #2, or pLKO.Luc shRNA construct with or without Mdivi-1. (D) Flow cytometric analysis of ROS accumulation in STHdhQ7/Q7 striatal cells depleted for ADRM1 with or without Mdivi-1. Quantification of percentage of the cells with positive ROS in STHdhQ7/Q7 striatal cells transfected with indicated plasmids. Data are from three independent experiments and presented as mean normalized units ± SEM. Data showing significant differences with P < 0.05 are labeled with one asterisk (*); N.S., no significance.
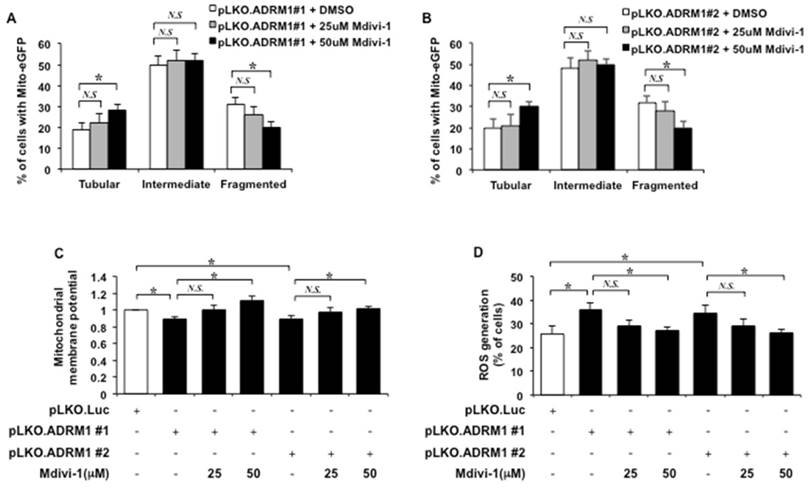
Next, we investigated whether Mdivi-1 treatment could restore mitochondrial functions in cells depleted for ADRM1. As expected, reduction of ADRM1 caused reduction of the mitochondrial membrane potential (from 1 to 0.88, and 0.89; p=0.042, and p=0.046, respectively) (Figure 9C). Adding 50 μM, but not 25 μM, of Mdivi-1 resulted in significant increase of mitochondrial membrane potential as indicated by the increased ratio of red/green fluorescence intensity (from 0.88 to 1.11; p=0.039, and from 0.89 to 1.01; p=0.048, respectively) (Figure 9C). These results supports that Mdivi-1 mediated reduction of Drp1 is able to alleviate HAP40-induced depolarization of mitochondrial membrane potential.
The effect of Mdivi-1 treatment on accumulation of ROS in ADRM1 depleting striatal cells was also monitored. Consistently, depletion of endogenous ADRM1 caused an increase of ROS level (from 25 to 36%, and 35%; p=0.040, and p=0.046, respectively) (Figure 9D). Inhibition of Drp1 by 50 μM Mdivi-1, however, led to reduction in the percentage of cells with ROS signal in HAP40 overexpressing cells depleting of ADRM1 protein (from 36 to 27%; p=0.038, and from 35 to 26%; p=0.046, respectively) (Figure 9D). Taken together, our results strongly support that Drp1 plays an important role in connecting signals from excess HAP40/ reduced ADRM1 to mitochondrial functions.
Discussion
HAP40 is a novel protein whose level is associated with HD patients and HD model systems [20]. Our previous study has shown that overexpression of HAP40 is able to aggravate accumulation of mutant Htt aggregates [24]. Here, we report that overexpression of HAP40 results in mitochondrial fragmentation and causes defective mitochondrial functions. Mitochondrial fragmentation is usually caused by hyperactive fission or impaired fusion. Phosphorylation of the Drp1 at Serine 616 residue by the mitotic cyclin-dependent protein kinase has been found to facilitate its translocation to the fission sites and regulates constriction and severance of mitochondrial membranes in a GTP hydrolysis-dependent mechanism during mitochondrial fission processes [42, 47-50]. Importantly, overexpression of HAP40 leads to increase in phosphorylated Drp1Ser616 protein levels in two human and two mouse cell lines (Figure 3F, Figure S3F, S4D and S4E), suggesting Drp1 is the key target of HAP40-associated mitochondrial defects. This notion is further supported by two lines of evidence. 1) Overexpression of ADRM1 is able to reduce phosphorylated Drp1Ser616 protein level and relieves HAP40 overexpression-induced mitochondrial defects (Figure 6 and 7), and 2) reducing Drp1 activity through Mdivi-1 treatment is sufficient to alleviate multiple mitochondrial defects in striatal cells overexpressing HAP40 (Figure 8). Moreover, reducing Drp1 activity is equally sufficient to alleviate multiple mitochondrial defects caused by reduction of ADRM1 (Figure 9), which is negatively regulated by HAP40 [24]. Taken together, our results provide compelling evidence to elucidate the HAP40-ADRM1-Drp1 pathway in regulating mitochondrial functions.
How does increasing HAP40 protein/ decreasing ADRM1 protein trigger phosphorylation of Drp1 and subsequent Drp1-associated fission activity? Increased ROS levels in both cases seem to provide a potential link. It has been shown previously that elevated ROS accumulation causes mitochondrial fragmentation and dysfunction [51-55]. Also, ROS production stimulates the Drp1 activity and enhances mitochondrial translocation of Drp1, providing a mechanism for ROS-induced mitochondrial fragmentation [56, 57]. Therefore, we hypothesize that increasing HAP40 protein levels causes decrease in ADRM1, which led to increase in ROS and potentially subsequent Drp1-related mitochondrial defects. The detailed mechanism still remains to be determined.
Increased ROS has been reported to activate MAP kinase pathway, including ERK, JNK and p38 kinases [57]. It is therefore possible that the increasing oxidative stress activates the MAP kinase cascade that subsequently leads to Drp1 phosphorylation and hyperactive fission-associated mitochondrial fragmentation. Drp1 phosphorylation by PKC delta has been shown to be associated with mitochondrial translocation of Drp1 under oxidative stress [57]. Alternatively, it is possible that PKC delta acts downstream of HAP40 to trigger Drp1-dependent hyperactive fission processes. Recently, the nitric oxide (NO)-induced kinase(s) has(ve) been postulated to phosphorylate Drp1 and subsequently regulate mitochondrial fission [58]. It is not yet clear whether NO plays a role in HAP40-mediated mitochondrial dysfunction and whether the same kinase is involved in NO-induced and HAP40-associated Drp1 phosphorylation. It will be of future interest to test these possibilities.
How does an increase in ADRM1 levels overcome the mitochondrial defects caused by excess HAP40? ADRM1 is an ubiquitin receptor that recruits and activates UCHL5, a de-ubiquitinating enzyme, to initiate the degradation of ubiquitinated substrates [59, 60]. ADRM1 has been shown to recruit Parkin protein to the 26S proteasome and facilitates clearance of mitochondrial proteins [37]. As the result, overexpression of ADRM1 not only reduces Parkin protein (Figure S5), but also alleviates its associated defects with mitochondrial dynamics and functions that may explain its ability to mitigate the HAP40 associated mitochondrial defects. Interestingly unlike HAP40, overexpression, downregulation of ADRM1 did not affect Drp1 protein levels, indicating that the ADRM1-dependent pathway is probably one of pathways controlled by HAP40 to regulate Drp1-mediated fission process. For the ADRM1-dependent pathway, we speculate that ADRM1 may negatively regulate the unidentified kinase(s) important for Drp1 phosphorylation by recruiting such unidentified kinase(s) to the 26S proteasome. Decrease in ADRM1 level may increase the level of such kinase(s) and therefore enhance Drp1 activity and subsequent mitochondrial fission. Further experiments will be required to address these possibilities.
What is the underlying mechanism that attributes to the HAP40-associated mitochondrial dysfunction? Based on our results, we propose a working model. Elevation of HAP40 protein induces mitochondrial dysfunction by interfering with the ADRM1-dependent pathway. Reducing ADRM1 level causes an increase in Drp1-assciated mitochondrial membrane fission (as indicated by the increase in phosphorylated Drp1Ser616) that subsequently alters the mitochondrial dynamics and functions. Does excess HAP40 act sorely through ADRM1 to cause mitochondrial defects? It is probably unlikely because decreasing ADRM1 alone did not completely recapitulate the effects caused by overexpression of HAP40 as cellular ATP content was not affected in ADRM1 knockdown cells. In addition, unlike downregulation of ADRM1, overexpression of HAP40 did not affect Parkin levels (Figure 3). Similarly, HAP40-induced fragmented mitochondria did not trigger Parkin-related mitophagy, which would have occurred when ADRM1 is reduced [61] (Figure S6). Therefore, HAP40 does not seem to reduce ADRM1 levels in a simple and liner fashion. How does HAP40 affect ADRM1 in the HD and neuron degeneration context remains to be determined.
How does onset of HD affect HAP40 at the molecular level and what is the pathological consequence of such misregulation? Unfortunately, the published transcriptomic and proteomic analyses fail to reveal any insight into a potential mechanism [62-65]. It is possible that misregulation of HAP40 occurs at the cell- or tissue-manner that is difficult to be detected in these experimental setups. Further studies will be required to address these questions.
In conclusion, our work demonstrated that an increase in HAP40 protein is sufficient to cause mitochondrial defects. In addition, our studies identified ADRM1 as the downstream effector of HAP40 and potential regulator of the mitochondrial dynamics and functions. Furthermore, negative regulation of Drp1Ser616 phosphorylation by ADRM1 provides the potential mechanistic basis to illustrate the defects associated with excess HAP40. Identification of ADRM1 as a regulator in relieving HAP40-induced mitochondrial defects illuminates a novel opportunity for potential therapeutic strategies treating the HD patients.
Materials and Methods
Cell culture and Mdivi-1 treatment
Conditionally immortalized wild-type STHdhQ7/Q7 (Coriell ID: CH00097, RRID: CVCL_M590) striatal cell lines was purchased from Coriell (USA). The wild-type STHdhQ7/Q7 striatal cells were grown in DMEM supplemented with 10% non-heat inactivated FBS (1% Pen/Strep and 400 μg/mL G418, Geneticin) (Gibco) and incubated in a humidified chamber with 5% CO2 at 33 °C. STHdhQ7/Q7 striatal cells used in this study were maintained within 14 passages as recommended by Coriell. Mdivi-1 (Sigma) was dissolved in DMSO to make 50 mM stock solution. For the Drp1 inhibition experiments, STHdhQ7/Q7 striatal cells were incubated with 25 or 50 μM Mdivi-1 for 2 hrs before functional assays.
Primary cortical neuron culture
The animal protocol performed in this study had been approved by the Institutional Animal Care and Use Committee at National Cheng Kung University, Taiwan (IACUC Approval No: 98225, 100070, 101162, 102163, 103094 and 104067). All methods were performed in accordance with the relevant guidelines and regulations. Primary cortical cells were prepared from postnatal day 1 pup of C57BL/6 mice and cultured as described previously with minor modifications [66]. Briefly, neocortex was excised in cold HBSS (Invitrogen). For cortical neuron preparation, neocortex was digested by 0.22 μm-filtered sterilized 45U papain mixture (Worthington Biochemicals) in PBS (Invitrogen) containing DL-cysteine HCl (Sigma), bovine serum albumin (Sigma), and D-glucose (Sigma) with 0.05% DNase (Roche Diagnostics), and incubated at 37°C for 30 min. After papain digestion, neocortex was triturated 10 times in 2 ml of growth medium and plated onto wells (150,000 cells per well in 24-well dish) precoated with 0.05 μg/ml poly-D-lysine and 1μg/ml laminin (Sigma) in DMEM supplemented with 10% heat-inactivated FBS (Invitrogen). After 2 hrs of incubation, the culture medium was replaced by Neurobasal medium supplemented with 2% B27 and 1mM GlutaMAX (Gibco). The cells were incubated in the presence of 5% CO2 at 37°C for 5 days. One half of culture medium was replaced every 3 days.
Cell Transfection
STHdhQ7/Q7 striatal cells were transfected with Lipofectamine 2000 (Invitrogen) the following day after plating as recommended by the manufacture's protocol. Primary cortical neurons and cell lines were transfected with Lipofectamine 2000 (Invitrogen) after 5 day and 2 day in vitro (DIV), respectively, as recommended by the manufacture's protocol. Transfected cells were allowed to recover for 48 hours after transfection.
DNA constructs
The pMito-eGFP plasmid encodes a mitochondrial targeting sequence of human cytochrome c oxidase subunit VIII fused to GFP in peGFP-N1 vector [67]. The p3xFLAG-HAP40 plasmid was constructed by inserting a mouse HAP40 cDNA between the BglII and BamHI sites of the p3xFLAG-CMV-10 expression vector (Sigma). The pcDNA3.1 hHAP40-mCherry plasmid was constructed by inserting the human HAP40 cDNA into the pcDNA3.1 mCherry vector (gift from Dr. Roger Y. Tsien, UCSD). The pcDNA5-FLAG-ADRM1 (Addgene, plasmid catalog #19417) expression vector was purchased from the Addgene Inc. (USA). The ADRM1 knockdown vectors were purchased from the National RNAi Core Facility located at the Genomic Research Center of the Institute of Molecular Biology, Academia Sinica, Taiwan. Targeted sequence for short hairpin RNA (shRNA)-induced silencing of ADRM1#1 (Clone ID: TRCN0000125944) is 5′- CCATGCAGAACAATGCCAAAT-3′ and ADRM1#2 (Clone ID: TRCN0000125945) is 5′- GACTTGATTATCTTTCCTGAT-3′ using pLKO.1 vector. The pLKO.Luc. shRNA directed against luciferase was used as control shRNA.
Western blot analysis
Cells were washed twice with iced-cold PBS, scraped, and resuspended in lysis buffer (50 mM Tris-HCl pH 7.4, 0.1 mM EDTA, 0.15 M NaCl, 0.25% deoxycholic acid, 1% NP-40 and 0.1% SDS) containing 1:200 protease inhibitor cocktail (Sigma). After incubation on ice for 10 min, lysates were briefly sonicated and cleared by centrifugation at 17,200 × g for 15 min and stored at -80°C freezer. The protein concentration of the cell lysates was determined by the DC Protein Assay (Bio-Rad). Thirty μg of protein lysates were separated on 4-12% Bis-Tris NuPage gels (Invitrogen). Proteins were then transferred to a nitrocellulose membrane (PerkinElmer) at 4°C for 16 hrs in Tris-glycine buffer (25 mM Tris-HCl, 190 mM glycine, and 10% methanol). The membranes were washed briefly with TBS-T buffer three times, blocked with 5% nonfat milk in TBS-T buffer (50 mM Tris-HCl pH 7.5, 150 mM NaCl, and 0.05% Tween 20) at room temperature for an hour, and then incubated with a primary antibody at 4°C for overnight. After washing membranes with TBS-T buffer three times with 5 min intervals, membranes were incubated with the HRP-coupled secondary antibody at room temperature for 60 min. Proteins were detected using the enhanced chemiluminescence (ECL) assay-Western Lightning® ECL Pro (PerkinElmer) and the signals were captured by GeneGnome bio imaging system (Syngene). Proteins quantification and background correction were done using the GeneTools image analysis software (Syngene).
Quantitation of mitochondrial membrane potential
The mitochondrial membrane potential was tracked by staining with JC-1, a mitochondrial membrane potential probe, and followed by flow cytometry analysis. Control cells plated in growth medium were treated with vehicle or 50 μM FCCP (Sigma Aldrich) for 30 min at 37°C, followed by incubation with 2 μM JC-1 dye (Invitrogen) for 30 min at 37°C and analyzed by FACScan (BD Biosciences, San Jose, CA, USA). Unstained cells were acquired to set the dot plot quadrants. Green JC-1 monomers or red JC-1 aggregates fluorescence signals were detected in the FL1 and FL2 channels, respectively. FACScan compensation settings were adjusted with FCCP-treated cells. Experiments were carried out in triplicate and 1 × 10⁴ cells were acquired for each test sample. Mitochondrial depolarization was measured by a reduction in the red/green fluorescence intensity ratio (Figure S1).
Cell-based ATP assay
Cells were cultured in 96-well plate containing 100 μl culture media. Forty-eight hrs after transfection, the intracellular levels of ATP were determined by luminescence assay with ATPlite 1 Step kit (PerkinElmer) according to the manufacturer's instructions. The total cell numbers were measured by MTT assay and the number was used to normalize the cellular ATP content. Three technical replicates were performed. Each experiment was repeated three times as biological replicates.
MTT assay
Cells were grown in a 96-well plate for 48 hrs after transfection, and then incubated with 5 mg/ml MTT (3-(4,5-dimethylthiazol-2-yl)-2,5-diphenyltetrazolium bromide, Sigma) for 4 hrs at 37°C. The precipitated formazan was dissolved by incubating cells in the solubilization buffer (10% SDS with 0.01M HCl) at 37°C for overnight in a humidified chamber. The reactions were monitored at 595 nm. Cell number was measured as suggested by manufacture. Three technical replicates were performed. Quantification data were derived from three biological replicates.
Analysis of cellular reactive oxygen species levels
Cells were cultured in 6 cm culture dish. Forty-eight hrs after transfection, the levels of ROS were determined by Flow cytometry using the FACS Caliber system (BD Biosciences, San Jose, CA) with Total ROS/Superoxide detection Kit (Enzo) according to the manufacturer's instructions. Briefly, cells were washed with 1X PBS and incubated with the ROS (Green) detection solution at 37°C for 30 min in the dark. At least 1 × 10⁴ cells were analyzed for each sample. The percentage of ROS-positive cells was calculated using the FlowJo software. Signals produced by ROS will be detected in the FL1 channel. Cells with increased levels of ROS demonstrate a bright green staining in the presence of the ROS Detection Reagent and can be registered in FL1 channel. Such cells will appear in the upper and lower right quadrants of a log FL1 (X-axis) versus a log FL2 (Y-axis) dot plot. Quantification data were derived from three biological replicates. Positive control cells were treated with 100 μM Pyocyanin (a ROS inducer) for 30 minutes. Negative control cells were treated with 5 μM N-acetyl-L-cysteine (a ROS Inhibitor) for 30 minutes followed by treatment with 100 μM Pyocyanin (ROS inducer) for another 30 minutes. Cells were stained using the ROS detection Kit and analyzed by flow cytometry (Figure S7). Untreated cells were used as a negative control. Cell debris was ungated and compensation was performed using Pyocyanin-treated samples.
Fluorescence microscopy imaging
Cells grown on coverslips in 24-well plate wells were transfected and incubated for 48 hours. The cells were quickly rinsed with warm 1× PBS and subsequently fixed with 2% paraformaldehyde (Merck) at room temperature in dark for 30 min. Each coverslip was carefully inverted onto a microscope slide containing VECTASHIELD® hard-set mounting medium containing 4',6-diamidino-2-phenylindole (DAPI) (Vector Laboratories). Fluorescence imaging was captured by the Nikon Eclipse Ti epifluorescence inverted microscope or the Zeiss LSM710 confocal microscope.
Semi-quantitative analysis of mitochondria fragmentation index
The mitochondria morphologies were visualized by the Eclipse Ti epifluorescence inverted microscope (Nikon). Images were taken by the NIS-Elements documentation software (Nikon). To monitor the mitochondrial morphology, STHdh striatal neuronal cells were transfected with a mito-eGFP expression plasmid reporter construct, which encodes a mitochondrial targeting green fluorescence protein (GFP) that allows for visualization of mitochondria [67]. Cells were assigned to one of three groups based on the morphology of their mitochondria [23, 68]. Tubular indicates mitochondria appear in tubule, elongated shape. Intermediate indicates mixture of tubule-shape and small rounded mitochondria. Fragmented indicates small rounded mitochondria. More than 100 cells were examined in each experiment.
Measurement of mitochondrial length
Mitochondrial length was calculated using the measured perimeter of identified objects in cell body and neurites of cortical neurons transfected with pMito-eGFP as described previously [40]. Images were recorded using Eclipse Ti epifluorescence inverted microscope (Nikon). Mitochondrial length was measured using NIS-Elements Documentation software (Nikon). Mitochondrial population was represented in terms of frequency of mitochondrial length present in cortical neurons positive transfected with pMito-eGFP. More than 100 clearly identifiable mitochondria from 10-15 randomly selected cells were measured in each experiment. Quantification data were derived from three independent experiments.
Antibodies
Primary antibodies were diluted using milk diluent/blocking solution concentrate (Kirkegaard & Perry Laboratories, Gaithersburg, Maryland, USA). Secondary antibodies were diluted in 5% skim milk in 1× Tris-buffered saline Tween (TBST). Antibodies used in this study are: anti-HAP40 (a.a. 293-310, 1:3300; LTK BioLaboratories, Taiwan), anti-ADRM1 (ab157218, 1:1000; Abcam), anti-Mfn1 (ab57602, 1:1000; Abcam), anti-Mfn2 (GTX102058, 1:500; GeneTex), anti-OPA1 (sc-30572, 1:200; Santa Cruz Biotechnology, Inc.), anti-Fis1 (sc-98900, 1:200; Santa Cruz Biotechnology, Inc.), anti-Drp1 (8570, 1:1000; Cell signaling), anti-phospho Drp1(Ser616) (3455, 1:1000; Cell signaling), anti-Parkin (ab15954, 1:1000; Abcam), anti-PINK1 (ab75487, 1:500; Abcam), anti-PHB1 (2426, 1:1000; Cell signaling), anti-Tubulin (T6074, 1:5000; Sigma), anti-GAPDH (MAB374, 1:500; Millipore Bioscience Research Reagents) and anti-Actin (MAB1501, 1:1000; Millipore Bioscience Research Reagents).
Statistical analysis
The experimental results were expressed as mean ± standard error (SEM). The data were analyzed using Student's t-test for two-group comparisons or using one-way ANOVA followed by the Student's t-test (*P < 0.05; **P < 0.01; ***P < 0.005; N.S., not significant).
Supplementary Material
Supplementary figures.
Acknowledgements
We thank Dr. Yau-Sheng Tsai (Institute of Clinical Medicine, National Cheng Kung University, Taiwan) for critical reading and helpful discussion. We express our appreciation to Confocal Core facility at Academia Sinica Biotechnology Center in Southern Taiwan for the assistance with confocal microscopy. This work was supported by National Science Council grants (NSC 99-2311-B-006-001, NSC 100-2311-B-006-002, NSC 101-2311-B-006-006, and NSC 102-2311-B-006-004), the Ministry of Science and Technology grants (103-2320-B-006-040 and 104-2320-B-006-013) to Lu-Shiun Her. And in part, the Ministry of Education grant (The Aim for the Top University Project) to the National Cheng Kung University, Taiwan, R.O.C.
Author Contributions
Zih-Ning Huang did most of the experiments and analyzed data. Her Min Chung did Western blotting of HAP40 overexpression experiments. Lu-Shiun Her designed experiments and oversaw the progression. Su-Chiung Fang and Lu-Shiun Her drafted the manuscript. All authors read and approved the final manuscript.
Competing Interests
The authors have declared that no competing interest exists.
References
1. Manczak M, Calkins MJ, Reddy PH. Impaired mitochondrial dynamics and abnormal interaction of amyloid beta with mitochondrial protein Drp1 in neurons from patients with Alzheimer's disease: implications for neuronal damage. Hum Mol Genet. 2011;20:2495-2509
2. Baloh RH, Schmidt RE, Pestronk A, Milbrandt J. Altered axonal mitochondrial transport in the pathogenesis of Charcot-Marie-Tooth disease from mitofusin 2 mutations. J Neurosci. 2007;27:422-430
3. Misko AL, Sasaki Y, Tuck E, Milbrandt J, Baloh RH. Mitofusin2 mutations disrupt axonal mitochondrial positioning and promote axon degeneration. J Neurosci. 2012;32:4145-4155
4. Zhang J, Yuan Y, Lin B, Feng H, Li Y, Dai X, Zhou H, Dong X, Liu XL, Guan MX. A novel OPA1 mutation in a Chinese family with autosomal dominant optic atrophy. Biochem Biophys Res Commun. 2012;419:670-675
5. Munoz-Sanjuan I, Bates GP. The importance of integrating basic and clinical research toward the development of new therapies for Huntington disease. J Clin Invest. 2011;121:476-483
6. Browne SE, Bowling AC, MacGarvey U, Baik MJ, Berger SC, Muqit MM, Bird ED, Beal MF. Oxidative damage and metabolic dysfunction in Huntington's disease: selective vulnerability of the basal ganglia. Ann Neurol. 1997;41:646-653
7. Tabrizi SJ, Cleeter MW, Xuereb J, Taanman JW, Cooper JM, Schapira AH. Biochemical abnormalities and excitotoxicity in Huntington's disease brain. Ann Neurol. 1999;45:25-32
8. Browne SE, Ferrante RJ, Beal MF. Oxidative stress in Huntington's disease. Brain Pathol. 1999;9:147-163
9. Damiano M, Galvan L, Deglon N, Brouillet E. Mitochondria in Huntington's disease. Biochim Biophys Acta. 2010;1802:52-61
10. Shirendeb U, Reddy AP, Manczak M, Calkins MJ, Mao P, Tagle DA, Reddy PH. Abnormal mitochondrial dynamics, mitochondrial loss and mutant huntingtin oligomers in Huntington's disease: implications for selective neuronal damage. Hum Mol Genet. 2011;20:1438-1455
11. Shirendeb UP, Calkins MJ, Manczak M, Anekonda V, Dufour B, McBride JL, Mao P, Reddy PH. Mutant huntingtin's interaction with mitochondrial protein Drp1 impairs mitochondrial biogenesis and causes defective axonal transport and synaptic degeneration in Huntington's disease. Hum Mol Genet. 2012;21:406-420
12. A novel gene containing a trinucleotide repeat that is expanded and unstable on Huntington's disease chromosomes. The Huntington's Disease Collaborative Research Group. Cell. 1993;72:971-983
13. Landwehrmeyer GB, McNeil SM, Dure LS, Ge P, Aizawa H, Huang Q, Ambrose CM, Duyao MP, Bird ED, Bonilla E. et al. Huntington's disease gene: regional and cellular expression in brain of normal and affected individuals. Ann Neurol. 1995;37:218-230
14. Sharp AH, Loev SJ, Schilling G, Li SH, Li XJ, Bao J, Wagster MV, Kotzuk JA, Steiner JP, Lo A. et al. Widespread expression of Huntington's disease gene (IT15) protein product. Neuron. 1995;14:1065-1074
15. Schilling G, Sharp AH, Loev SJ, Wagster MV, Li SH, Stine OC, Ross CA. Expression of the Huntington's disease (IT15) protein product in HD patients. Hum Mol Genet. 1995;4:1365-1371
16. Hoogeveen AT, Willemsen R, Meyer N, de Rooij KE, Roos RA, van Ommen GJ, Galjaard H. Characterization and localization of the Huntington disease gene product. Hum Mol Genet. 1993;2:2069-2073
17. DiFiglia M, Sapp E, Chase K, Schwarz C, Meloni A, Young C, Martin E, Vonsattel J-P, Carraway R, Reeves SA, Boyce FM, Aronin N. Huntingtin is a cytoplasmic protein associated with vesicles in human and rat brain neurons. Neuron. 1995;14:1075-1081
18. Harjes P, Wanker EE. The hunt for huntingtin function: interaction partners tell many different stories. Trends Biochem Sci. 2003;28:425-433
19. Peters MF, Ross CA. Isolation of a 40-kDa Huntingtin-associated protein. J Biol Chem. 2001;276:3188-3194
20. Pal A, Severin F, Lommer B, Shevchenko A, Zerial M. Huntingtin-HAP40 complex is a novel Rab5 effector that regulates early endosome motility and is up-regulated in Huntington's disease. J Cell Biol. 2006;172:605-618
21. Pal A, Severin F, Hopfner S, Zerial M. Regulation of endosome dynamics by Rab5 and Huntingtin-HAP40 effector complex in physiological versus pathological conditions. Methods Enzymol. 2008;438:239-257
22. Milakovic T, Johnson GV. Mitochondrial respiration and ATP production are significantly impaired in striatal cells expressing mutant huntingtin. J Biol Chem. 2005;280:30773-30782
23. Jin YN, Yu YV, Gundemir S, Jo C, Cui M, Tieu K, Johnson GV. Impaired mitochondrial dynamics and Nrf2 signaling contribute to compromised responses to oxidative stress in striatal cells expressing full-length mutant huntingtin. PLoS One. 2013;8:e57932
24. Huang ZN, Her LS. The Ubiquitin Receptor ADRM1 Modulates HAP40-Induced Proteasome Activity. Mol Neurobiol. 2017;54:7382-7400
25. Aguileta MA, Korac J, Durcan TM, Trempe JF, Haber M, Gehring K, Elsasser S, Waidmann O, Fon EA, Husnjak K. The E3 Ubiquitin Ligase Parkin Is Recruited to the 26 S Proteasome via the Proteasomal Ubiquitin Receptor Rpn13. J Biol Chem. 2015;290:7492-7505
26. Karbowski M, Spodnik JH, Teranishi M, Wozniak M, Nishizawa Y, Usukura J, Wakabayashi T. Opposite effects of microtubule-stabilizing and microtubule-destabilizing drugs on biogenesis of mitochondria in mammalian cells. J Cell Sci. 2001;114:281-291
27. Anesti V, Scorrano L. The relationship between mitochondrial shape and function and the cytoskeleton. Biochim Biophys Acta. 2006;1757:692-699
28. Saxton WM, Hollenbeck PJ. The axonal transport of mitochondria. J Cell Sci. 2012;125:2095-2104
29. Sukhorukov VM, Meyer-Hermann M. Structural Heterogeneity of Mitochondria Induced by the Microtubule Cytoskeleton. Sci Rep. 2015;5:13924
30. Zorov DB, Juhaszova M, Sollott SJ. Mitochondrial reactive oxygen species (ROS) and ROS-induced ROS release. Physiol Rev. 2014;94:909-950
31. Chan DC. Fusion and fission: interlinked processes critical for mitochondrial health. Annu Rev Genet. 2012;46:265-287
32. Blättler SM, Verdeguer F, Liesa M, Cunningham JT, Vogel RO, Chim H, Liu H, Romanino K, Shirihai OS, Vazquez F, Rüegg MA, Shi Y, Puigserver P. Defective mitochondrial morphology and bioenergetic function in mice lacking the transcription factor Yin Yang 1 in skeletal muscle. Mol Cell Biol. 2012;32:3333-3346
33. Senyilmaz D, Virtue S, Xu X, Tan CY, Griffin JL, Miller AK, Vidal-Puig A, Teleman AA. Regulation of mitochondrial morphology and function by stearoylation of TFR1. Nature. 2015;525:124-128
34. Chen H, Chomyn A, Chan DC. Disruption of fusion results in mitochondrial heterogeneity and dysfunction. J Biol Chem. 2005;280:26185-26192
35. Frank S. Dysregulation of mitochondrial fusion and fission: an emerging concept in neurodegeneration. Acta Neuropathol. 2006;111:93-100
36. Yu T, Sheu SS, Robotham JL, Yoon Y. Mitochondrial fission mediates high glucose-induced cell death through elevated production of reactive oxygen species. Cardiovasc Res. 2008;79:341-351
37. Frank M, Duvezin-Caubet S, Koob S, Occhipinti A, Jagasia R, Petcherski A, Ruonala MO, Priault M, Salin B, Reichert AS. Mitophagy is triggered by mild oxidative stress in a mitochondrial fission dependent manner. Biochim Biophys Acta. 2012;1823:2297-2310
38. Yu T, Fox RJ, Burwell LS, Yoon Y. Regulation of mitochondrial fission and apoptosis by the mitochondrial outer membrane protein hFis1. J Cell Sci. 2005;118:4141-4151
39. Jheng HF, Tsai PJ, Guo SM, Kuo LH, Chang CS, Su IJ, Chang CR, Tsai YS. Mitochondrial fission contributes to mitochondrial dysfunction and insulin resistance in skeletal muscle. Mol Cell Biol. 2012;32:309-319
40. Quintanilla RA, Dolan PJ, Jin YN, Johnson GV. Truncated tau and Aβ cooperatively impair mitochondria in primary neurons. Neurobiol Aging. 2012;33:619.e25-35
41. Rambold AS, Kostelecky B, Elia N, Lippincott-Schwartz J. Tubular network formation protects mitochondria from autophagosomal degradation during nutrient starvation. Proc Natl Acad Sci U S A. 2011;108:10190-10195
42. Taguchi N, Ishihara N, Jofuku A, Oka T, Mihara K. Mitotic phosphorylation of dynamin-related GTPase Drp1 participates in mitochondrial fission. J Biol Chem. 2007;282:11521-11529
43. Hoppins S. The regulation of mitochondrial dynamics. Curr Opin Cell Biol. 2014;29:46-52
44. Deng H, Dodson MW, Huang H, Guo M. The Parkinson's disease genes pink1 and parkin promote mitochondrial fission and/or inhibit fusion in Drosophila. Proc Natl Acad Sci U S A. 2008;105:14503-14508
45. Tanaka A, Youle RJ. A chemical inhibitor of DRP1 uncouples mitochondrial fission and apoptosis. Mol Cell. 2008;29:409-410
46. Manczak M, Reddy PH. Mitochondrial division inhibitor 1 protects against mutant huntingtin-induced abnormal mitochondrial dynamics and neuronal damage in Huntington's disease. Hum Mol Genet. 2015;24:7308-7325
47. Smirnova E, Griparic L, Shurland DL, van der Bliek AM. Dynamin-related protein Drp1 is required for mitochondrial division in mammalian cells. Mol Biol Cell. 2001;12:2245-2256
48. Otera H, Mihara K. Molecular mechanisms and physiologic functions of mitochondrial dynamics. J Biochem. 2011;149:241-251
49. Ishihara N, Otera H, Oka T, Mihara K. Regulation and physiologic functions of GTPases in mitochondrial fusion and fission in mammals. Antioxid Redox Signal. 2013;19:389-399
50. Chang CR, Blackstone C. Cyclic AMP-dependent protein kinase phosphorylation of Drp1 regulates its GTPase activity and mitochondrial morphology. J Biol Chem. 2007;282:21583-21587
51. Koopman WJ, Verkaart S, Visch HJ, van Emst-de Vries S, Nijtmans LG, Smeitink JA, Willems PH. Human NADH:ubiquinone oxidoreductase deficiency: radical changes in mitochondrial morphology. Am J Physiol Cell Physiol. 2007;293:C22-9
52. Fan X, Hussien R, Brooks GA. H2O2-induced mitochondrial fragmentation in C2C12 myocytes. Free Radic Biol Med. 2010;49:1646-1654
53. Munoz JP, Ivanova S, Sanchez-Wandelmer J, Martinez-Cristobal P, Noguera E, Sancho A, Diaz-Ramos A, Hernandez-Alvarez MI, Sebastian D, Mauvezin C, Palacin M, Zorzano A. Mfn2 modulates the UPR and mitochondrial function via repression of PERK. EMBO J. 2013;32:2348-2361
54. Picard M, Shirihai OS, Gentil BJ, Burelle Y. Mitochondrial morphology transitions and functions: implications for retrograde signaling? Am J Physiol Regul Integr Comp Physiol. 2013;304:R393-406
55. Muliyil S, Narasimha M. Mitochondrial ROS regulates cytoskeletal and mitochondrial remodeling to tune cell and tissue dynamics in a model for wound healing. Dev Cell. 2014;28:239-252
56. Cho DH, Nakamura T, Fang J, Cieplak P, Godzik A, Gu Z, Lipton SA. S-nitrosylation of Drp1 mediates beta-amyloid-related mitochondrial fission and neuronal injury. Science. 2009;324:102-105
57. Qi X, Disatnik MH, Shen N, Sobel RA, Mochly-Rosen D. Aberrant mitochondrial fission in neurons induced by protein kinase C{delta} under oxidative stress conditions in vivo. Mol Biol Cell. 2011;22:256-265
58. Bossy B, Petrilli A, Klinglmayr E, Chen J, Lutz-Meindl U, Knott AB, Masliah ES, Bossy-Wetzel E. S-Nitrosylation of DRP1 does not affect enzymatic activity and is not specific to Alzheimer's disease. Journal of Alzheimer's Disease. 2010;20:S513-S526
59. Qiu XB, Ouyang SY, Li CJ, Miao S, Wang L, Goldberg AL. hRpn13/ADRM1/GP110 is a novel proteasome subunit that binds the deubiquitinating enzyme, UCH37. EMBO J. 2006;25:5742-5753
60. Yao T, Song L, Xu W, DeMartino GN, Florens L, Swanson SK, Washburn MP, Conaway RC, Conaway JW, Cohen RE. Proteasome recruitment and activation of the Uch37 deubiquitinating enzyme by Adrm1. Nat Cell Biol. 2006;8:994-1002
61. Vives-Bauza C, Zhou C, Huang Y, Cui M, de Vries RL, Kim J, May J, Tocilescu MA, Liu W, Ko HS, Magrané J, Moore DJ, Dawson VL, Grailhe R, Dawson TM, Li C, Tieu K, Przedborski S. PINK1-dependent recruitment of Parkin to mitochondria in mitophagy. Proc Natl Acad Sci U S A. 2010;107:378-383
62. Neueder A, Bates GP. A common gene expression signature in Huntington's disease patient brain regions. BMC Med Genomics. 2014;7:60
63. Mastrokolias A, Ariyurek Y, Goeman JJ, van Duijn E, Roos RA, van der Mast RC, van Ommen GB, den Dunnen JT, t Hoen PA, van Roon-Mom WM. Huntington's disease biomarker progression profile identified by transcriptome sequencing in peripheral blood. Eur J Hum Genet. 2015;23:1349-1356
64. Ratovitski T, Chaerkady R, Kammers K, Stewart JC, Zavala A, Pletnikova O, Troncoso JC, Rudnicki DD, Margolis RL, Cole RN, Ross CA. Quantitative Proteomic Analysis Reveals Similarities between Huntington's Disease (HD) and Huntington's Disease-Like 2 (HDL2) Human Brains. J Proteome Res. 2016;15:3266-3283
65. Schönberger SJ, Jezdic D, Faull RL, Cooper GJ. Proteomic analysis of the human brain in Huntington's Disease indicates pathogenesis by molecular processes linked to other neurodegenerative diseases and to type-2 diabetes. J Huntingtons Dis. 2013;2:89-99
66. Her LS, Goldstein LS. Enhanced sensitivity of striatal neurons to axonal transport defects induced by mutant huntingtin. J Neurosci. 2008;28:13662-13672
67. Falzone TL, Stokin GB, Lillo C, Rodrigues EM, Westerman EL, Williams DS, Goldstein LS. Axonal stress kinase activation and tau misbehavior induced by kinesin-1 transport defects. J Neurosci. 2009;29:5758-5767
68. Tronstad KJ, Nooteboom M, Nilsson LI, Nikolaisen J, Sokolewicz M, Grefte S, Pettersen IK, Dyrstad S, Hoel F, Willems PH, Koopman WJ. Regulation and quantification of cellular mitochondrial morphology and content. Curr Pharm Des. 2014;20:5634-5652
Author contact
![]() Corresponding author: lsherncku.edu.tw; Tel.: +886-6-2757575 (ext. 65533); Fax: +886-6-2742583
Corresponding author: lsherncku.edu.tw; Tel.: +886-6-2757575 (ext. 65533); Fax: +886-6-2742583