10
Impact Factor
ISSN: 1449-2288
Int J Biol Sci 2018; 14(1):21-35. doi:10.7150/ijbs.21547 This issue Cite
Research Paper
Human Papillomavirus Types 16 and 18 Early-expressed Proteins Differentially Modulate the Cellular Redox State and DNA Damage
1. Programa de Maestría y Doctorado en Ciencias Bioquímicas, Facultad de Química, Universidad Nacional Autónoma de México, Ciudad Universitaria, 04510 Ciudad de México, México;
2. Unidad de Investigación Biomédica en Cáncer, Instituto Nacional de Cancerología, México/Instituto de Investigaciones Biomédicas, Universidad Nacional Autónoma de México. San Fernando No. 22, Col. Sección XVI, Tlalpan, 14080 Ciudad de México, México;
3. CONACyT Research Fellow, Instituto Nacional de Cancerología, San Fernando No. 22, Col. Sección XVI, Tlalpan, México;
4. Departamento de Biología, Facultad de Química, Universidad Nacional Autónoma de México, Ciudad Universitaria, 04510 Ciudad de México, México;
5. Departamento de Medicina Genómica y Toxicología Ambiental, Instituto de Investigaciones Biomédicas, Universidad Nacional Autónoma de México, 04510 Ciudad de México, México.
Received 2017-6-20; Accepted 2017-10-31; Published 2018-1-1
Abstract

Oxidative stress has been proposed as a risk factor for cervical cancer development. However, few studies have evaluated the redox state associated with human papillomavirus (HPV) infection. The aim of this work was to determine the role of the early expressed viral proteins E1, E2, E6 and E7 from HPV types 16 and 18 in the modulation of the redox state in an integral form. Therefore, generation of reactive oxygen species (ROS), concentration of reduced glutathione (GSH), levels and activity of the antioxidant enzymes catalase and superoxide dismutase (SOD) and deoxyribonucleic acid (DNA) damage, were analysed in epithelial cells ectopically expressing the viral proteins. Our research shows that E6 oncoproteins decreased GSH and catalase protein levels, as well as its enzymatic activity, which was associated with an increase in ROS production and DNA damage. In contrast, E7 oncoproteins increased GSH, as well as catalase protein levels and its activity, which correlated with a decrease in ROS without affecting DNA integrity. The co-expression of both E6 and E7 oncoproteins neutralized the effects that were independently observed for each of the viral proteins. Additionally, the combined expression of E1 and E2 proteins increased ROS levels with the subsequent increase in the marker for DNA damage phospho-histone 2AX (γH2AX). A decrease in GSH, as well as SOD2 levels and activity were also detected in the presence of E1 and E2, even though catalase activity increased. This study demonstrates that HPV early expressed proteins differentially modulate cellular redox state and DNA damage.
Keywords: Human papillomavirus early-expressed proteins, redox state, ROS, catalase, SOD1/2, GSH, DNA damage.
Introduction
A persistent infection with high-risk human papillomavirus (HR-HPV) is the main requirement for cervical cancer development [1], being HPV16 and HPV18 the most prevalent types found in cancer biopsies [2]. E6 and E7 are the main viral oncoproteins that bind to and modulate numerous cellular proteins, resulting in immortalization and transformation. Among the best-studied interactions, E7 degrades and inactivates pRb, an essential molecule for cell cycle control [3], while E6 oncoprotein binds to and inactivates p53 and PDZ domain-containing proteins [4]. The transcription of E6 and E7 genes is controlled during the viral life cycle through the negative regulation of E2 viral protein [5]. Viral genome integration into the host genome is considered a key event in cervical cancer progression, which results in the increased expression of the transcripts encoding E6 and E7 oncogenes due to the loss of the E2 open reading frame (ORF) [6, 7].
E1 is an ATP-dependent viral helicase that associates with the origin of replication, inducing the unwinding of the viral DNA [8]. However, this process depends on the activity of E2, which increases specificity of E1 to the origin of replication and improves the replication process [9]. E2 has anti-proliferative functions that inhibit cell growth and induce apoptosis, which is done in part by suppressing the transcription of E6 and E7 and the consequent increase in p53 and pRb proteins [10]. Nevertheless, a role of E2 in cancer development has been suggested, as shown for its ability to induce skin tumour formation in a murine model [11].
The development of cancer is an uncommon outcome in the natural life cycle of HPV and other factors are needed to promote cancer progression [12], such as the immunological status, genetic susceptibility and oxidative stress (OS) [13].
The balance between oxidant and antioxidant molecules has been defined as a redox state. Oxidants, such as reactive oxygen species (ROS), are generated during cell metabolism, inflammation, infections, mechanical and chemical stress or cancer [14]. Physiological ROS production is related to cell signalling, proliferation and differentiation. However, elevated levels of ROS induce OS, which occurs when ROS surpass the effect of antioxidant molecules. When this condition persists, oxidative damage to lipids, proteins or nucleic acids occur, which can lead to cellular processes, such as apoptosis, necrosis or cancer [15]. Antioxidant enzymes, such as catalase and superoxide dismutase (SOD), are critical in the balance of ROS production; free radical scavengers are also involved, such as glutathione [16].
The expression patterns of HPV proteins change in relation to cellular differentiation [17]. These protein patterns could differentially influence the cellular redox state, eventually contributing to cancer development. Thus, the participation of HPV in modulating the redox state has become a topic of interest. It has been shown that E7 oncogene modulates the expression of catalase, B-cell lymphoma extra-large (Bcl-xL), interleukin-8 (IL-8), Fas, Bad and cytochrome C, resulting in resistance to OS-induced cell death in human keratinocyte cells [18]. The E6 small isoform E6* increases OS and induces deoxyribonucleic acid (DNA) damage [19]. Recently, Marrullo and co-workers [20] reported that HPV16 E6 and E7 oncoproteins induce OS and DNA damage in head and neck cancer cells. Lai and collaborators [21] demonstrated that HPV18 E2 binds to the mitochondrial crest proteins, such as ATP synthase, cytochrome c1 or cytochrome c oxidase subunit II, inducing mitochondrial crest damage and OS. Although some studies support the association of HPV proteins and OS, they focus on the analysis of individual viral proteins. Therefore, our main goal was to explore the redox state and DNA damage in a cervical cell model expressing the early proteins E6, E7, E1 and E2, analysed in an integral fashion. We used the C33A cell line, derived from cervical cancer, which presents a p53 mutation [22]. Despite such mutation, this cell line has proved being a useful epithelial model negative to HPV to reveal functional aspects of HPV proteins [23, 24]. In this study, we found that the HPV early expressed proteins differentially modulate ROS production and DNA damage as a possible consequence of alterations in the expression and activity of the antioxidant enzymes catalase and SOD.
Materials and Methods
Plasmids
The HPV16 and HPV18 E6 open reading frames were cloned into the p3XFLAG-CMV10 vector (Sigma-Aldrich, St. Louis, MO, USA) by standard PCR techniques. p3XFLAG-CMV10 vector harbours an ampicillin resistance cassette and a CMV promoter. HPV18 E7 and E1 sequences were cloned into the pcDNA3 vector (Invitrogen) adding at the N-terminus a 5X-histidine tag and a HA tag, respectively. HPV18 E2 expressing plasmid was generated by cloning the E2 coding region into the pcDNA3 vector. pcDNA3 vector harbours an ampicillin resistance cassette and a CMV promoter. Identity of each plasmid was verified by automated sequencing. HA tagged HPV16 E7 expressing plasmid was a kind gift from Dr. Lawrence Banks (ICGEB, Italy).
Cell culture and transfection
C33A cervical cancer derived cell line negative for HPV, was acquired from American Type Culture Collection (ATCC) and maintained in Dulbecco's Modified Eagle's Medium (DMEM) F12 medium supplemented with 10% foetal bovine serum (FBS). For transfection, 280, 000 cells were plated in a 60-mm dish and incubated to allow adherence; cells were transfected using PolyFect® (Qiagen, Hilden, Germany) according to the manufacturer's instructions. For single transfection, 2.5 μg of the indicated plasmid was used, whereas for combined transfection 1.25 μg of each plasmid was used. Forty-eight h after transfection, cells were harvested and processed either for immunoblot, ROS measurement, GSH quantification, or enzymatic activity analysis. Transfection efficiency was evaluated by immunofluorescence assays by counting one hundred cells, randomly selected, in three different experiments for each condition. Briefly, cells were seeded on slides in a 60-mm dish, then transfected and after 48 h, fixed and stained with primary antibodies diluted in PBS: anti-FLAG (1:50) (Sigma-Aldrich, St. Louis, MO, USA) for E6 from both HPV types; anti-HA (1:50) (Roche, Basel, Switzerland) for HPV16 E7 and HPV18 E1; anti-HPV18 E7 (1:50) (Santa Cruz Biotechnologies, Dallas, TX, USA) for HPV18 E7; or anti-HPV18 E2 (1:50) (Santa Cruz Biotechnologies) for HPV18 E2. After washing with PBS, slides were incubated with Alexa 488 in PBS (1:700) or Alexa 555 in PBS (1:700) secondary antibodies (Molecular Probes, Eugene, OR, USA), when appropriate. After several washes cells were counterstained using DAPI and mounted for fluorescence analysis using the EVOS FL microscope (Thermo Fisher Scientific, Waltham, MA, USA). Percentage of positive cells was graphed and statistical analysis was performed.
Cell viability
Viability of C33A cells transfected with the different plasmids was assessed by evaluating their lysosomal metabolism using the dual fluorochrome test: carboxyfluorescein diacetate (CFDA, Sigma-Aldrich)/ethidium bromide (Sigma-Aldrich). 48 hours post-transfection, C33A cells were harvested and mixed with a fluorochrome solution containing 0.015 μg/ml of CFDA and 0.02 μg/ml of ethidium bromide; then cells were analysed with a fluorescence microscope (Olympus BX-60), which contains a double filter that detects the fluorescence of both compounds. Green cells were identified as metabolically active or alive, while red cells were identified as dead cells. One hundred cells were randomly selected for each condition in three independent experiments and evaluated. Results are expressed as percentages.
Western blot analysis
Protein extracts were obtained by adding sample buffer to the cells, which were scraped and lysed by pipetting and boiling. Equal amounts of protein were loaded and separated in a SDS-PAGE; then, proteins were transferred onto a nitrocellulose membrane and incubated with the proper primary antibody. Membranes were blocked using 7.5% milk in TBS/T buffer. Primary antibodies were prepared in TBS/T buffer as follows: anti-glyceraldehyde 3 phosphate dehydrogenase (GAPDH, 1:1000) (Santa Cruz Biotechnologies), anti-SOD2 (1:1000) (Cell Signalling, Danvers, MA, USA), anti-SOD1 (1:1000) (Cell Signalling), anti-catalase (1:500) (Cell Signalling), anti-γH2AX (1:1000) (Abcam, Cambridge, UK), anti-H2AX (1:1000) (Upstate, Darmstadt, Germany), anti-His (1:1000) (Cell Signalling), anti-HA (1:1000) (Roche), anti-FLAG M2 (1:2000) (Sigma-Aldrich), and anti-HPV18 E2 (1:1000) (Abcam). Membranes were washed three times with PBS/T and incubated with HRP coupled secondary anti-mouse or rabbit antibodies (Santa Cruz Biotechnologies). Membranes were finally developed using the ChemoLuminiscent Reagent (Merck Millipore, Billerica, MA, USA) accordingly to the manufacturer's instructions. Densitometric analysis was performed using the ImageJ program ver.1.48h3, National Institutes of Health (NIH).
ROS quantification
ROS production was measured using the fluorescent probe dihydroethidium, DHE, as previously described by Pedraza-Chaverrí et al. [25]. DHE is oxidized to 2-hydroxyethidium (2-OH-E+) and ethidium (E+) in the cytosol by intracellular oxidants, such as superoxide anion (O2•-), hydroxyl radical (•OH), peroxynitrite (ONOO-) and peroxides [26, 27]. Due to their DNA binding capacity, both compounds are then retained in the nucleus, with which it is stained. ROS was identified as a red fluorescent signal at the microscope and quantified by fluorometry. Forty-eight h after transfection, 20 µM DHE was diluted in DMEM F12 without phenol red and added to the cells incubating for 30 min at 37 °C. The quantitative data of ROS and cell images were collected through the CytationTM 5 Cell Imaging Multi-Mode Reader from Biotek (Winoosky, VT, USA), which combines digital wide field microscopy with a conventional multi-mode microplate, providing high sensitivity in ROS quantification. Thus, cellular ROS production was visualized and measured at 510-560 nm excitation and at 590 nm emission. ROS were visualized and quantified in sixteen different fields per well per condition, in three independent experiments, using Gen5™ 3.0 software (https://www.biotek.com/products/software-robotics-software/gen5-microplate-reader-and-imager-software/, Biotek) for data acquisition and analysis.
GSH quantification
Total glutathione (reduced glutathione [GSH] + oxidized glutathione [GSSG]) was evaluated by the enzymatic recycling method described by Rahman et al. [28], in which GSH is oxidized by 5,5'-dithiobis-2-nitrobenzoic acid (DTNB) to 5-thio-2-nitrobenzoic acid (TNB, detectable at λ=412 nm) and TNB-glutathione adducts (GS-TNB). Both GS-TNB and GSSG are reduced by glutathione reductase (GR) in the presence of NADPH, to GSH, which in turn is oxidized by DTNB to TNB. In this manner, the amount of total glutathione calculated in this first step represents the sum of GSH and GSSG.
Next, GSSG was determined by the enzymatic recycling method mentioned above, where samples were previously treated with 2-vinylpyridine (2-VP). 2-VP, that can covalently associate with GSH, to remove all reduced glutathione, leaving the oxidized form of glutathione as the only measurable substrate of the assay. Finally, GSH was calculated by subtracting GSSG from total glutathione (GSH + GSSG).
Briefly, the cell extract of each transfection was diluted with 120 μl of KPE buffer (0.1 M potassium phosphate, 5 mM disodium EDTA, pH 7.5). Then, two separate samples of 20 μl each were used to measure either total glutathione or GSSG (these samples were previously treated with 2-VP), mixed with DTNB (2.5 mM) and GR (250 U/ml). Finally, β-NADPH was added and the absorbance at λ=412 nm was measured at intervals of 60 secs, for 2 min. The rate of change in absorbance for each experiment was compared with GSH or GSSG standards.
Antioxidant enzyme activity assays
The antioxidant enzyme activity was measured as previously described by Molina-Jijón et al. [29]. Briefly, SOD activity was spectrophotometrically evaluated at 560 nm based on nitroblue tetrazolium (NBT) reduction to formazan. The level of protein that inhibits NBT reduction to 50% was defined as one unit of SOD activity, comprising the activity of SOD 1 and SOD 2. Catalase activity was assayed at 240 nm by a method based on the decomposition of H2O2 by catalase contained in the samples. Units of catalase enzymatic activity are expressed as K/mg protein, as previously described by Aebi [30].
Statistical analysis
All experiments were performed in triplicate and data were analysed as the mean ±SD. ANOVA and the Tukey's test were used to determine the statistical significance of the experimental condition versus the control.
Results
HR-HPV E6 oncoproteins increase ROS production and decrease GSH levels
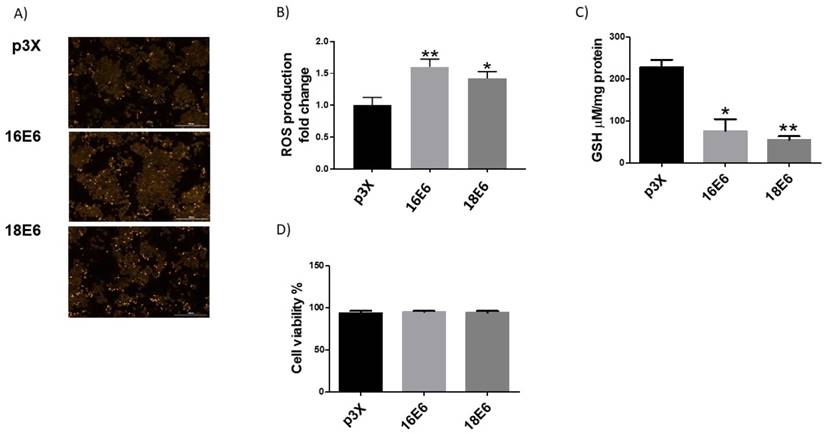
The transfection efficiency of the plasmids used in this study (E6, E7 and E6/E7 from HPV16 and 18 and E1, E2 and E1/E2 from HPV18) was evaluated in the C33A cell line, finding an average transfection efficiency of 49% (data not shown). To determine the influence of HPV16 and HPV18 E6 oncoproteins on the redox state, ROS production and GSH levels were measured. C33A cells transfected with flag-tagged E6 expressing plasmids from HPV types 16 and 18 showed an increase in ROS of 61% and 42%, respectively, compared to cells transfected with p3X control vector (Figure 1A and 1B). No differences were found in the levels of ROS among HPV types. It is known that a natural cellular response to an increment in ROS is its neutralization by antioxidant molecules such as GSH. As a result, GSH is oxidized and its levels decrease as long as ROS increase. Therefore, we evaluated GSH status in C33A cells transfected with plasmids expressing E6 from HPV16 and 18, where a measurable reduction in GSH levels was found (67% and 76%, respectively), compared with the control vector (Figure 1C). We also demonstrated that the observed changes in ROS levels due to the expression of the E6 oncoproteins, had no effect in cell viability as measured by the CFDA/Et-Br assay (Figure 1D).
E6 proteins modulate the levels and activity of antioxidant enzymes
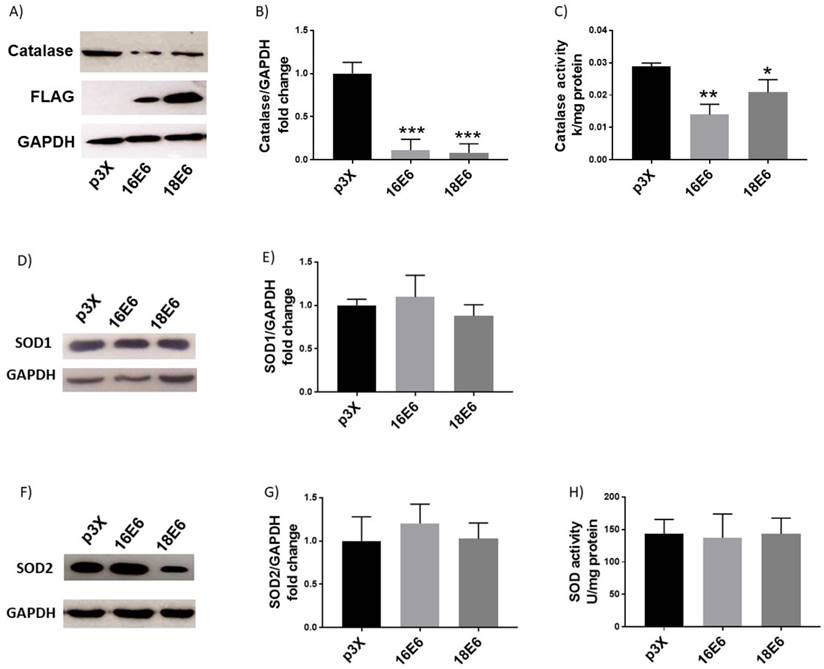
To determine whether E6 affects the antioxidant enzymes catalase and SOD, their levels and activities were evaluated. Figures 2A and B show a remarkable decrease in the catalase protein levels in the presence of E6 from HPV16 (up to 89%) and HPV18 (up to 92%) compared with cells transfected with the control vector. We further analysed if the reduction in protein levels also affected catalase activity. Figure 2C shows a decrease in catalase activity in the presence of E6 proteins from HPV16 (52%) and HPV18 (26%) with no differences among viral types. Afterwards, SOD1 and 2 levels and activity, which are also key antioxidant enzymes implicated in ROS regulation, were measured in the presence of E6 proteins. We did not find differences in SOD1 or 2 protein levels compared with the control cells, as indicated by the immunoblot and densitometric analysis (Fig. 2D, E, F, G). Furthermore, E6 oncoproteins did not modulate SOD activity (Fig. 2H).
E6 oncoproteins induce DNA damage
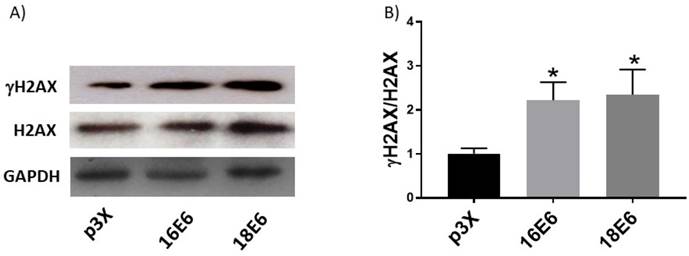
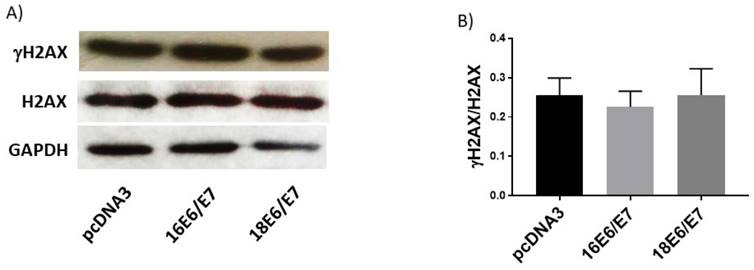
The presence of high levels of ROS is closely associated with DNA damage since it favours the breakdown of double-stranded DNA [31]. To determine if the increase in ROS induced by E6 oncoproteins could lead to DNA damage, we measured the phosphorylated form of the histone variant H2AX (γH2AX), a proficient biomarker for double-stranded DNA breaks [32]. We found that the γH2AX/H2AX ratio increased 2.2- and 2.3-fold in cells expressing E6 oncoproteins from HPV16 and 18, respectively, compared to cells transfected with the control plasmid, p3X (Fig. 3), which was associated with the increase in ROS.
HPV E7 oncoproteins reduce ROS levels and increase GSH levels
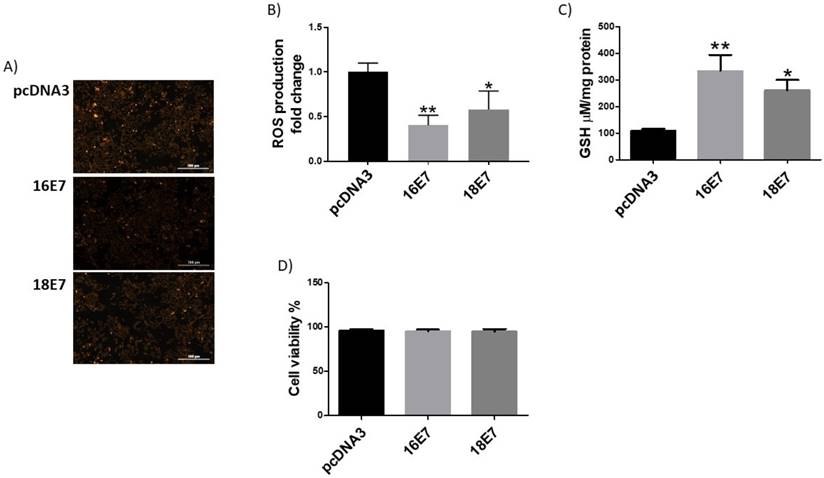
It has previously been demonstrated that the HPV16 E7 oncoprotein induces the expression of catalase and a decrease in ROS levels [33]. Therefore, we were interested in analysing the effect of E7 from both HPV16 and HPV18 in ROS production in the C33A cell line. Our results, demonstrated that E7 from HPV16 and 18 reduced the levels of ROS in 60% and 42%, respectively, compared to control transfected cells (Fig. 4A and 4B). Regarding GSH, we found that E7 from HPV16 and 18 increased GSH levels in 3 and 2.4- fold in C33A transfected cells, respectively (Figure 4C). C33A cell viability did not show any change in E7 transfected cell, in comparison with the p3X control vector (Figure 4D).
E7 oncoproteins change the levels and activity of antioxidant enzymes
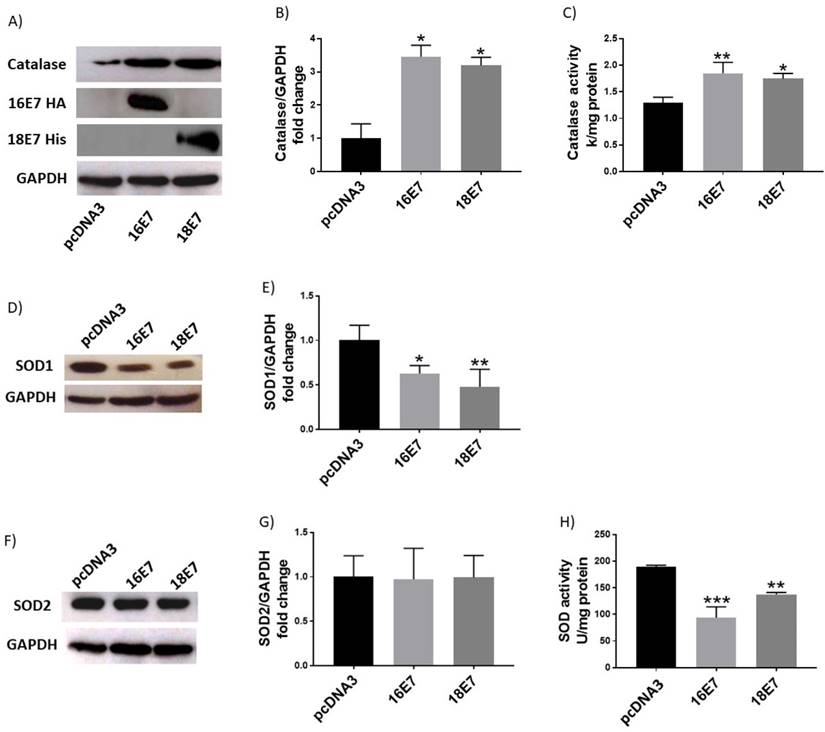
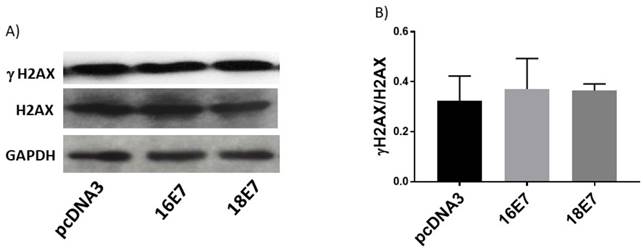
In contrast to the effect of E6 oncoproteins, ROS production decreased in cells expressing E7, as depicted in Figure 4; hence, we wondered if E7 could also affect catalase and SOD levels and their activities. C33A cells, transfected with HPV16 and 18 E7 expressing plasmids, exhibited 3.4- and 3.2-fold enrichment in catalase protein levels, respectively (Fig. 5A, B), with an increase in catalase activity of 46% and 40%, correspondingly (Fig. 5C). Additionally, SOD1 protein levels decreased in 37% and 52% in cells carrying E7 from HPV16 and 18, respectively (Fig. 5D, E). However, the levels of SOD2 did not change, as demonstrated by Western blot analysis (Fig. 5F, G). Meanwhile, SOD1/2 enzymatic activity decreased in 50% in the presence of E7 from HPV16 and 27% for HPV18 (Fig. 5H). Since E7 decreased ROS levels, as expected the γH2AX levels were not altered in the presence of E7 from either HPV type 16 or 18 as shown in Figure 6.
Human papillomavirus (HPV) E6 oncoproteins increase the production of reactive oxygen species (ROS) and GSH in C33A cells. Representative images (A) and quantitative data (B) of ROS induced by E6 from HPV types 16 and 18. Quantitative data were obtained 48 hours after transfection in cells expressing E6 from each viral type, comparing with p3X transfected cells as control. The mean intensity of ethidium fluorescence was measured in 16 different fields per well per condition using Gen5TM 3.0 software for image acquisition and quantification. E6 decreased GSH (C) and did not change C33A cell viability in comparison with the control vector (D). The fluorescence intensity, GSH levels and cell viability are expressed as the mean±SD. Tukey's test *p<0.05 and **p<0.005 vs control (p3X), n=3.
The combined expression of E6 and E7 does not affect ROS production
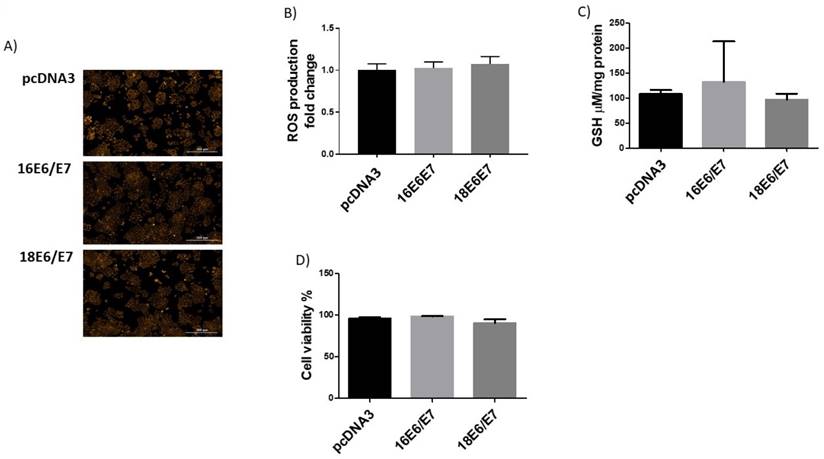
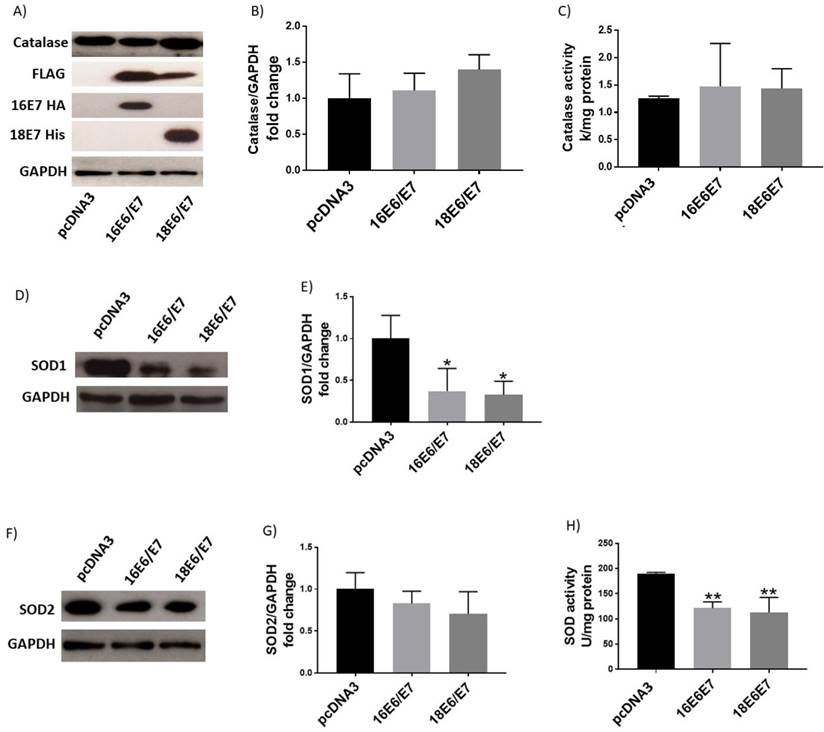
We demonstrated that the redox status of C33A cells is modulated by E6 and E7 with opposite effects (Figs. 1 and 4). It is worth noting that during an HPV infection, E6 and E7 oncoproteins are simultaneously expressed when translated from a single bicistronic E6-E7 transcript [34]. Therefore, we analysed the effect of the combined expression of E6 and E7 on redox regulation. E6 expressing plasmids were co-transfected together with tagged versions of E7 from both HPV16 and 18. Our results show no differences in either ROS production or GSH levels or cell viability when cells simultaneously expressed E6 and E7 oncogenes from each viral type, compared to the control (Fig. 7A, B, C, D). Additionally, catalase levels and activity did not show any change when both oncogenes were co-expressed (Fig. 8A, B, C). Among the antioxidant enzymes tested, SOD1 protein levels decreased in 63% and 67% in the presence of both oncoproteins E6/E7 from HPV16 and 18, respectively (Fig. 8D, E); in contrast, SOD2 remained unchanged (Fig. 8F, G). A decrease in SOD activity was also found when E6 and E7 were expressed together (Fig. 8H), although γH2AX levels did not change (Fig. 9A, B).
E1 and E2 co-expressed proteins increase ROS levels and decrease GSH levels
We further analysed the effect of HPV E1 and E2 proteins in the redox state. Since such viral proteins are highly conserved among HPV types [8, 35], we tested E1 and E2 from HPV type 18.
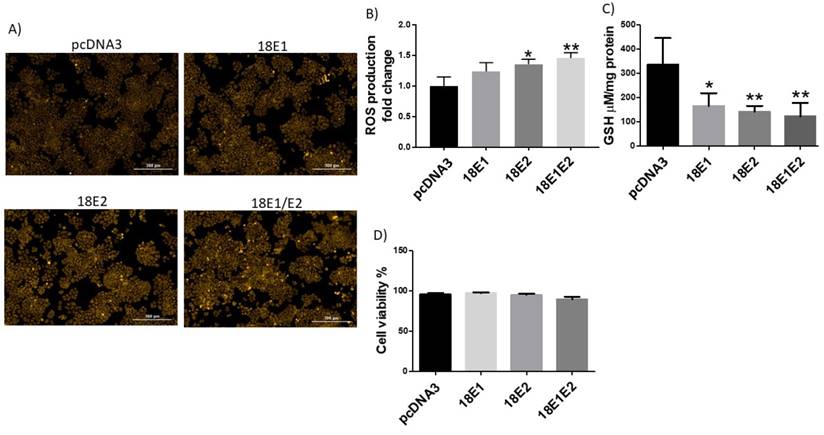
ROS levels were evaluated in cells transfected with HA-tagged E1 and E2 expressing plasmids. Figure 10 shows that while E1 did not affect this parameter, E2 increased ROS in 36%. Interestingly, the combined expression of E1 and E2 proteins showed a 46% increase in ROS compared to the control cells (Fig. 10A, B). We measured GSH in C33A cells expressing E1, E2 and E1/E2, finding a measurable decrease in GSH levels in 50%, 68% and 57%, respectively (Figure 10C). No changes in viability were found in cells expressing E1, E2 or E1/E2 (Figure 10D).
Human papillomavirus (HPV) E6 oncoproteins decrease catalase protein levels and activity and do not affect SOD1/2 levels or activity. Representative immunoblot (A) and quantitative densitometric (B) showing E6 expression and catalase protein levels in C33A cells after 48 hours of transfection with Flag-tagged HPV16 E6 or HPV18 E6 and p3X vector; glyceraldehyde 3 phosphate dehydrogenase (GAPDH) was used as a loading control. Catalase enzymatic activity in C33A transfected cells expressing HPV16 or 18 E6 oncoproteins (C). Representative immunoblot (D) and densitometric analysis (E) of superoxide dismutase (SOD) 1 in C33A transfected cells transfected; GAPDH was used as a loading control. Representative immunoblot (F) and densitometric analysis (G) of SOD2 expression, in relation to GAPDH. SOD enzymatic activity in C33A transfected cells (H). Data are expressed as the mean±SD. Tukey's test *p<0.05, **p<0.005, and ***p<0.0005 vs p3X control, n=3.
Human papillomavirus (HPV) E6 oncoproteins increase DNA damage in C33A cells. Representative immunoblots (A) showing total H2AX and γH2AX in C33A cells 48 hours after transfection with Flag-tagged HPV16 E6, HPV18 E6 and p3X vector. Glyceraldehyde 3 phosphate dehydrogenase (GAPDH) was used as a loading control. Densitometry of γH2AX and H2AX proteins (B). Data are expressed as the ratio of relative units between γH2AX and H2AX. Data are shown as the mean±SD. Tukey's test *p<0.05 vs p3X control. n=3.
Human papillomavirus (HPV) E7 oncoproteins decrease reactive oxygen species (ROS) and increase GSH in C33A cells. Representative images (A) and quantitative data (B) of ROS levels in HA-tagged HPV16 E7, HIS-tagged HPV18 E7 and control pcDNA3 expressing cells. Quantitative data were obtained 48 hours after transfection. The mean intensity of ethidium fluorescence was measured in 16 different fields per well per condition using Gen5TM 3.0 software for image acquisition and quantification. HPV 16 and 18 E7 increase GSH (C) without affecting cell viability (D), in comparison with pcDNA3 transfected cells. The fluorescence and GSH quantification and cell viability are expressed as the mean±SD. Tukey's test *p<0.05 and **p<0.005 vs control (p3X), n=3.
E1 and E2 increase catalase activity
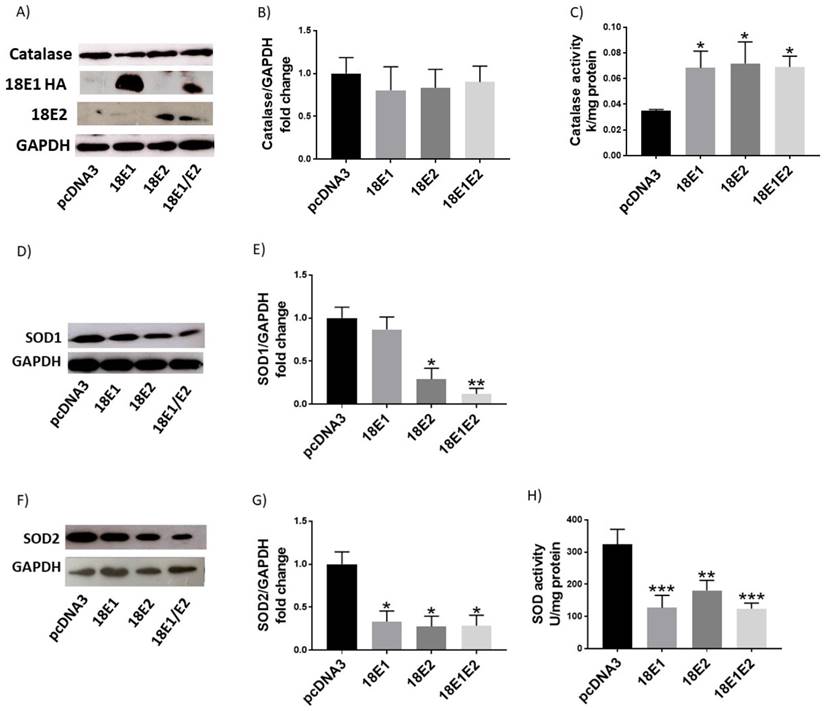
We next evaluated whether E1 and E2 proteins could affect the antioxidant enzyme levels or activity. We performed transient transfection of C33A cells with plasmids encoding HA-tagged E1 and E2 from HPV18. Figure 11A, B show that catalase levels were not affected by the presence of HPV18 E1 and E2, either singly transfected or combined. Nevertheless, when measuring catalase activity, we found an increase of approximately 1.9-fold for the tested conditions (Fig. 11C). Furthermore, we evaluated whether E1 and E2 affected SOD1 and SOD2 protein levels and activities. As depicted in figure 11D, E, SOD1 levels decreased in the presence of E2 in 71% or E1/E2 in 88%. Meanwhile, SOD2 levels decreased in 67% for E1, 73% for E2 and 72% for E1/E2 (Fig. 11F, G). Moreover, the presence of E1 decreased SOD activity in 61%, E2 in 44% and E1/E2 in 62% (Fig. 11H).
Human papillomavirus (HPV) E7 oncoproteins increase catalase protein levels and activity and decrease SOD1 protein levels and SOD activity. Representative immunoblot (A) and densitometric analysis (B) of catalase levels in C33A cells 48 hours after transfection with HA-tagged HPV16 E7, HIS-tagged HPV18 E7 or control pcDNA3 plasmids. Catalase enzymatic activity in cells harbouring HPV E7 oncoproteins (C). Representative immunoblot of SOD1 and SOD2 (D, F) and respective densitometric analysis (E, G) in C33A transfected cells. Glyceraldehyde 3 phosphate dehydrogenase (GAPDH) was used as a loading control. SOD enzymatic activity in C33A transfected cells is shown (H). Data is expressed as the mean±SD, Tukey's test *p<005, **p<0.005 and ***p<0.005 vs pcDNA3 control (pcDNA3). n=3.
Human papillomavirus (HPV) E7 oncoproteins do not alter phospho-histone 2 AX (γH2AX) protein levels. Representative immunoblot of total H2AX and γH2AX (A) and densitometric analysis (B) of the ratio γH2AX/H2AX in C33A cells 48 h post-transfection. Glyceraldehyde 3 phosphate dehydrogenase (GAPDH) was used as a loading control. Data are expressed as the ratio of relative units between γH2AX and H2AX. Data are presented as the mean±SD, n=3.
Human papillomavirus (HPV) E6/E7 co-expressed oncoproteins do not alter the production of reactive oxygen species (ROS) neither GSH levels in C33A cells. Representative images (A) and quantitative data (B) of ROS levels in HPV16 E6/E7, HPV18 E6/E7 and control pcDNA3 transfected cells. GSH levels were not altered in the presence of E6/E7 oncoproteins from HPV16 and 18 (C). C33A viability is similar in cells expressing E6/E7 oncoproteins in comparison with cells transfected with the control vector (D). Data are presented as the mean±SD, n=3.
The combined expression of E1 and E2 proteins induces DNA damage
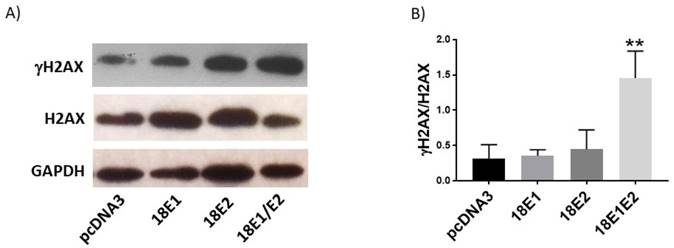
Finally, we evaluated whether E1, E2 or E1/E2 protein expression could induce DNA damage, as measured through the γH2AX levels. We found that only the combined expression of E1 and E2 increased the ratio of γH2AX/H2AX (4.3-fold) above the control cells (Fig. 12A, B).
Discussion
Oxidative stress has been proposed as a critical factor in triggering cervical cancer due to DNA damage induced by different reactive species, which increases the probability to produce HPV genome integration [36], frequently resulting in a disruption of the E2 open reading frame and subsequent over-expression of the E6 and E7 oncoproteins [37]. Therefore, the mechanism by which OS probably induces the integration of the HPV genome into the cellular genome is now a subject of investigation. To determine whether HPV E6, E7, E1 and E2 early expressed proteins modulate cellular redox state and its implication in DNA damage, we conducted a series of experiments to measure the impact of these proteins in redox regulation.
It was demonstrated that E6 from HR-HPV increased ROS production. ROS production begins when O2 is reduced to O2.- by different cellular processes, becoming poisonous when it accumulates in the cells. Consequently, cells express antioxidant enzymes, such as SOD1/2 and catalase, glutathione peroxidase (GPx) and thioredoxin (TRx), and non-enzymatic antioxidants, such as glutathione and vitamins (A, C, E), which represent the whole antioxidant barrier [15]. In this study, we found a GSH depletion associated to ROS increase in the presence of E6. This condition could involve the regulation of catalase or SOD, which are potent antioxidant enzymes regulating OS. We demonstrated that catalase levels decreased in the presence of E6 from HR-HPV. Considering that enzyme levels do not necessarily reflect its antioxidant activity, we measured catalase activity in the presence of E6, finding a decrease due to this oncoprotein. One possible explanation of such catalase down-regulation could be an effect of epigenetic changes, such as the modulation of miRNAs by E6 oncoprotein [38, 39], although further studies are needed to determine the mechanisms by which HPV proteins modulate the redox state.
Human papillomavirus (HPV) E6/E7 co-expressed oncoproteins decrease SOD1 protein levels and SOD activity. Representative immunoblot (A) and densitometric analysis (B) of catalase in C33A cells. Catalase enzymatic activity in transfected cells (C). Immunoblot and densitometric analysis of SOD1 (D, E) and SOD2 (F, G). SOD enzymatic activity (H) in C33A transfected cells. Glyceraldehyde 3 phosphate dehydrogenase (GAPDH) was used as a loading control. Data are presented as the mean±SD, Tukey's test *p<0.05 and **p<0.005 vs control (p3X), n=3.
Human papillomavirus (HPV) E6/E7 co-expressed oncoproteins do not affect DNA integrity in C33A cells. Immunoblot of γH2AX, H2AX (A) and densitometric analysis (B) of γH2AX in relation to H2AX. Glyceraldehyde 3 phosphate dehydrogenase (GAPDH) was used as a loading control. Data are expressed as the ratio of relative units between γH2AX and H2AX. Data are presented as the mean±SD, n=3.
Human papillomavirus (HPV) E1/E2 proteins increase the production reactive oxygen species (ROS), while GSH is decreased in the presence of E1, E2 or E1/E2 in C33A transfected cells. Representative images (A) and quantitative data (B) of ROS levels in cells transfected with HPV18 E1, HPV18 E2, HPV18 E1/E2 or pcDNA3 control. Quantitative data were obtained at 48 h post-transfection. The mean intensity of ethidium fluorescence was measured in 16 different fields per well per condition using Gen5TM 3.0 software for image acquisition and quantification. Presence of GSH (C) and viability (D) in C33 transfected cells. Data are expressed as the mean±SD. Tukey's test *p<0.05 and **p<0.005 vs control (pcDNA3). n=3.
In contrast, SOD1/2 levels or activity were not modified by E6. Some reports have shown that HPV16 E6*, a spliced isoform of E6, increases ROS and DNA damage in the osteosarcoma derived cell line U-2 OS, associated to a decrease in SOD2 protein levels [19]. In the present study, no changes were found in SOD1 or SOD2 protein levels and activity when E6 proteins from both HPV types were ectopically expressed. It should be considered that when wild type E6 is expressed, both full-length E6 and E6* are produced, making it possible that independent effects of E6* could be hidden in the presence of full-length E6.
It is well known that persistent ROS levels promote double-stranded DNA breakdown [31]; therefore, we sought to determine the effect of E6 on γH2AX, a proficient biomarker for DNA damage [32]. Our data showed that E6 from both viral types increased γH2AX, suggesting that the effect exerted by E6 on DNA damage is somehow due to a reduction in catalase levels and activity, resulting in an increase in ROS.
In contrast to E6, we found that E7 from HPV16 and 18 decreased ROS, which was associated with an increase in the levels and enzymatic activity of catalase. Our results agree with those reported by Shim et al. [33], who showed a similar effect for HPV16 E7 in HaCaT cells, an immortalized keratinocyte cell model. Moreover, we also found that the presence of E7 decreased OS, avoiding DNA damage, as could be reflected by the γH2AX marker (Figure 6).
Interestingly the co-expression of E6 and E7 did not change ROS levels nor induced DNA damage. Regarding the tested antioxidant enzymes, the individual effect of E6 oncoprotein on catalase seems to be neutralized by E7. Since the combined expression of E6/E7 exclusively decreased SOD1, but not SOD2 levels, it is possible that the reduction in SOD activity is exclusively related to SOD1, as seen in Figure 5. These pieces of evidence suggest that the DNA damage induced by E6 is somehow avoided by the protective effect granted by E7. In contrast to the data obtained by Marrullo and co-workers in a head and neck cancer model [20], we did not find an increase in OS or evidence of DNA damage when both, E6 and E7 proteins, were expressed. It is possible that the cellular context used in this study somehow influences the different actions for E6 and E7 oncoproteins. Indeed, in this work C33A cells were used, which are characterized by a p53 protein mutated in its DNA binding motif, thus lacking its transcriptional functions [22]. It is worth to notice that Shim et al. also found an increase in catalase levels due to E7, when using a p53 mutated model [33, 40]. Thus, it is possible that our findings might be p53-independent; although different effects of the HPV proteins, regarding cellular redox, could be found in distinct cell contexts, including a functional p53, which deserves further studies.
Human papillomavirus (HPV) E1, E2 and E1/E2 increase catalase activity, while SOD1 and SOD2 protein levels and SOD activity decrease. Representative immunoblot (A) and densitometric analysis (B) of catalase levels in C33 cells transfected with HA-tagged HPV18 E1, HPV18 E2, HPV 18 E1/E2 or control pcDNA3 plasmids 48 hours after transfection. Catalase enzymatic activity in C33A transfected cells (C). Representative immunoblot of SOD1 (D) and SOD2 (F) and densitometric analysis of SOD1 (E) and SOD2 (G) levels in C33 cells transfected with HA-tagged HPV18 E1, HPV18 E2, HPV 18 E1/E2 or control pcDNA3 plasmids. Glyceraldehyde 3 phosphate dehydrogenase (GAPDH) was used as a loading control. SOD enzymatic activity in C33A transfected cells (H). Data are presented as mean±SD. *p<0.05, **p<0.005, and ***p<0.0005 vs control (pcDNA3). n=3.
Human papillomavirus (HPV) 18 E1/E2 promote DNA damage in C33A transfected cells. Representative immunoblot (A) and densitometric analysis (B) of γH2AX and H2AX proteins. Glyceraldehyde 3 phosphate dehydrogenase (GAPDH) was used as a loading control. Data are expressed as the ratio of relative units between γH2AX and H2AX at 48 hours post transfection and presented as the mean±SD, Tukey's test **p<0.005 vs pcDNA3 control. n=3.
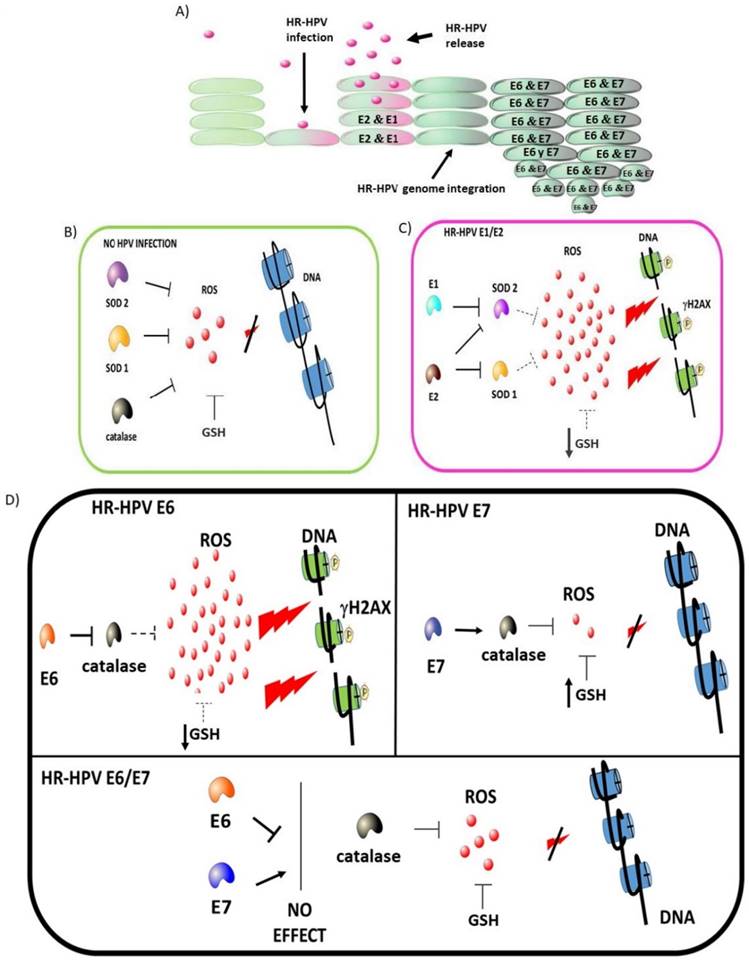
High-risk human papillomavirus (HR-HPV) early expressed proteins differentially modulate the redox state. HPV infects epithelial cells, inducing genome replication and virion production as part of the viral life cycle. High levels of E1 and E2 proteins are expressed during the early stages of an HPV infection. Once integration occurs, E6 and E7 accumulate with the subsequent cellular changes driving to cancer development (A). In non-infected cells, ROS production is controlled by GSH, SOD1/2 and catalase avoiding DNA damage (B). In HPV-infected cells, E1 plus E2 decrease SOD 1/2 expression (dot line), increasing ROS, which is associated to a depletion in GSH and the induction of DNA damage (C). In HPV-transformed cells, the E6 oncoprotein increases the levels of ROS and induces DNA damage by decreasing GSH and catalase. In contrast, the E7 oncoprotein decreases ROS levels due to the increase of catalase and GSH, while DNA damage is not induced. Meanwhile, in the presence of both E6 and E7 oncoproteins, the effect of E7 avoids the E6-driven DNA damage (D).
Additionally, we determined the influence of E1 and E2 proteins on cellular redox state. Lai et al. [21] showed that the E2 from HPV18 induced ROS in HaCaT cells, with no apoptotic effect, which was associated to a modification of the mitochondrial crests. In agreement with such data, we found that E2 from HPV18 did not affect cell viability, while an increase in ROS generation in C33A cells was promoted. Moreover, HPV18 E1 plus E2 increased ROS production, while E1 separately did not. The observed increase in ROS levels could be due to the action of E2 protein on the mitochondrial crests as well as to the modulation of SOD1/2 levels and activity, as we found. The SOD1 levels only decreased in the presence of E2 and E1/E2, but not with E1 alone. Furthermore, we found that E1 and E2 alone or together increased catalase activity. It is feasible that the increase in ROS found in the presence of E2 and E1/E2 is mainly due to the ability of E2 to induce modifications in mitochondrial crests along with a decrease in SOD activity. Moreover, the increase in ROS was associated with DNA damage only in E1/E2 co-expressing cells, indicating an additive effect of both proteins. Our results are consistent with Sakakibara et al. [41], who demonstrated that E1 plus E2 induce DNA damage, in foci that possibly represent viral replication factories. Nevertheless, it is still necessary to determine whether the increase in ROS induced by E1 and E2 is implicated in the viral replication process.
The increase in OS and DNA damage in C33A cells due to E1/E2 could resemble the results obtained by De Marco et al. [42] and Visalli et al. [43], who demonstrated the presence of high levels of ROS and DNA damage in dysplastic tissues, where it is known that E1 and E2 are highly expressed. Our results also show that the co-expression of E6/E7 oncogenes produced a balance in the redox state, which could partially explain the reduction of ROS with no DNA damage in cancer tissues, where E6 and E7 are overexpressed. Our data suggest that the early expressed HPV proteins tightly regulate OS, which could be a critical event in the establishment of an HPV persistent infection and/or in the development of cervical cancer.
In summary, this study shows that E1, E2, E6 and E7 early-expressed proteins from HR-HPV differentially modulate ROS production and DNA damage, which is due in part to the antioxidant modulation exerted by GSH, SOD1, SOD2 and catalase, impacting in the cellular redox state, which could influence the outcome of an HPV infection. Figure 13 shows a proposed model for the role of the early expressed HPV proteins on the modulation on cellular redox state.
Acknowledgements
This research was partially supported by CONACyT grant 261499, PAPIIT-UNAM grant IN206214 and Instituto Nacional de Cancerología, México. Alfredo Cruz-Gregorio is a Ph.D. student from Programa de Maestría y Doctorado en Ciencias Bioquímicas, Facultad de Química, Universidad Nacional Autónoma de México, and wants to thank CONACyT for supporting his Ph.D. studies 240039 and PAEP-UNAM.
Author contributions
All of the authors listed made substantial contributions to the manuscript and qualify for authorship, and no authors have been omitted. Conception and design: Marcela Lizano; development of methodology and acquisition of data: Alfredo Cruz-Gregorio, María Cecilia González-García, Omar Noel Medina-Campos, María Alexandra Rodríguez-Sastre; analysis and interpretation of data: Alfredo Cruz-Gregorio, Joaquín Manzo-Merino, Marcela Lizano, Mahara Valverde, Emilio Rojas; writing and revision of the manuscript: Alfredo Cruz-Gregorio, Marcela Lizano, Joaquín Manzo-Merino, José Pedraza-Chaverri, María Alexandra Rodríguez-Sastre, Claudia María García-Cuéllar.
Competing Interests
The authors have declared that no competing interest exists.
References
1. Walboomers JM, Jacobs MV, Manos MM. et al. Human papillomavirus is a necessary cause of invasive cervical cancer worldwide. J Pathol. 1999;189(1):12-9
2. Burd EM. Human papillomavirus and cervical cancer. Clin Microbiol Rev. 2003;16(1):1-17
3. Boyer SN, Wazer DE, Band V. E7 protein of human papilloma virus-16 induces degradation of retinoblastoma protein through the ubiquitin-proteasome pathway. Cancer Res. 1996;56(20):4620-4
4. Thomas M, Pim D, Banks L. The role of the E6-p53 interaction in the molecular pathogenesis of HPV. Oncogene. 1999;18(53):7690-700
5. Thierry F. Transcriptional regulation of the papillomavirus oncogenes by cellular and viral transcription factors in cervical carcinoma. Virology. 2009;384(2):375-9
6. Badaracco G, Venuti A, Sedati A. et al. HPV16 and HPV18 in genital tumors: significantly different levels of viral integration and correlation to tumor invasiveness. J Med Virol. 2002;67(4):574-82
7. Romanczuk H, Howley PM. Disruption of either the E1 or the E2 regulatory gene of human papillomavirus type 16 increases viral immortalization capacity. Proc Natl Acad Sci USA. 1992;89(7):3159-63
8. Bergvall M, Melendy T, Archambault J. The E1 proteins. Virology. 2013;445(1-2):35-56
9. McBride AA. The papillomavirus E2 proteins. Virology. 2013;445(1-2):57-79
10. Desaintes C, Demeret C, Goyat S. et al. Expression of the papillomavirus E2 protein in HeLa cells leads to apoptosis. EMBO J. 1997;16(3):504-14
11. Pfefferle R, Marcuzzi GP, Akgül B. et al. The human papillomavirus type 8 E2 protein induces skin tumors in transgenic mice. J Invest Dermatol. 2008;128(9):2310-5
12. Castellsagué X, Bosch FX, Muñoz N. Environmental co-factors in HPV carcinogenesis. Virus Res. 2002;89(2):191-9
13. Foppoli C, De Marco F, Cini C. et al. Redox control of viral carcinogenesis: The human papillomavirus paradigm. Biochim Biophys Acta. 2015;1850(8):1622-32
14. Darr D, Fridovich I. Free radicals in cutaneous biology. J Invest Dermatol. 1994;102(5):671-5
15. Valko M, Leibfritz D, Moncol J. et al. Free radicals and antioxidants in normal physiological functions and human disease. Int J Biochem Cell Biol. 2007;39(1):44-84
16. Cadenas E. Basic mechanisms of antioxidant activity. Biofactors. 1997;6(4):391-7
17. Doorbar J, Quint W, Banks L. et al. The biology and life-cycle of human papillomaviruses. Vaccine. 2012:30 S:F55-70
18. Shim JH, Kim KH, Cho YS. et al. Protective effect of oxidative stress in HaCaT keratinocytes expressing E7 oncogene. Amino Acids. 2008;34(1):135-41
19. Williams VM, Filippova M, Filippov V. et al. Human papillomavirus type 16 E6* induces oxidative stress and DNA damage. J Virol. 2014;88(12):6751-61
20. Marullo R, Werner E, Zhang H. et al. HPV16 E6 and E7 proteins induce a chronic oxidative stress response via NOX2 that causes genomic instability and increased susceptibility to DNA damage in head and neck cancer cells. Carcinogenesis. 2015;36(11):1397-406
21. Lai D, Tan CL, Gunaratne J. et al. Localization of HPV-18 E2 at mitochondrial membranes induces ROS release and modulates host cell metabolism. PLoS One. 2013;8(9):e75625
22. Crook T, Wrede D, Vousden KH. p53 point mutation in HPV negative human cervical carcinoma cell lines. Oncogene. 1991;6(5):873-5
23. Hwang SG, Lee D, Kim J. et al. Human papillomavirus type 16 E7 binds to E2F1 and activates E2F1-driven transcription in a retinoblastoma protein-independent manner. J Biol Chem. 2002;277(4):2923-30
24. Vaisman CE, Bonilla-Moreno R, Villegas-Sepúlveda N. Analysis of the Expression of E6^E7, a Short Splicing Variant of HPV-16-E6 in the HPV Negative Cervical Carcinoma Cells C33-A. FASEB J. 2017 no. 1 Supplement lb163
25. Pedraza-Chaverrí J, Reyes-Fermín LM, Nolasco-Amaya EG. et al. ROS scavenging capacity and neuroprotective effect of alpha-mangostin against 3-nitropropionic acid in cerebellar granule neurons. Exp Toxicol Pathol. 2009;61(5):491-501
26. Zielonka J, Kalyanaraman B. Hydroethidine- and MitoSOX-derived red fluorescence is not a reliable indicator of intracellular superoxide formation: another inconvenient truth. Free Radic Biol Med. 2010;48(8):983-1001
27. Kalyanaraman B, Dranka BP, Hardy M. et al. HPLC-based monitoring of products formed from hydroethidine-based fluorogenic probes—the ultimate approach for intra- and extracellular superoxide detection. Biochim Biophys Acta. 2014;1840(2):739-44
28. Rahman I, Kode A, Biswas SK. Assay for quantitative determination of glutathione and glutathione disulfide levels using enzymatic recycling method. Nat Protoc. 2006;1(6):3159-65
29. Molina-Jijón E, Zarco-Márquez G, Medina-Campos ON. et al. Deferoxamine pretreatment prevents Cr(VI)-induced nephrotoxicity and oxidant stress: role of Cr(VI) chelation. Toxicology. 2012;291(1-3):93-101
30. Aebi H. Catalase in vitro. Methods Enzymol. 1984;105:121-6
31. Liou GY, Storz P. Reactive oxygen species in cancer. Free Radic Res. 2010;44(5):479-96
32. Kuo LJ, Yang LX. Gamma-H2AX - a novel biomarker for DNA double-strand breaks. In Vivo. 2008;22(3):305-9
33. Shim JH, Cho KJ, Lee KA. et al. E7-expressing HaCaT keratinocyte cells are resistant to oxidative stress-induced cell death via the induction of catalase. Proteomics. 2005;5(8):2112-22
34. Tang S, Tao M, McCoy JP Jr. et al. The E7 oncoprotein is translated from spliced E6*I transcripts in high-risk human papillomavirus type 16- or type 18-positive cervical cancer cell lines via translation reinitiation. J Virol. 2006;80(9):4249-63
35. de Villiers EM, Fauquet C, Broker TR. et al. Classification of papillomaviruses. Virology. 2004;324(1):17-27
36. De Marco F. Oxidative stress and HPV carcinogenesis. Viruses. 2013;5(2):708-31
37. Moody CA, Laimins LA. Human papillomavirus oncoproteins: pathways to transformation. Nat Rev Cancer. 2010;10(8):550-60
38. Chiantore MV, Mangino G, Iuliano M. et al. Human papillomavirus E6 and E7 oncoproteins affect the expression of cancer-related microRNAs: additional evidence in HPV-induced tumorigenesis. J Cancer Res Clin Oncol. 2016;142(8):1751-63
39. Gómez-Gómez Y, Organista-Nava J, Gariglio P. Deregulation of the miRNAs expression in cervical cancer: human papillomavirus implications. Biomed Res Int. 2013;2013:407052
40. Lehman TA, Modali R, Boukamp P. et al. p53 mutations in human immortalized epithelial cell lines. Carcinogenesis. 1993;14(5):833-9
41. Sakakibara N, Mitra R, McBride AA. The papillomavirus E1 helicase activates a cellular DNA damage response in viral replication foci. J Virol. 2011;85(17):8981-95
42. De Marco F, Bucaj E, Foppoli C. et al. Oxidative stress in HPV-driven viral carcinogenesis: redox proteomics analysis of HPV-16 dysplastic and neoplastic tissues. PLoS One. 2012;7(3):e34366
43. Visalli G, Riso R, Facciolà A. et al. Higher levels of oxidative DNA damage in cervical cells are correlated with the grade of dysplasia and HPV infection. J Med Virol. 2016;88(2):336-44
Author contact
![]() Corresponding author: E-Mail: lizanomx; Tel.: +52-555-628-0400 (ext. 31035)
Corresponding author: E-Mail: lizanomx; Tel.: +52-555-628-0400 (ext. 31035)

 Global reach, higher impact