Impact Factor ISSN: 1449-2288

 Global reach, higher impact
Int J Biol Sci 2018; 14(8):858-862. doi:10.7150/ijbs.24581 This issue Cite
Research Paper
CRISPRMatch: An Automatic Calculation and Visualization Tool for High-throughput CRISPR Genome-editing Data Analysis
Qi You1,3, Zhaohui Zhong2, Qiurong Ren2, Fakhrul Hassan2, Yong Zhang2 ![]() , Tao Zhang1,3
, Tao Zhang1,3 ![]()
1. Jiangsu Key Laboratory of Crop Genetics and Physiology, Co-Innovation Centre for Modern Production Technology of Grain Crops, Key Laboratory of Plant Functional Genomics of the Ministry of Education, Yangzhou University, Yangzhou 225009, China
2. Department of Biotechnology, School of Life Science and Technology, Centre for Informational Biology, University of Electronic Science and Technology of China, Chengdu 610054, China.
3. Joint International Research Laboratory of Agriculture and Agri-Product Safety, the Ministry of Education of China, Yangzhou University, Yangzhou 225009, China
Received 2017-12-26; Accepted 2018-2-28; Published 2018-5-22
Abstract

Custom-designed nucleases, including CRISPR-Cas9 and CRISPR-Cpf1, are widely used to realize the precise genome editing. The high-coverage, low-cost and quantifiability make high-throughput sequencing (NGS) to be an effective method to assess the efficiency of custom-designed nucleases. However, contrast to standardized transcriptome protocol, the NGS data lacks a user-friendly pipeline connecting different tools that can automatically calculate mutation, evaluate editing efficiency and realize in a more comprehensive dataset that can be visualized. Here, we have developed an automatic stand-alone toolkit based on python script, namely CRISPRMatch, to process the high-throughput genome-editing data of CRISPR nuclease transformed protoplasts by integrating analysis steps like mapping reads and normalizing reads count, calculating mutation frequency (deletion and insertion), evaluating efficiency and accuracy of genome-editing, and visualizing the results (tables and figures). Both of CRISPR-Cas9 and CRISPR-Cpf1 nucleases are supported by CRISPRMatch toolkit and the integrated code has been released on GitHub (
Keywords: CRISPR, NGS data, automatic pipeline, mutation calculation, genome-editing efficiency
Introduction
Custom-designed nucleases can execute the targeted gene knock-out by creating mutations (insertion, deletion and replacement) at the double-strand DNA breaks (DSBs) site [1, 2]. Due to the efficient modification of target DNA, the nuclease tools such as Zinc finger proteins (ZNFs), transcription activator-like effector nucleases (TALENs) and clustered regularly interspaced short palindromic repeats (CRISPR) reagents were the popular genome-editing approaches in various organisms [3-6]. Compared with ZNFs and TALENs, CRISPR-associated protein (Cas) system (CRISPR-Cas) possesses better specificity in target locus by using RNA guided nucleases and owns advantages comprising target design optimization, super-efficiency and multiplexed gene editing at one time. As a revolutionary genome-editing tool [5, 8], CRISPR-Cas has been widely used in the genetic manipulation, such as disease treatment and crop breading. At present, CRISPR-Cas9 system with a canonical G-rich form 5'-NGG-3' of protospacer adjacent motif (PAM) and CRISPR-Cpf1 system with a T-rich PAM at the 5'-site of the protospacer are the major genome editing toolbox [9-11].
Due to the cost-effective, high-coverage and precise-quantification advantages, high-throughput sequencing method has been used for screening genome-editing results caused by CRISPR nuclease [12, 13], which leads to a dramatic increase in accumulation of edited genomic DNA high-throughput screens [14]. In response, several bioinformatics tools became available to the next generation sequencing (NGS) CRISPR screening or analysis. Notable among these are GenomeCRISPR [15], CRISPRcloud [16] and Cpf1-Database [17] which are web-platforms for visualization and analysis of the pooled screening data, and CRISPR-DAV [18], CRISPR-GA [19], CRISPResso [20], BATCH-GE [21] and Cas-analyzer [22] are as stand-alone softwares for CRISPR genome editing experiments analysis. However, limitations are existed among these tools. For example, web-platforms lack analysis of batch samples; NGS CRISPR-Cas9 and CRISPR-Cpf1 data cannot be processed and compared at one time; Efficiency of mutations and accuracy evaluation of genome-editing experiments are not summarized and well-visualized. In addition, NGS mutagenesis acquired by transformed protoplasts has become a fast method to evaluate genome-editing efficiency and accuracy. In previous works, Tang et al [13, 23] developed efficient CRISPR genome-editing systems in which constructs were transformed into plant protoplasts and mutagenesis were assessed by NGS technology conveniently. That strategy enables us to quickly evaluate the targeted mutation efficiency of DNA endonucleases. However, contrast to standardized transcriptome protocol [24, 25], the high-throughput edited genome sequencing data is difficult to calculate mutations and display results without an appropriate pipeline connecting different tools that can automatically calculate mutations and result in a more organized dataset which can be properly visualized.
Here, we have developed an automatic stand-alone toolkit using python script, namely CRISPRMatch, a new platform integrating analysis steps like NGS reads mapping, reads count normalization, mutation frequency (deletion and insertion) calculation, genome-editing efficiency statistics at each position of target region, and results multiform expression. After installing a couple of independent packages, CRISPRMatch can analyze a series of CRISPR-Cas9 or CRISPR-Cpf1 NGS samples and compare the efficiency and accuracy of genome-editing endonucleases at one time. These packages including BWA (Burrows-Wheeler Aligner) [26], SAMtools [27] and Picard are applied for mapping reads and mutation calling). Pysam [27] is assisted in reads classification, indels detection and mutation calculation. Matplotlibs [28] is used for improved views of reads alignment mutation details at each position, and genome-editing efficiency statistics among target regions. We then validate CRISPRMatch's ability to perform both CRISPR-Cas9 and CRISPR-Cpf1 NGS samples by inputting some certain simple files. As expected, it automatically output a set of charts, figures and tables, on which we evaluate the benefits of using CRISPRMatch to result expression, detailed mutation visualization, genome-editing efficiency evaluation and checking.
Results
CRISPRMatch Implementation
CRISPRMatch was designed to realize the strategy used in our previous Cpf1 work [13] by integrating analysis steps like mapping reads, calculating mutation frequency (deletion and insertion), evaluating accuracy and efficiency of genome-editing systems, and outputting (tables and figures) visualization. The NGS mutagenesis were accessed from transformed rice protoplasts, which enabled obtaining genome-editing data and testing mutation generation efficiency of different CRISPR editing systems quickly.
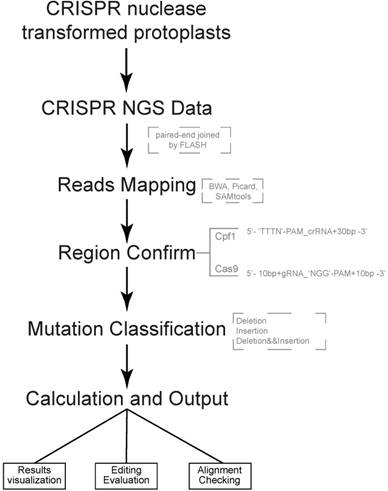
Both of CRISPR-Cas9 and CRISPR-Cpf1 nucleases are supported by CRISPRMatch toolkit. The integrated pipeline, including data processing, analyzing and outputting are executed automatically (Fig 1). First, paired-end sequencing reads were preferred and must to be joined by FLASH (http://ccb.jhu.edu/software/FLASH/) to become single long reads. The joined reads were mapped to target editing region by applying BWA software with default parameters. Alignment files were sorted and made index by Picard and SAMtools. Second, genome-editing system types and target regions for mutation calculation were confirmed. Based on characteristics of each sequence-specific CRISPR system, we manually defined two cleavage regions of the endonucleases. For Cas9, the region (5'-3') covered 10 base pair upstream, guide RNA (gRNA) and 'NGG' PAM, protospacer adjacent motif (PAM), and 10 base pair downstream. For Cpf1, the region (5'-3') covered 'TTTN' PAM, CRISPR RNA (crRNA) and 30 base pair downstream. Third, different types of mutation, including deletion and insertion were detected by Pysam package in each mapped read. Here, a rule was set to define the mutation type of a read: the read was classified into deletion group when deletion type existed; when only insertion existed or insertion and replacement existed together, the read was classified into insertion group when insertion type existed; the read belonged to insertion and deletion group when both mutation types existed. Thus, the reads, which coming from genome-editing region, were divided into three type mutations for frequency calculation, including reads with deletion only, reads with insertion only, reads with both deletion and insertion (Fig. 2A). Considering the depth of NGS, mapped read count of each sample was normalized to one million and the mutation frequency stand for the number of reads with mutation per million. Last, summaries of mutation frequency and details of genome-editing efficiency in each position were plotted by matplotlib package.
Pipeline of CRISPRMatch Several steps are involved, including building genome (target genes) index, deep sequencing reads mapping (Paired-end sequencing reads were joined to single long reads by FLASH), mutation detecting (three types: deletion, insertion, deletion and insertion), efficiency calculation and results export. Here, softwares like BWA, Picard and SAMtools were used for reads mapping. Two cleavage regions of the endonucleases were defined: For Cas9, the region (5'-3') covered 10 base pair upstream, guide RNA (gRNA) and 'NGG' PAM, protospacer adjacent motif (PAM), and 10 base pair downstream; For Cpf1, the region (5'-3') covered 'TTTN' PAM, CRISPR RNA (crRNA) and 30 base pair downstream.
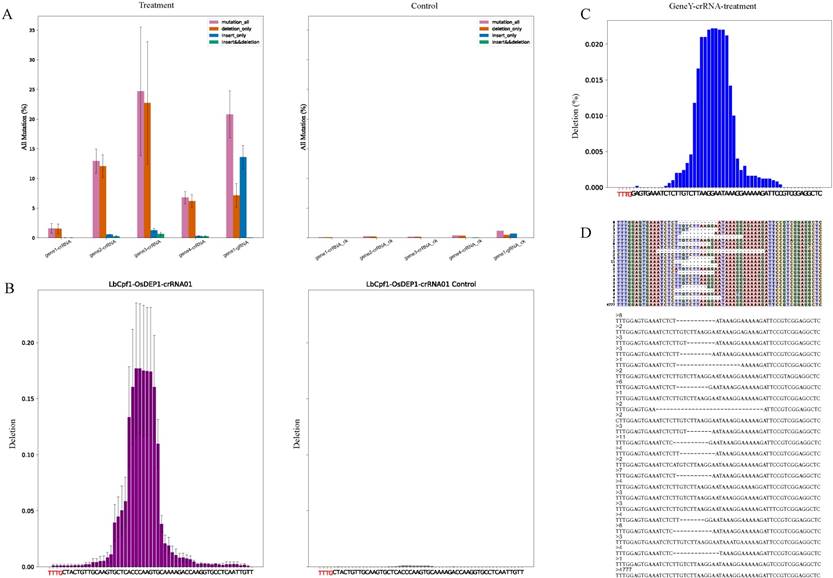
Description of output files (A) The bar charts have summarized the all kinds of mutation between genome-editing data (Treatment) and control data (Control). The purple, orange, blue and green color bars stand for frequency of all mutations, reads with deletion only, reads with insertion only, reads with both deletion and insertion. (B) Summary of deletion among samples in a group. The bar charts display frequency of deletion between a genome-editing sample (LbCpf1-OsDEP1-crRNA01) and the control sample (LbCpf1-OsDEP1-crRNA01 Control). X-axis covers the genome-editing region and labels highlighted with red color are components of the PAM. (C) Deletion frequency of each sequencing sample (sample name” GeneY-crRNA-treatment”). X-axis covers the genome-editing region and labels highlighted with red color are components of the PAM. (D) Alignments result of partial reads (sample name” GeneY-crRNA-treatment”). The colorful matrix (top) distinguishes nuclear acid bases and deletions (marked by “-”) by different colors. Each line stands for the components of a read and the number on left is the count of all reads with the same arrangement. The fasta format (bottom) is another output style of alignment. The numbers stand for counts of the reads below.
Evaluation and checking of genome-editing efficiency
For analysis of results, reads alignment were presented by three formats for clear visualization. First one was to output all reads as fasta format, second one was to make the alignment result of each sample as a matrix and the last one was to plot the matrix with various colors which distinguished mutations directly (Fig. 2D-E). Users can watch a variety of genome-editing results in the target region by different approaches. For example, the fasta format file contained all kinds of genome-editing cases which showed nucleotide composition of each edited read (Fig. 2D), and the colorful matrix summarized mutations (Fig. 2E). Apart from showing alignment result, CRISPRMatch plot the deletion rate at each nucleotide base of each sample (Fig. 2C). Compared to the reference sequence, the positions of deleted bases were counted and frequencies were calculated by Pysam and stand-alone python script. As a result, the frequency plot of deletion (Fig. 2C) was consistent with reads alignment results (Fig. 2D-E). To evaluate the efficiency of genome-editing experiments, the genome-editing samples were compared with the control sample. Considering repetition of genome-editing samples, mean values of the treatments at each position were calculated. For clear visualization, deletion frequency comparison between samples with genome-editing experiment and control samples were displayed together (Fig. 2B). Significantly, differential deletion frequency between treatments and control was obvious and the effective editing region was consistent with previous results [10].
Discussion and conclusion
CRISPRMatch realized an automatic pipeline for analyzing a list of high-throughput CRISPR genome-editing data. Compared to those existing CRISPR analysis tools, CRISPRMactch realized to process batch samples of CRISPR-Cas9 and CRISPR-Cpf1 at one time, detect efficiency of mutations and evaluate accuracy of genome-editing experiments, compare efficiencies of different genome-editing systems, summarize the results by figures and tables. In addition, CRISPRMatch was mainly developed for genome-editing data of CRISPR nuclease transformed protoplasts, which could evaluate the targeted mutation efficiency of DNA endonucleases and regions of guide RNAs quickly. Installation and usage of CRISPRMatch are user-friendly. In our solution, target region sequence, sample information and sequencing data are the only required files in this pipeline. Here, sample information must include sample name, location of PAM and gRNA/crRNA on the target region, relationships between repetition samples and control samples. All output files were text formats or pdf, which were suitable for checking and watching details of genome editing efficiency (examples on GitHub). Based on CRISPRMatch, mutation types including deletion and insertion are mainly detected. But, due to the complexity, replacement frequency just be calculated and provided as a reference value for nuclease efficiency assessing.
In conclusion, CRISPRMatch software realized the effective analysis of NGS genome-editing data from transformed protoplasts by CRISPR system and output mutation results automatically. NGS data of mutagenesis from organisms or individuals are supported as well. The integrated code was released on GitHub (https://github.com/zhangtaolab/CRISPRMatch). The simplicity and applicability of usage made this software suitable for genome engineering field. We hope CRISPRMatch will make a contribution to standard analysis pipeline construction of high-throughput genome-editing data.
Acknowledgements
This work was supported by grants including Jiangsu Specially-Appointed Professor and the Project Funded by the Priority Academic Program Development of Jiangsu Higher Education Institutions (PAPD) to T.Z. and the Sichuan Youth Science and Technology Foundation (2017JQ0005), the National Science Foundation of China (31771486), and the Fundamental Research Funds for the Central Universities (ZYGX2016J119) to Y.Z.
Author Contributions
Y.Z. and T.Z. conceived the project and designed the pipeline. Z. Z. and Q.R. generated all the CRISPR nuclease constructs, performed the transient assays in rice protoplasts and prepared samples for NGS. T.Z. and Q.Y. integrated python code and independent packages. Q.Y., T.Z. and Y.Z. analyzed the NGS data. Q.Y., Y.Z. and T.Z. wrote the paper. All authors read and approved the final manuscript.
Competing Interests
The authors have declared that no competing interest exists.
References
1. Cermak T, Curtin SJ, Gil-Humanes J, Cegan R, Kono TJY, Konecna E. et al. A Multipurpose Toolkit to Enable Advanced Genome Engineering in Plants. Plant Cell. 2017;29:1196-217
2. Li H, Xie K. [Recent progresses in CRISPR genome editing in plants]. Sheng Wu Gong Cheng Xue Bao. 2017;33:1700-11
3. Cermak T, Doyle EL, Christian M, Wang L, Zhang Y, Schmidt C. et al. Efficient design and assembly of custom TALEN and other TAL effector-based constructs for DNA targeting. Nucleic Acids Res. 2011;39:e82
4. Zhang Y, Zhang F, Li X, Baller JA, Qi Y, Starker CG. et al. Transcription activator-like effector nucleases enable efficient plant genome engineering. Plant Physiol. 2013;161:20-7
5. Lowder LG, Zhang D, Baltes NJ, Paul JW 3rd, Tang X, Zheng X. et al. A CRISPR/Cas9 Toolbox for Multiplexed Plant Genome Editing and Transcriptional Regulation. Plant Physiol. 2015;169:971-85
6. Men K, Duan X, He Z, Yang Y, Yao S, Wei Y. CRISPR/Cas9-mediated correction of human genetic disease. Sci China Life Sci. 2017;60:447-57
7. Arora L, Narula A. Gene Editing and Crop Improvement Using CRISPR-Cas9 System. Front Plant Sci. 2017;8:1932
8. Zhou J, Deng K, Cheng Y, Zhong Z, Tian L, Tang X. et al. CRISPR-Cas9 Based Genome Editing Reveals New Insights into MicroRNA Function and Regulation in Rice. Front Plant Sci. 2017;8:1598
9. Bayat H, Modarressi MH, Rahimpour A. The Conspicuity of CRISPR-Cpf1 System as a Significant Breakthrough in Genome Editing. Curr Microbiol. 2017
10. Zetsche B, Gootenberg JS, Abudayyeh OO, Slaymaker IM, Makarova KS, Essletzbichler P. et al. Cpf1 is a single RNA-guided endonuclease of a class 2 CRISPR-Cas system. Cell. 2015;163:759-71
11. Chai G, Yu M, Jiang L, Duan Y, Huang J. HMMCAS: a web tool for the identification and domain annotations of Cas proteins. IEEE/ACM Trans Comput Biol Bioinform. 2017
12. Bell CC, Magor GW, Gillinder KR, Perkins AC. A high-throughput screening strategy for detecting CRISPR-Cas9 induced mutations using next-generation sequencing. BMC Genomics. 2014;15:1002
13. Tang X, Lowder LG, Zhang T, Malzahn AA, Zheng X, Voytas DF. et al. A CRISPR-Cpf1 system for efficient genome editing and transcriptional repression in plants. Nat Plants. 2017;3:17103
14. Shalem O, Sanjana NE, Zhang F. High-throughput functional genomics using CRISPR-Cas9. Nat Rev Genet. 2015;16:299-311
15. Rauscher B, Heigwer F, Breinig M, Winter J, Boutros M. GenomeCRISPR - a database for high-throughput CRISPR/Cas9 screens. Nucleic Acids Res. 2017;45:D679-D86
16. Jeong HH, Kim SY, Rousseaux MWC, Zoghbi HY, Liu Z. CRISPRcloud: a secure cloud-based pipeline for CRISPR pooled screen deconvolution. Bioinformatics. 2017;33:2963-5
17. Park J, Bae S. Cpf1-Database: web-based genome-wide guide RNA library design for gene knockout screens using CRISPR-Cpf1. Bioinformatics. 2017
18. Wang X, Tilford C, Neuhaus I, Mintier G, Guo Q, Feder JN. et al. CRISPR-DAV: CRISPR NGS data analysis and visualization pipeline. Bioinformatics. 2017;33:3811-2
19. Guell M, Yang L, Church GM. Genome editing assessment using CRISPR Genome Analyzer (CRISPR-GA). Bioinformatics. 2014;30:2968-70
20. Pinello L, Canver MC, Hoban MD, Orkin SH, Kohn DB, Bauer DE. et al. Analyzing CRISPR genome-editing experiments with CRISPResso. Nat Biotechnol. 2016;34:695-7
21. Boel A, Steyaert W, De Rocker N, Menten B, Callewaert B, De Paepe A. et al. BATCH-GE: Batch analysis of Next-Generation Sequencing data for genome editing assessment. Sci Rep. 2016;6:30330
22. Park J, Lim K, Kim JS, Bae S. Cas-analyzer: an online tool for assessing genome editing results using NGS data. Bioinformatics. 2017;33:286-8
23. Tang X, Zheng X, Qi Y, Zhang D, Cheng Y, Tang A. et al. A Single Transcript CRISPR-Cas9 System for Efficient Genome Editing in Plants. Mol Plant. 2016;9:1088-91
24. Chen W, Feng P, Tang H, Ding H, Lin H. RAMPred: identifying the N(1)-methyladenosine sites in eukaryotic transcriptomes. Sci Rep. 2016;6:31080
25. Li Y, Heavican TB, Vellichirammal NN, Iqbal J, Guda C. ChimeRScope: a novel alignment-free algorithm for fusion transcript prediction using paired-end RNA-Seq data. Nucleic Acids Res. 2017;45:e120
26. Li H, Durbin R. Fast and accurate short read alignment with Burrows-Wheeler transform. Bioinformatics. 2009;25:1754-60
27. Li H, Handsaker B, Wysoker A, Fennell T, Ruan J, Homer N. et al. The Sequence Alignment/Map format and SAMtools. Bioinformatics. 2009;25:2078-9
28. Hunter JD. Matplotlib: A 2D Graphics Environment. Computing in Science & Engineering. 2007;9:90-5
Author contact
![]() Corresponding authors: Tao Zhang; E-mail: zhangtaoedu.cn; Yong Zhang; E-mail: zhangyong916edu.cn
Corresponding authors: Tao Zhang; E-mail: zhangtaoedu.cn; Yong Zhang; E-mail: zhangyong916edu.cn