Impact Factor ISSN: 1449-2288
- Issue 12; 2026
- Issue 11; 2026
- Issue 10; 2026
- Issue 9; 2026
- Issue 8; 2026
- Volume 22; 2026
- Past Issues
- Advance Articles
- Editorial Board
- Cover Images
- Index & Coverage
- Cover Suggestion
- Special Issues
Introduction
Materials and Methods
Results
Discussion
Abbreviations
Supplementary Material
Acknowledgements
References

 Global reach, higher impact
Int J Biol Sci 2018; 14(8):892-900. doi:10.7150/ijbs.24548 This issue Cite
Research Paper
Identifying differentially expressed genes from cross-site integrated data based on relative expression orderings
Hao Cai1, Xiangyu Li1, Jing Li1, Qirui Liang1, Weicheng Zheng1,3, Qingzhou Guan1, Zheng Guo1,2,3, ![]() , Xianlong Wang1,
, Xianlong Wang1, ![]()
1. Fujian Key Laboratory of Medical Bioinformatics, Key Laboratory of Ministry of Education for Gastrointestinal Cancer, Fujian Medical University, Fuzhou, 350122, China
2. Fujian Key Laboratory of Tumor Microbiology, Fujian Medical University, Fuzhou 350122, China
3. Department of Systems Biology, College of Bioinformatics Science and Technology, Harbin Medical University, Harbin 150086, China
Received 2017-12-25; Accepted 2018-2-2; Published 2018-5-22
Abstract

It is a basic task in high-throughput gene expression profiling studies to identify differentially expressed genes (DEGs) between two phenotypes. But the weakly differential expression signals between two phenotypes are hardly detectable with limited sample sizes. To solve this problem, many researchers tried to combine multiple independent datasets using meta-analysis or batch effect adjustment algorithms. However, these algorithms may distort true biological differences between two phenotypes and introduce unacceptable high false rates, as demonstrated in this study. These problems pose critical obstacles for analyzing the transcriptional data in The Cancer Genome Atlas where there are many small-scale batches of data. Previously, we developed RankComp to detect DEGs for individual disease samples through exploiting the incongruous relative expression orderings between two phenotypes and further improved it here to identify DEGs using multiple independent datasets. We demonstrated the improved RankComp can directly analyze integrated cross-site data to detect DEGs between two phenotypes without the need of batch effect adjustments. Its usage was illustrated in detecting weak differential expression signals of breast cancer drug-response data using combined datasets from multiple experiments.
Keywords: Differentially expressed genes, Relative expression orderings, Batch effect, Drug response
Introduction
Detecting differentially expressed genes (DEGs) between two phenotypes is a basic task in high-throughput biological studies. It is often hard to detect DEGs under the circumstances where the genes are differentially expressed only slightly between two phenotypes. Especially when the sample size is not sufficiently large, detecting enough DEGs for subsequent studies is difficult. Nevertheless, it can often be found multiple datasets with regards to the same biological questions from public repositories such as Gene Expression Omnibus (GEO) [1] and ArrayExpress [2]. A natural solution to raise statistical power is to combine these datasets produced by different laboratories to effectively detect weak biological signals. However, experimental batch effects hinder the direct combination of different datasets [3]. This problem is also a critical obstacle for analyzing transcriptional data in The Cancer Genome Atlas (TCGA) where data scatter over many small-scale batches.
To make the full use of information available from multiple datasets, meta-analysis utilizes statistical techniques to combine results such as p-values [4], effect sizes [5, 6] and ranks [7, 8] obtained from independent studies, but high false-negative rates can arise due to small sample sizes and large scale of heterogeneity [9]. More sophisticated hierarchical Bayesian methods 'borrow' information across all genes to sharpen inferences about which genes are differentially expressed [10-13]. However, the key assumption of hierarchical models tends to introduce biases when estimating the variances of genes [14]. Other researchers considered normalizing data across studies using various batch effect adjustment methods such as DWD [15], PAMR [16], geometric ratio-based method [17], XPN [18], ComBat [19], SVA [20] for microarray data, RUV [21, 22] and svaseq [23] for RNA-sequencing data. However, the normalization of datasets of different batches may distort the true biological signal [24, 25] and even induce spurious group differences, especially when phenotypic groups are not evenly distributed across batches [26, 27].
Recently, based on the finding that the relative expression orderings (REOs) of gene pairs are generally stable in a particular type of normal tissues but widely disrupted in diseased tissues, we have developed an algorithm named RankComp to detect DEGs for individual disease samples by analyzing the disrupted REOs [28]. In this article, we extended the application of RankComp to identify genes that exhibit differential expression patterns between distinct groups. The merits that REOs are insensitive to experimental batch effects [29] and highly consistent across different platforms [30] make RankComp feasible for a cross-study comparison of gene expression.
Materials and Methods
Data and pre-processing
All data used in this study were collected from GEO and TCGA as summarized in Table 1. Each of three cancer types included three cancer-normal datasets for evaluating the performance of RankCompV2. In our examples of application below, we gathered five microarray expression datasets of estrogen receptor (ER) negative and positive breast cancer patients treated with neoadjuvant chemotherapy including paclitaxel, 5-fluorouracil, cyclophosphamide and doxorubicin. Responses to preoperative chemotherapy categorized as a pathological complete response (pCR) or residual invasive cancer (RD) were known for every patient.
Description of the datasets used in this study
| Number | Platforms | #Gene | Control | Case | Control vs. Case | Database |
|---|---|---|---|---|---|---|
| GSE23878 | GPL570a | 20486 | 24 | 35 | Normal vs. COAD | GEO |
| GSE37364 | GPL570 | 20486 | 38 | 27 | Normal vs. COAD | GEO |
| GSE20916 | GPL570 | 20486 | 24 | 45 | Normal vs. COAD | GEO |
| GSE29001 | GPL571b | 12432 | 12 | 12 | Normal vs. ESCC | GEO |
| GSE20347 | GPL571 | 12432 | 17 | 17 | Normal vs. ESCC | GEO |
| GSE38129 | GPL571 | 12432 | 30 | 30 | Normal vs. ESCC | GEO |
| Batch93 | RNASeqV2c | 17618 | 16 | 41 | Normal vs. BRCA | TCGA |
| Batch96 | RNASeqV2 | 17675 | 15 | 41 | Normal vs. BRCA | TCGA |
| Batch109 | RNASeqV2 | 17679 | 15 | 70 | Normal vs. BRCA | TCGA |
| The data of ER positive breast cancer | ||||||
| GSE22093 | GPL96d | 12432 | 10 | 32 | pCR vs. RD | GEO |
| GSE23988 | GPL96 | 12432 | 7 | 24 | pCR vs. RD | GEO |
| GSE42822 | GPL96 | 12432 | 7 | 19 | pCR vs. RD | GEO |
| GSE20271 | GPL96 | 12432 | 6 | 83 | pCR vs. RD | GEO |
| GSE20194T | GPL96 | 12432 | 4 | 61 | pCR vs. RD | GEO |
| The data of ER negative breast cancer | ||||||
| GSE22093 | GPL96 | 12432 | 18 | 37 | pCR vs. RD | GEO |
| GSE23988 | GPL96 | 12432 | 13 | 16 | pCR vs. RD | GEO |
| GSE42822 | GPL96 | 12432 | 13 | 15 | pCR vs. RD | GEO |
| GSE20271 | GPL96 | 12432 | 13 | 50 | pCR vs. RD | GEO |
| GSE20194T | GPL96 | 12432 | 16 | 16 | pCR vs. RD | GEO |
Note: a Affymetrix Human Genome U133 Plus 2.0 Array; b Affymetrix Human Genome U133A 2.0 Array; c UNC IlluminaHiSeq_RNASeqV2; d Affymetrix Human Genome U133A Array Abbreviation: COAD: Colon adenocarcinoma; ESCC: Esophageal squamous cell carcinoma; BRCA, Breast invasive carcinoma; pCR: pathologic complete response; RD, residual disease. GEO: Gene Expression Omnibus; TCGA, The Cancer Genome Atlas.
For each microarray expression dataset, quantile normalized expression data were separately acquired through processing the raw intensity files (.CEL) with the RMA algorithm [31]. With the custom CDF file, each probe set ID was mapped to Gene ID, and then probe sets that mapped to multiple Gene IDs or did not map to any Gene ID were removed. The expression measurements of all probe sets corresponding to the same Gene ID were averaged to obtain a single measurement (on the log2 scale). For each RNA-seq dataset, the RPKM (reads per kilobase of exon model per million mapped reads) [32] values and raw counts were both download from TCGA. After removing genes with a value of 0 in more than 75% of samples, other zero values were filled with the smallest count in the expression data. The Ensembl gene IDs corresponding to the unique Entrez gene IDs of protein coding genes were used. The RPKM values were used in RankCompV2 and the raw counts were the input of RUV and svaseq method. The measured values, such as RPKM [32], FPKM [33] and TPM [34], normalizing both the gene transcription length and the sequencing depth, can represent the actual gene expression abundance and thus can be applied to the REOs-based methods.
The Rank Comp and RankCompV2 algorithm
RankComp was developed for identifying DEGs in individual samples by analyzing the disrupted REOs in the disease samples through comparing with the highly stable normal REOs landscape [28, 30]. In RankCompV2, we identified the stable gene pairs with significantly consistent REOs [30] in a control group and a disease group, respectively. Here, a parameter φ with default value of 5% was used to screen stable REOs. Focusing on the overlaps of the two lists of stable gene pairs, the concordant and the reversal REOs between two groups were identified. Then Fisher's extract test was used to identify candidate DEGs which may disrupt the gene correlation structure.
To minimize the potential effect of other genes' expression changes on the Fisher's exact test for a particular gene, an iterative filter process which is analogous to the strategy used in our previous study [35] was conducted. For each gene after excluding those gene pairs involving the differently expressed partner genes from the concordant and the reversal gene pairs, the Fisher's exact test was performed again until the number of DEGs did not change in two successive iterations. The flow of the algorithm can be found in Figure 1.
A schematic diagram of the RankCompV2 algorithm. Focusing on the overlaps of the two lists of stable gene pairs, the stable REOs in the control samples are defined as the background stable REOs while the reversely stable REOs in the case samples are defined as the reversal REOs of the disease. For a given gene G1, a indicates the number of gene pairs with the REO pattern (G1 > Gi), and b indicates that with (G1 < Gj) in background stable REOs; x indicates the number of reversal gene pairs with shift (G1 < Gj→G1 > Gj) and y indicates the number of reversal gene pairs with shift (G1 > Gi→G1 < Gi) in reversal REOs of the disease [28, 30, 35].
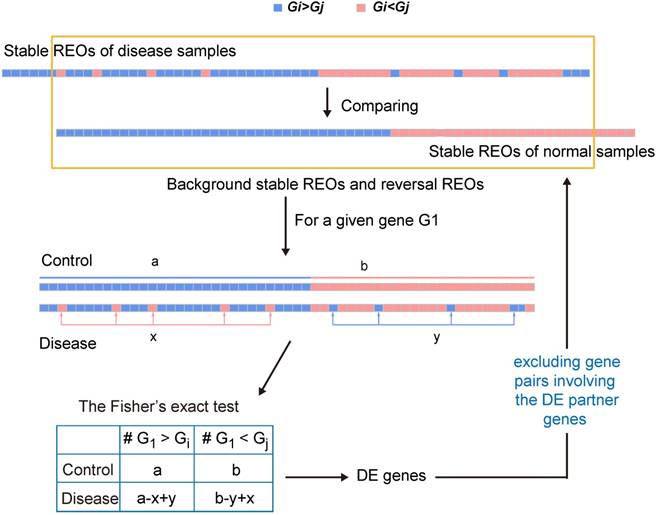
The filter process is the major difference between the RankCompV2 and the RankComp algorithm. Firstly, RankCompV2 excluded gene pairs composed the gene and the potential DEGs in both consistent gene pairs and reversal gene pairs. While RankComp algorithm only excluded gene pairs composed with the gene and those potential DEGs with the opposite dysregulation direction in reversal gene pairs, which may decrease statistical power. Secondly, RankComp performs only one filtering step, which reduces only partially the influence of other genes' expression changes on the Fisher's exact test for a particular gene [35]. RankCompV2 and RankComp are implemented in C language and available at GitHub (https://github.com/pathint/reoa).
Other algorithms
RankProd, a meta-analysis algorithm and available as an R package, was also tested to identify DEGs in merged datasets from different studies [7]. The number of permutations was set to 1000. Genes identified as both up- and down-regulated were deleted. Combat uses an empirical Bayesian framework to remove batch effects from microarray expression data [19]. The algorithm was performed by the sva package in R [20]. The algorithm savseq was also performed with default parameters in the sva package for removing batch effects from sequencing data [23]. The RUVSeq package includes three methods to remove batch effects from RNA-Seq Data. RUVg uses negative control genes, assuming constant expression across different samples, RUVs uses replicate control samples and RUVr uses residuals to normalized RNA-Seq read counts among samples. Here only the RUVr method can be performed.
Pathway enrichment analysis
The gene categories for function enrichment analysis were downloaded from Gene Ontology (GO) [36] in March, 2016. The GO-function algorithm [37] was used to determine the significance of biological pathways, molecular functions, and cellular components enriched with a set of interested genes by hypergeometric distribution test.
Reproducibility evaluation of DEGs
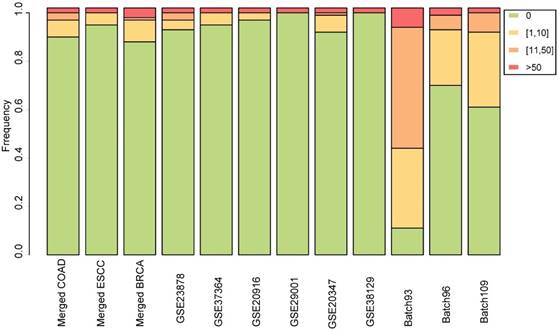
We used the POG (Percentage of Overlapping Genes) score [38, 39] and the concordance score to evaluate the reproducibility of DEGs identified from two independent datasets. If two lists of DEGs with length L1 and L2, have n overlaps, among which s have the same dysregulation directions (up- or down-regulation), then the POG score from list 1 (or 2) to list 2 (or 1), denoted as POG12 (or POG21), is calculated as s/L1 (or s/L2), and the concordance score is calculated as s/n. We evaluated whether a concordance score is higher than what expected by chance using a binomial distribution test as follows,
where p0 (p0=0.05) is the probability of a gene having the concordant dysregulation direction in the two lists by chance.
Results
Performance of RankCompV2 in a single dataset
Three datasets were collected for each of three cancer types (COAD, ESCC and BRCA) to evaluate the performance of RankCompV2 in terms of precision calculated as the concordance score between the identified dysregulation directions and the observed directions based on the average expression values between the cancer and normal samples.
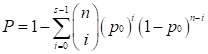
With FDR < 5%, there were 3858, 5067 and 3732 DEGs identified by RankCompV2 in the GSE23878, GSE37364 and GSE20916 datasets of COAD, and the corresponding apparent precisions of these DEGs were 99.97%, 100%, and 100%, respectively (Figure 2A). We also evaluated the reproducibility of these DEGs across datasets. For the three DEG lists, more than 63% DEGs identified in one dataset can be found in another dataset (Supplementary Table S1) and the pair-wise concordance scores are more than 96% (binomial test, p < 1.0E-16). Similar results were observed in datasets of ESCC and BRCA. For ESCC, the DEGs identified from each dataset had a precision of 100%. Not surprisingly, every DEGs lists were highly reproducible (Supplementary Table S1). In three batches of BRCA, RankCompV2 accurately detected DEGs in each dataset with a precision above 97% (Figure 2A), and the concordance scores of every two DEGs lists were 100%. Even 84% DEGs identified in Batch 96 were also identified in Batch 93 (Supplementary Table S1). These results suggest that RankCompV2 can accurately detect DEGs between distinct phenotypic groups in a single dataset.
Performance evaluation of different algorithms. (A) Performance of RankCompV2 in nine datasets; (B) Comparison of the results of RankCompV2 with other algorithms in merged COAD, ESCC and BRCA datasets, respectively.
Comparing RankCompV2 with other approaches in the merged datasets
We further applied RankCompV2 to identify DEGs by merging the three datasets for each cancer. With FDR < 5%, we obtained 5619, 3290 and 7866 DEGs for COAD, ESCC and BRCA, respectively (Figure 2B). It was obvious that combining multiple datasets led to more discoveries of DEGs than a single dataset with the same FDR control. To judge whether these DEGs are truly dysregulated, we compared them with their original dysregulation directions in each dataset. If original dysregulation directions of the DEG are conflicting with each other in the three datasets of the same cancer type, it is high likely that it is a false discovery. We calculate the false rates of the identified DEGs in the merged datasets. Among DEGs identified by RankCompV2, false rates were 10.16%, 2.71% and 8.12% in the COAD, ESCC and BRCA merged datasets, respectively.
For the original RankComp method, only 3526, 1991 and 4061 DEGs were identified with false rates of 6.69%, 1.51% and 3.15% in the COAD, ESCC and BRCA merged datasets, respectively. RankCompV2 substantially improved the statistical power at the cost of a slight decrease in accuracy. Further comparison found all DEGs identified by RankComp were covered by RankCompV2 and the concordance scores of the two lists were all 100% in the three merged datasets.
RankProd performs a meta-analysis on the merged datasets. Compared with RankCompV2, RankProd identified more DEGs (7979) in the COAD merged dataset, but the false rate was up to 18.34%. For the merged datasets of ESCC and BRCA, 4438 and 7633 DEGs were identified with a false rate of 7.86% and 15.98%, respectively. Fewer DEGs accompanied with lower false rates. A special problem of RankProd is that many genes could be identified as both up- and down- regulated DEGs. In our study we had deleted these conflicting DEGs.
Batch effect correction by Combat was performed in the COAD and ESCC merged datasets measured by the microarray platforms. Although the false rate for the merged ESCC dataset was 7.51%, it reached up to 21.48% for the merged COAD dataset. For RNA-Seq data of BRCA, edgeR was performed on the adjusted data to identify DEGs after removing the batch effects by svaseq and RUVr, respectively. In the adjusted BRCA data with svaseq and RUVr, 13300 and 12436 DEGs were identified with a false rate of 10.00% and 4.98%, respectively. All results were summarized in Figure 2B.
All these results indicated RankProd and batch effect removal algorithms likely distort true biological differences between two phenotypes and introduce unacceptable high false rates in some datasets. In contrast, RankCompV2 can detect accurate DEGs in these datasets and it is a good choice for identifying DEGs across different studies.
Simulation experiments on null datasets
Basically, RankCompV2 is an empirical algorithm, where the parameter φ is used in the determination of stable REOs for each group. Simulation experiments on null data were performed to evaluate the false discovery rates of DEGs under the default settings φ = 5%.
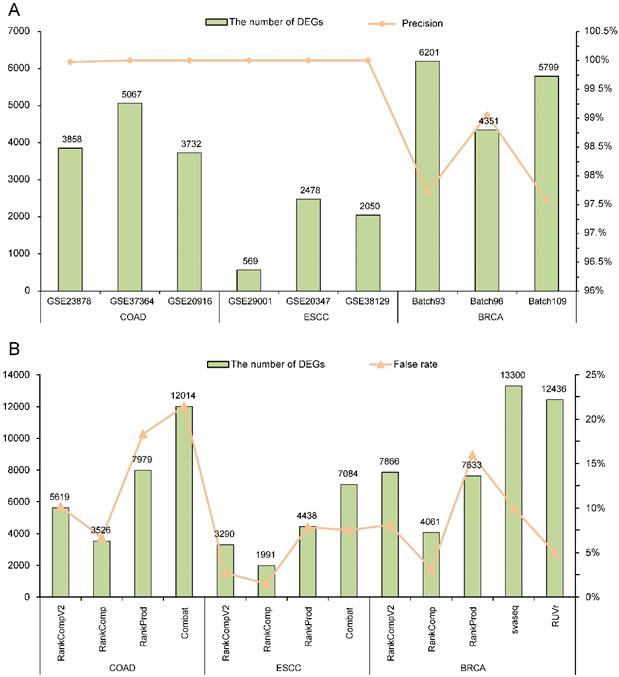
For each dataset, the normal samples were randomly divided into two groups to simulate null datasets, and RankCompV2 was applied to identify DEGs with the default settings. The experiments were repeated 100 times. No DEG was detected in 90, 95 and 88 out of the 100 experiments in the null dataset created from the merged COAD, ESCC and BRCA datasets, respectively. Similar results were observed in the null data simulated from each of the nine single (i.e., non-merged) datasets (Figure 3). The most DEGs identified was in the null data simulated from the Batch 93 dataset where 18 DEGs were found on average but this number was not disastrous compared with 6021 DEGs identified in the real data. The above extensive simulate results indicate that the default parameter setting produce negligible number of false discoveries.
Stacked bar chart for the distribution of the numbers of DEGs identified from the simulated null datasets among 100 repeated experiments.
Application of RankCompV2 to breast cancer drug-response data
To further illustrate the merits of the RankCompV2, five expression datasets of breast cancer patients receiving the neoadjuvant chemotherapy of paclitaxel, 5-fluorouracil, cyclophosphamide and doxorubicin were collected from the GEO database (Table 1). The expression patterns of ER positive and ER negative subtypes were analyzed separately. Limited or even zero DEGs between pCR and RD groups were identified in each dataset by t-test or Limma [40] with FDR< 10% (data not shown).
With RankCompV2 applied to the integrated ER negative dataset, we identified 36 up-regulated and 373 down-regulated genes in the RD group. These 409 DEGs were significantly enriched in 18 biological pathways of GO (Figure 4A, Supplementary Table S2). Most of these pathways were known associated with the chemotherapy resistance including cell cycle, DNA replication and DNA repair related pathways [41-46]. Other pathways were also enriched, including RNA processing, positive regulation of macromolecule biosynthetic process, cellular macromolecular complex assembly, positive regulation of RNA metabolic process and protein-DNA complex subunit organization, and they serve the future research direction for the chemotherapy resistance mechanism of ER negative breast cancer. These 409 DEGs were also significantly enriched in 6 molecular functions (Supplementary Table S3) and 14 cellular components (Supplementary Table S4) of Gene Ontology.
The enriched biological pathways by the DEGs in RD groups.
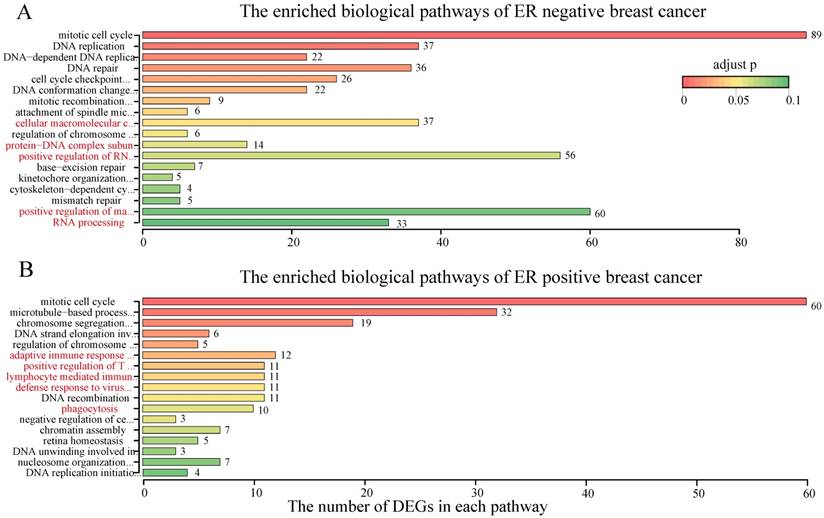
For the ER positive breast cancer, RankCompV2 identified 63 up-regulated and 141 down-regulated genes in the RD group. Only 40 of the 204 DEGs were included in the 409 DEGs of the ER negative dataset. These 204 DEGs were significantly enriched in 17 pathways (Figure 4B, Supplementary Table S2). Besides cell cycle and DNA replication related pathways, immune related pathways including lymphocyte mediated immunity, adaptive immune response based on somatic recombination of immune receptors built from immunoglobulin superfamily domains, positive regulation of T cell activation and defense response to virus were also enriched. Furthermore, the phagocytosis pathway was also significantly enriched. These novel pathways suggest a different resistance mechanism in ER positive breast cancer. Simultaneously, 6 molecular functions (Supplementary Table S3) and 12 cellular components (Supplementary Table S4) of Gene Ontology were enriched with the 204 DEGs.
The two applications demonstrate the power of RankCompV2 in using public data for the discovery of signals that are too weak to be identified in a single experiment.
Discussion
Differing from traditional meta-analysis and batch effect adjustment algorithms, we provided a new perspective for differential expression analysis of merged datasets. The RankCompV2 method, based on the REOs of gene pairs within samples which were insensitive to batch effects and measurement platforms, can enrich DEGs, significantly and accurately, from the integrated cross-site datasets. RankCompV2 is an improved version of the original RankComp. But the validation results suggest that each has its own merits in analyzing the merged datasets. RankComp has a low statistical power but a high accuracy, while RankCompV2 has a higher statistical power but a slightly lower accuracy. For other algorithms, the normalization procedure and the batch effect adjustment algorithms may distort true biological differences between two phenotypes which induce many false discoveries [24-27].
The RankCompV2 method facilitates the analysis of mRNA expression data in TCGA, where each batch has a small sample size and even only one-phenotype data, which cannot be dealt with by other methods. It is valuable to reuse the one-phenotype data, particularly the control datasets, since there lack the control samples in many disease studies, for example normal heart and brain tissues [47, 48].Our laboratory also evaluated the effect of biological factors such as gender, ethnicity, smoking status and age and find that these disease-related confounding factors might have an influence on REOs [49]. When applying the RnankCompV2 to two different groups, it is better to balance the confounding factors between the two groups.
One flaw of RankCompV2 is its low statistical power. On one hand, none of approaches proposed to adjust the P-values for discrete statistics is widely accepted for application [50-55], we used the Benjamini-Hochberg FDR control approach for selecting DEGs tested by the Fisher's exact test, which tends to have insufficient power for discrete data because the null distribution of the p-values of discrete tests is not the uniform distribution required by the BH procedure [50, 56, 57]. Further studies on improving RankCompV2 is a work in progress. On the other hand, the RankCompV2 method tends to identify genes with large expression changes, which could form many reversal gene pairs. Such DEGs can disrupt the gene correlation structure between two phenotypes and might be of special biological significance because functionally related genes tend to express coordinately in a stable physiology or pathology state [24].
Abbreviations
DEGs: differentially expressed genes; GEO: Gene Expression Omnibus; TCGA: The Cancer Genome Atlas; REOs: relative expression orderings; ER: estrogen receptor; pCR: pathological complete response; RD: residual invasive cancer; RPKM: reads per kilobase of exon model per million mapped reads; COAD: Colon adenocarcinoma; ESCC: Esophageal squamous cell carcinoma; BRCA: Breast invasive carcinoma; GO: Gene Ontology.
Supplementary Material
Supplementary tables.
Acknowledgements
This work was supported by the National Natural Science Foundation of China [21534008, 81372213, 81572935, 81602738 and 61602119]; and the Joint Scientific and Technology Innovation Fund of Fujian Province [2016Y9044].
Competing Interests
The authors have declared that no competing interest exists.
References
1. Barrett T, Wilhite SE, Ledoux P, Evangelista C, Kim IF, Tomashevsky M. et al. NCBI GEO: archive for functional genomics data sets-update. Nucleic acids research. 2013;41:D991-5
2. Parkinson H, Kapushesky M, Shojatalab M, Abeygunawardena N, Coulson R, Farne A. et al. ArrayExpress-a public database of microarray experiments and gene expression profiles. Nucleic acids research. 2007;35:D747-50
3. Leek JT, Scharpf RB, Bravo HC, Simcha D, Langmead B, Johnson WE. et al. Tackling the widespread and critical impact of batch effects in high-throughput data. Nature reviews Genetics. 2010;11:733-9
4. Rhodes DR, Barrette TR, Rubin MA, Ghosh D, Chinnaiyan AM. Meta-analysis of microarrays: interstudy validation of gene expression profiles reveals pathway dysregulation in prostate cancer. Cancer research. 2002;62:4427-33
5. Choi JK, Yu U, Kim S, Yoo OJ. Combining multiple microarray studies and modeling interstudy variation. Bioinformatics. 2003;19(Suppl 1):i84-90
6. Hu P, Greenwood CM, Beyene J. Integrative analysis of multiple gene expression profiles with quality-adjusted effect size models. BMC bioinformatics. 2005;6:128
7. Hong F, Breitling R, McEntee CW, Wittner BS, Nemhauser JL, Chory J. RankProd: a bioconductor package for detecting differentially expressed genes in meta-analysis. Bioinformatics. 2006;22:2825-7
8. Zintzaras E, Ioannidis JP. Meta-analysis for ranked discovery datasets: theoretical framework and empirical demonstration for microarrays. Computational biology and chemistry. 2008;32:38-46
9. Cahan P, Rovegno F, Mooney D, Newman JC, St Laurent G 3rd, McCaffrey TA. Meta-analysis of microarray results: challenges, opportunities, and recommendations for standardization. Gene. 2007;401:12-8
10. Conlon EM, Song JJ, Liu JS. Bayesian models for pooling microarray studies with multiple sources of replications. BMC bioinformatics. 2006;7:247
11. Scharpf RB, Tjelmeland H, Parmigiani G, Nobel AB. A Bayesian model for cross-study differential gene expression. Journal of the American Statistical Association. 2009;104:1295-310
12. Ruan L, Yuan M. An empirical Bayes' approach to joint analysis of multiple microarray gene expression studies. Biometrics. 2011;67:1617-26
13. Conlon EM, Postier BL, Methe BA, Nevin KP, Lovley DR. A Bayesian model for pooling gene expression studies that incorporates co-regulation information. PloS one. 2012;7:e52137
14. Li B, Sun Z, He Q, Zhu Y, Qin ZS. Bayesian inference with historical data-based informative priors improves detection of differentially expressed genes. Bioinformatics. 2016;32:682-9
15. Benito M, Parker J, Du Q, Wu J, Xiang D, Perou CM. et al. Adjustment of systematic microarray data biases. Bioinformatics. 2004;20:105-14
16. Sims AH, Smethurst GJ, Hey Y, Okoniewski MJ, Pepper SD, Howell A. et al. The removal of multiplicative, systematic bias allows integration of breast cancer gene expression datasets - improving meta-analysis and prediction of prognosis. BMC medical genomics. 2008;1:42
17. Luo J, Schumacher M, Scherer A, Sanoudou D, Megherbi D, Davison T. et al. A comparison of batch effect removal methods for enhancement of prediction performance using MAQC-II microarray gene expression data. The pharmacogenomics journal. 2010;10:278-91
18. Shabalin AA, Tjelmeland H, Fan C, Perou CM, Nobel AB. Merging two gene-expression studies via cross-platform normalization. Bioinformatics. 2008;24:1154-60
19. Johnson WE, Li C, Rabinovic A. Adjusting batch effects in microarray expression data using empirical Bayes methods. Biostatistics. 2007;8:118-27
20. Leek JT, Johnson WE, Parker HS, Jaffe AE, Storey JD. The sva package for removing batch effects and other unwanted variation in high-throughput experiments. Bioinformatics. 2012;28:882-3
21. Risso D, Ngai J, Speed TP, Dudoit S. Normalization of RNA-seq data using factor analysis of control genes or samples. Nature biotechnology. 2014;32:896-902
22. Peixoto L, Risso D, Poplawski SG, Wimmer ME, Speed TP, Wood MA. et al. How data analysis affects power, reproducibility and biological insight of RNA-seq studies in complex datasets. Nucleic acids research. 2015;43:7664-74
23. Leek JT. svaseq: removing batch effects and other unwanted noise from sequencing data. Nucleic acids research. 2014:42
24. Wang D, Cheng L, Zhang Y, Wu R, Wang M, Gu Y. et al. Extensive up-regulation of gene expression in cancer: the normalised use of microarray data. Molecular bioSystems. 2012;8:818-27
25. Loven J, Orlando DA, Sigova AA, Lin CY, Rahl PB, Burge CB. et al. Revisiting global gene expression analysis. Cell. 2012;151:476-82
26. Lazar C, Meganck S, Taminau J, Steenhoff D, Coletta A, Molter C. et al. Batch effect removal methods for microarray gene expression data integration: a survey. Briefings in bioinformatics. 2013;14:469-90
27. Nygaard V, Rodland EA, Hovig E. Methods that remove batch effects while retaining group differences may lead to exaggerated confidence in downstream analyses. Biostatistics. 2016;17:29-39
28. Wang H, Sun Q, Zhao W, Qi L, Gu Y, Li P. et al. Individual-level analysis of differential expression of genes and pathways for personalized medicine. Bioinformatics. 2015;31:62-8
29. Geman D, d'Avignon C, Naiman DQ, Winslow RL. Classifying gene expression profiles from pairwise mRNA comparisons. Statistical applications in genetics and molecular biology. 2004;3:Article19
30. Guan Q, Chen R, Yan H, Cai H, Guo Y, Li M. et al. Differential expression analysis for individual cancer samples based on robust within-sample relative gene expression orderings across multiple profiling platforms. Oncotarget. 2016;7:68909-20
31. Irizarry RA, Hobbs B, Collin F, Beazer-Barclay YD, Antonellis KJ, Scherf U. et al. Exploration, normalization, and summaries of high density oligonucleotide array probe level data. Biostatistics. 2003;4:249-64
32. Mortazavi A, Williams BA, McCue K, Schaeffer L, Wold B. Mapping and quantifying mammalian transcriptomes by RNA-Seq. Nature methods. 2008;5:621-8
33. Trapnell C, Williams BA, Pertea G, Mortazavi A, Kwan G, van Baren MJ. et al. Transcript assembly and quantification by RNA-Seq reveals unannotated transcripts and isoform switching during cell differentiation. Nature biotechnology. 2010;28:511-5
34. Wagner GP, Kin K, Lynch VJ. Measurement of mRNA abundance using RNA-seq data: RPKM measure is inconsistent among samples. Theory in biosciences = Theorie in den Biowissenschaften. 2012;131:281-5
35. Li X, Cai H, Wang X, Ao L, Guo Y, He J. et al. A rank-based algorithm of differential expression analysis for small cell line data with statistical control. Briefings in bioinformatics. 2017
36. Ashburner M, Ball CA, Blake JA, Botstein D, Butler H, Cherry JM. et al. Gene ontology: tool for the unification of biology. The Gene Ontology Consortium. Nature genetics. 2000;25:25-9
37. Wang J, Zhou X, Zhu J, Gu Y, Zhao W, Zou J. et al. GO-function: deriving biologically relevant functions from statistically significant functions. Briefings in bioinformatics. 2012;13:216-27
38. Zhang M, Yao C, Guo Z, Zou J, Zhang L, Xiao H. et al. Apparently low reproducibility of true differential expression discoveries in microarray studies. Bioinformatics. 2008;24:2057-63
39. Zhang M, Zhang L, Zou J, Yao C, Xiao H, Liu Q. et al. Evaluating reproducibility of differential expression discoveries in microarray studies by considering correlated molecular changes. Bioinformatics. 2009;25:1662-8
40. Smyth GK. Linear models and empirical bayes methods for assessing differential expression in microarray experiments. Statistical applications in genetics and molecular biology. 2004;3:Article3
41. Tordai A, Wang J, Andre F, Liedtke C, Yan K, Sotiriou C. et al. Evaluation of biological pathways involved in chemotherapy response in breast cancer. Breast cancer research: BCR. 2008;10:R37
42. Shen K, Rice SD, Gingrich DA, Wang D, Mi Z, Tian C. et al. Distinct genes related to drug response identified in ER positive and ER negative breast cancer cell lines. PloS one. 2012;7:e40900
43. Murray S, Briasoulis E, Linardou H, Bafaloukos D, Papadimitriou C. Taxane resistance in breast cancer: mechanisms, predictive biomarkers and circumvention strategies. Cancer treatment reviews. 2012;38:890-903
44. Edwardson DW, Narendrula R, Chewchuk S, Mispel-Beyer K, Mapletoft JP, Parissenti AM. Role of Drug Metabolism in the Cytotoxicity and Clinical Efficacy of Anthracyclines. Current drug metabolism. 2015;16:412-26
45. Longley DB, Harkin DP, Johnston PG. 5-fluorouracil: mechanisms of action and clinical strategies. Nature reviews Cancer. 2003;3:330-8
46. Chien AJ, Moasser MM. Cellular mechanisms of resistance to anthracyclines and taxanes in cancer: intrinsic and acquired. Seminars in oncology. 2008;35:S1-S14 quiz S39
47. Ein-Dor L, Zuk O, Domany E. Thousands of samples are needed to generate a robust gene list for predicting outcome in cancer. Proceedings of the National Academy of Sciences of the United States of America. 2006;103:5923-8
48. Reifenberger G, Weber RG, Riehmer V, Kaulich K, Willscher E, Wirth H. et al. Molecular characterization of long-term survivors of glioblastoma using genome- and transcriptome-wide profiling. International journal of cancer. 2014;135:1822-31
49. Hong G, Li H, Zhang J, Guan Q, Chen R, Guo Z. Identifying disease-associated pathways in one-phenotype data based on reversal gene expression orderings. Scientific reports. 2017;7:1348
50. Gilbert PB. A modified false discovery rate multiple-comparisons procedure for discrete data, applied to human immunodeficiency virus genetics. Journal of the Royal Statistical Society: Series C. 2005;54(1):143-58
51. Tarone RE. A modified Bonferroni method for discrete data. Biometrics. 1990;46:515-22
52. Fellows I. The minimaxity of the mid p-value under linear and squared loss functions. Communications in Statistics-Theory and Methods. 2010;40(2):244-54
53. Austin SR, Dialsingh I, Altman N. Multiple Hypothesis Testing: A review. Indian Soc Of Agricultural Stat. 2014;68:303-14
54. Muralidharan O. An empirical Bayes mixture method for effect size and false discovery rate estimation. The Annals of Applied Statistics. 2010:422-38
55. Martin R, Tokdar ST. A nonparametric empirical Bayes framework for large-scale multiple testing. Biostatistics. 2012;13:427-39
56. Benjamini Y, Yekutieli D. The control of the false discovery rate in multiple testing under dependency. Annals of statistics. 2001:1165-88
57. Heller R, Gur H. False discovery rate controlling procedures for discrete tests. arXiv preprint arXiv. 2011:1112 4627
Author contact
![]() Corresponding authors: Xianlong Wang, E-mail: wang.xianlongcom; Zheng Guo, E-mail: guozhrbmu.edu.cn;
Corresponding authors: Xianlong Wang, E-mail: wang.xianlongcom; Zheng Guo, E-mail: guozhrbmu.edu.cn;