Impact Factor ISSN: 1449-2288

 Global reach, higher impact
Int J Biol Sci 2018; 14(8):938-945. doi:10.7150/ijbs.23855 This issue Cite
Research Paper
Classification of Sputum Sounds Using Artificial Neural Network and Wavelet Transform
Yan Shi1,2,3*, Guoliang Wang4*, Jinglong Niu1 ![]() , Qimin Zhang1, Maolin Cai1, Baoqing Sun5, Dandan Wang6, Mei Xue3, Xiaohua Douglas Zhang6
, Qimin Zhang1, Maolin Cai1, Baoqing Sun5, Dandan Wang6, Mei Xue3, Xiaohua Douglas Zhang6 ![]()
1. School of Automation Science and Electrical Engineering, Beihang University, Beijing 100191, China;
2. The State Key Laboratory of Fluid Power and Mechatronic Systems, Zhejiang University, Hangzhou 310058, China;
3. Beijing Engineering Research Center of Diagnosis and Treatment of Respiratory and Critical Care Medicine, Beijing Chaoyang Hospital, Beijing 100043, China;
4. Department of Electrical and Control Engineering, Beijing Union University, Beijing, China;
5. State Key Laboratory of Respiratory Disease, the 1st Affiliated Hospital of Guangzhou Medical University, Guangzhou, China.
6. Faculty of Health Sciences, University of Macau, Taipa, Macau.
*These authors contributed equally.
Received 2017-11-14; Accepted 2018-1-21; Published 2018-5-22
Abstract

Sputum sounds are biological signals used to evaluate the condition of sputum deposition in a respiratory system. To improve the efficiency of intensive care unit (ICU) staff and achieve timely clearance of secretion in patients with mechanical ventilation, we propose a method consisting of feature extraction of sputum sound signals using the wavelet transform and classification of sputum existence using artificial neural network (ANN). Sputum sound signals were decomposed into the frequency subbands using the wavelet transform. A set of features was extracted from the subbands to represent the distribution of wavelet coefficients. An ANN system, trained using the Back Propagation (BP) algorithm, was implemented to recognize the existence of sputum sounds. The maximum precision rate of automatic recognition in texture of signals was as high as 84.53%. This study can be referred to as the optimization of performance and design in the automatic technology for sputum detection using sputum sound signals.
Keywords: Respiratory system diagnosis, Auscultation, Sputum sound analysis, Discrete wavelet transform, Artificial neural network
Introduction
The vast majority of patients with mechanical ventilation in ICU are lack of the ability of self-expectoration for the establishment of artificial airway and coma position [1], so they depend on artificial secretion clearance. Sputum deposition in the airway can cause dyspnea and pulmonary infection [2, 3]. As a type of common complications of mechanically ventilated patients, the incidence of ventilator associated pneumonia (VAP) is as high as 68%, and the mortality is as high as 50-70% [4]. Secretion clearance is usually used to keep the respiratory tract clear and to improve alveolar ventilation and patients' breathe function. Thus, secretion clearance is one of the most important nursing interventions of ventilated patients' respiratory tract [5, 6].
As a type of biological signals, sputum sound is generated by the vibration of sputum in respiration. Sound signals produced by the sputum during inspiration and expiration form a powerful source of information about the condition of sputum deposition. Sputum sounds are empirically known to be closely correlated with airway conditions and they can assist to determine whether a secretion clearance is required. Sputum sound signals are able to be auscultated when sputum silt in the airway of the patients with mechanical ventilation. To ensure the health of patients with mechanical ventilation, it is important to recognize the existence of sputum timely. Chest auscultation is an inexpensive and usual way to evaluate the condition of sputum deposition. There are many limitations of the conventional method of auscultation with a stethoscope. As a subjective process, the result of the conventional method depends on the physician's own hearing, experience, and ability to differentiate different sound patterns. Moreover the human ear is not very sensitive to the lower frequency response of stethoscope [7].
Digital recording and analysis is a reliable and quantitative method for an objective assessment of sputum sounds for discrimination of sputum deposition. Machine learning has provided new insights into the analysis and classification of biological signals, such as lung sounds [8] and heart sounds [9, 10]. Many efforts have been reported in literature on the feature extraction and classification of biological sound signals [11].
From a search on the latest research, there are few related literatures about analysis and classification of sputum sounds. The mutually independent time and frequency domain representations are not highly successful in the classification of sputum sounds, which is a type of non-stationary signals. Hence, it is necessary to describe features of sputum sound signals in both time and frequency. In this study, we applied Fourier transform for the time-frequency analysis of sputum sound signals and artificial neural network (ANN) for the classification using wavelet coefficients.
Material and Methods
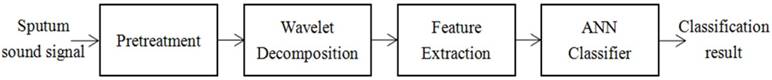
Sputum sounds recorded from various subjects will be interfered by noise. Hence before processing, the signals were pre-processed so that they can be pure relatively. After pretreatment, the signals were decomposed into frequency subbands using discrete wavelet transform (DWT). A set of statistical features was extracted from the subbands to represent the distribution of wavelet coefficients. An ANN based system was implemented to distinguish the existence of sputum: yes or no. A schematic of the proposed method is shown in Fig. 1.
Schematic of the analytic method.
Because the sputum and lung sounds [12, 13] have similar characteristics, the feature extraction and classification method of the sputum sounds was developed using the feature extraction and classification of the lung sounds, which was verified by the authors' experimental study [12, 13]. The details of the method are described below.
Acquisition of sputum sounds
To collect sputum sound signals, we first conducted experiments on respiratory sound signal acquisition. Because the experiment subjects are patients with mechanical ventilation in ICU, we developed a system for respiratory sound signal acquisition. A dedicated one, which is shown in Fig.2, was designed for specific experimental subjects and environments.
Schematic diagram of an experimental system for signal acquisition. The components are (1) patient, (2) air tube, (3) connector, (4) sound sensor, (5) data acquisition card, (6) computer, (7) ventilator.
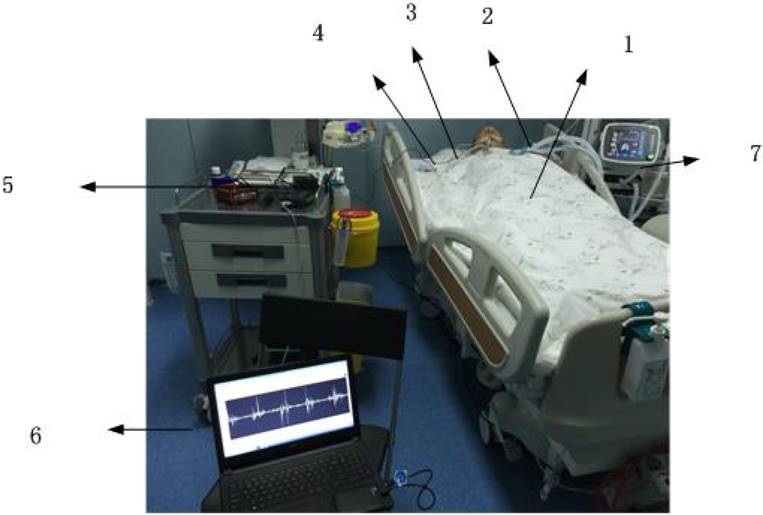
In the experimental system for signal acquisition, a connector connects an artificial airway and an acquisition device (Figure 2). Through signal acquisition, signal amplifier and sound card, the respiratory sound signals of mechanical ventilated patients were collected in a computer with Adobe Audition. Recording of the signals was done at the Department of Pulmonology ICU, Beijing Chaoyang Hospital, Beijing, China. All recordings were made under the supervision of a senior physician specialized in pulmonology and respiratory care. The classification of the sputum sounds was done by the pulmonology group headed by the senior physician, and the signals were separated into sputum deposition and non-sputum deposition. The sound sample stored in the database is in the format of digital WAVE files. The WAVE format is time-based and contains uncompressed audio in the pulse-code modulation (PCM) format. The PCM audio is the standard audio file format for CDs, containing two channels of 44,100 samples per second, 16 bits per sample [14].
Pre-processing of sputum sound signals
As an influential factor on the analysis and classification of signals, noise will affect the output obviously, especially in the studies on high-precision signal analysis. Noise from instruments such as ventilator, air-conditioner, etc., and other ambient noise may contaminate the sputum sound signals. To adapt the non-stationary signals, Chebyshev Filter, which has the property that minimizes the error between the idealized and the actual filter characteristics over the range of the filter, but with ripples in the pass-band [15], was used in this work.
The respiratory sound signals were high-pass filtered at 7.5 Hz to remove the DC offset and low-pass filtered at 2.5 kHz to avoid aliasing. The sampling rate of the respiratory sounds was 2450 Hz. After the pre-processing of original signals, relatively pure sputum sound signals were used in the following studies on feature extraction and analysis of sputum sounds.
Analysis using discrete wavelet decomposition
Wavelet transform
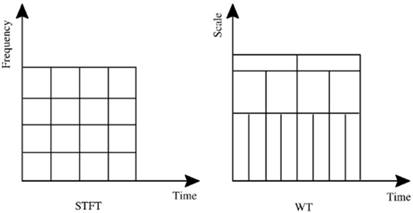
Fourier transform is usually used to convert a signal from the time domain to the frequency domain. When Fourier transform is applied on non-stationary signals, it does not provide enough information. Fourier transform can only reflect a signal's frequency domain, instead of showing the time domain. To overcome this drawback, we adopt short time Fourier transform (STFT) which uses a technique called windowing. STFT utilizes a single fixed window to map the signal into a two-dimensional space of time and frequency. Wavelet transform (WT) is equipped with time-frequency characteristics. Figure 3 shows the comparison between the analysis about the constant window regions used in STFT and the analysis about the variable window region used in WT.
Window regions of STFT and WT analyzes
The mathematical equation describing the continuous wavelet transform (CWT) of the signal x(t) is:
(1)
The quantity s, defined as the scaling parameter of the wavelet, can be considered to represent the inverse of frequency, and the dilation parameter. The wavelet is compressed when the scale is low. Similarly, it is stretched if the scale is high. That is also displayed in Fig. 3. Discrete wavelet transform (DWT) is used to sample the signal at discrete intervals when acquired by computers. When the signal is sampled at discrete intervals as in the case of acquisition by computers, discrete wavelet transform is used.
Wavelet decomposition of sputum sound signals
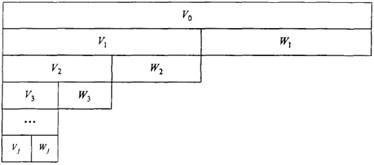
The procedure of wavelet decomposition of a signal x[n] is schematically shown in Fig. 4. Each stage is divided into two frequency space V and W, where V is the low frequency space and W is the high frequency space. V is further decomposed in the next stage. The definition of wavelet decomposition is:
Decomposition of discrete wavelet transform implementation
(2)
Selection of wavelet and number of levels: the selection of suitable wavelet and the number of levels of decomposition are very important in analysis of signals using WT. Tests are performed with different types of wavelets and the one which gives maximum efficiency is selected for the particular application.
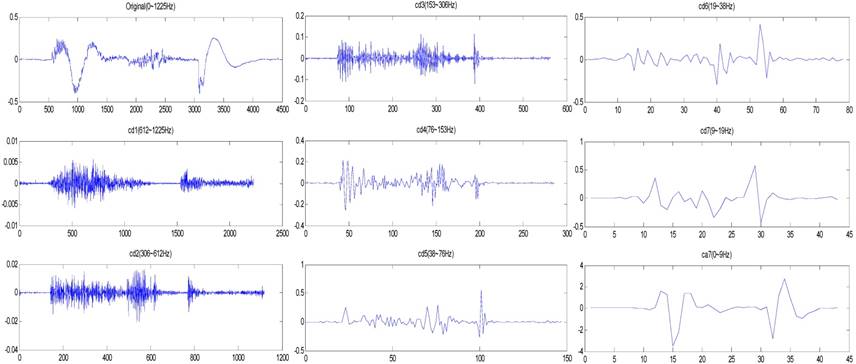
The number of levels of the decomposition is chosen based on the dominant frequency components of the signal. The levels are chosen such that those parts of the signal that correlate well with the frequencies required for classification of the signal are retained in the wavelet coefficients. Since the sputum sounds do not have any useful frequency components below 50 Hz, the number of levels was chosen to be 7. d is low frequency wavelet coefficient and the detail coefficient. a is high frequency wavelet coefficient and the approximate coefficient. Thus the signal is decomposed into d1 to d7 and one final approximation a7. The ranges of various frequency bands are shown in Table 1.
Ranges of frequency bands in wavelet decomposition
| Decomposed signal | Frequency range(Hz) |
|---|---|
| d1 | 0-9 |
| d2 | 9-18 |
| d3 | 18-37 |
| d4 | 37-76 |
| d5 | 76-153 |
| d6 | 153-306 |
| d7 | 306-612 |
| a7 | 612-1225 |
Wavelet basis, sym4, spline, and db5 were tested in this study, and the classification accuracy of db5 is maximal. Thus db5 was used as the wavelet basis in the following work. The wavelet decomposition of sputum sound signals is shown in Fig. 5.
Wavelet decomposition of sputum sound signals
Feature extraction
The traditional features include mean value, quadratic mean, kurtosis, skewness, variance. They can be represented by the following equations.
Mean,
Quadratic mean,
Skewness,
Kurtosis,
Variance,
where N is the length of signal.  represents the signal.
In this paper, we develop a new method to extract signal features. The research shows that the extracted coefficients provide a compact representation that shows the energy distribution of the signal in time and frequency. The approximate coefficients are used in signal reconstruction. Thus, these coefficients are used to be the feature of signals. Then definite the energy of coefficients [16].
 is the square of norm of signal x(t) in the space of
  , and is written as:
(3)
Then the energy of x(t) in time domain is equivalent to  . To an admissible wavelet, the equation can be written as:
(4)
(5)
The energy of coefficient can be described as:
(6)
Where
Ej,k: the energy of coefficient;
Sj,k: the kth coefficient in the jth level of the wavelet decomposition;
N: the number of discrete sampling;
j: scale parameter;
k: displacement parameter.
The classification accuracy of cycle signals is about 51%, which cannot meet the classification recognition accuracy requirements. To extract the features more efficiently, the signal in a cycle is divided into two parts, inspiration and expiration. Thus the features of a cycle of sputum sound signal were 14 energy of detail coefficients.
The following statistical features were used to represent the time-frequency distribution of the sputum signals:
1. Divide the signal in a cycle x(n) into inspiration x1(n) and expiration x2(n);
2. After 7 levels of wavelet decomposition of x1(n) and x2(n), the 14 detail coefficients are obtained;
3. Normalize the 14 energy of the detail coefficients obtained by (6);
4. Build the feature space T
(7)
Classification using artificial neural networks
For the simulation of biological neurons, ANNs have the ability of self-adaptation and self-organization [17]. The knowledge distributed in neurons and connection weights of links between neurons can contribute to solve the problem in ANN. For the sake of generating the desired mapping, the neural network has to be trained to adjust the connection weights and biases. At the training stage, the feature vectors are utilized as input to the network. Meantime, the network tunes the variable parameter, including the weights and biases, in order to acquire the relationship between the input patterns and outputs. ANNs are especially useful for complex pattern recognition and classification tasks. Based on the capability of learning from training samples, ANNs equip with the ability to approach arbitrary nonlinear functions of input. ANNs, with the highly parallel and regular structure, are suitable for pattern identification and classification tasks.
ANNs are generally applied in the biomedical field for modeling, data analysis, and diagnostic classification. BP algorithm, which is used in this study, is the most frequently used training algorithm in classification problems. However, the traditional BP algorithm has gradient descent, and gradient descent with momentum are slow. Therefore, a few of the modified BP algorithms were attempted to train the ANN, such as adaptive learning rate BP, resilient BP, Levenberg-Marquardt, and scaled conjugate gradient BP algorithms.
BP neural network is usually divided into single-output and multi-output. In this work, the output is sputum or non-sputum siltation. Therefore, there are two classes of output of the network. Three-layer neural network was used in this study because a three-layer BP neural network has a Sigmoid function of layers that can approximates any nonlinear functions with finite point of discontinuity in arbitrary precision [18]. As to equal to the number of input feature vectors, the number of input nodes was 14. As to equal to the number of output types, the number of output vectors was 2.
Results
A total of 595 sound samples were obtained in this study. The 595 samples contain 337 sputum and 258 non-sputum deposition sound signals. For each sound sample, the statistical features described in section 2.4 were obtained using the series of methods from preprocessing, wavelet decomposition to feature extraction as described in Sections 2.2 to 2.4. A classification system based on the three-layer feedforward ANN was then implemented using these statistical features as inputs. We explored the following six architectures of the three-layer and four-layers feedforward ANN in this study: 14-10-2 14-10-10-2, 14-12-2 14-12-12-2, 14-14-2 14-14-14-2, 14-16-2 14-16-16-2 ,14-18-2 14-18-18-2 and 14-20-2 14-20-20-2.
Cross validation was used to verify the reliability of the outcome of the classifier. For each validation scheme, the training sound samples were used to get the ANN classifier which would then be used to discriminate the test sound samples. In the cross-validation scheme, the dataset was divided randomly into 6 sets of size n/6, where n is the total number of data points. The training was conducted using five sets, and the remaining set was used for testing. The total number of 595 samples were partitioned into 6 disjoint subsets and each time 496 samples were used for training and the remaining 99 for validation. This process was repeated 6 times, and the average classification accuracy is reported for each ANN architecture.
The performance outcome of various ANN architecture classifiers for normalized features are reported in Tables 2. As shown in Table 2, it can be seen that three layers work better than four layers. The highest accuracy can reach 84.36% and the BP neural network classifier with the 14 middle processing layer nodes (i.e., 14-18-2) gives the maximum classification accuracy.
Performance of various ANN architectures with 3 layers and 4 layers
| Model no. | ANN architecture | classification accuracy (%) | ANN architecture | Classification accuracy (%) |
|---|---|---|---|---|
| 1 | 14-10-2 | 81.51% | 14-10-10-2 | 70.25% |
| 2 | 14-12-2 | 83.19% | 14-12-12-2 | 72.26% |
| 3 | 14-14-2 | 83.02% | 14-14-14-2 | 74.11% |
| 4 | 14-16-2 | 84.36% | 14-16-16-2 | 74.11% |
| 5 | 14-18-2 | 84.53% | 14-18-18-2 | 73.44% |
| 6 | 14-20-2 | 81.51% | 14-20-20-2 | 71.76% |
The table 3 shows the classification results with baysenet classifier, Reptree classifier, SVM classifier and logistic classifier. It can be seen that the ANN system with BP algorithm works better than others. By contrast, Table 4 shows the classification results using traditional features which have the highest accuracy of only 80.84%.
the results of classification with different classifier
| Classifier | Cross validation |
|---|---|
| ANN with BP | 84.53% |
| Bayesnet | 82.14% |
| Reptree | 75.2% |
| SVM | 62.18% |
| logistic | 82.67% |
Classification using traditional features
| Model no. | ANN architecture | classification accuracy (%) |
|---|---|---|
| 1 | 10-10-2 | 80.67% |
| 2 | 10-12-2 | 80% |
| 3 | 10-14-2 | 79.66% |
| 4 | 10-16-2 | 80.84% |
| 5 | 10-18-2 | 79.15% |
| 6 | 10-20-2 | 77.98% |
Discussion
Secretion clearance on time is extremely important for ventilated patients in the ICU as sputum deposition in the airway will cause pulmonary infection and dyspnea [2, 3]. Sputum sounds may be applied to assess the condition of sputum deposition in the airway, which will contribute to timely secretion clearance. The conventional method of assessing sputum sounds to evaluate sputum deposition in the respiratory system is chest auscultation which has many limitations because it is subjective, inaccurate and non-automatic [7]. By contrast, digital recording and analysis of sputum sounds is an objective, reliable and quantitative way to determine when to clear the sputum [19-22].
However, few efforts have been mentioned in the literature about the analysis and classification of sputum sounds although many literatures have provided new understanding about the analysis, feature extraction and classification of other biological sound signals such as lung sounds and heart sounds [9-12]. Here, we propose a digital based method to automatically detect sputum condition.
As sputum sounds are non-stationary signals, the method of independent time and frequency domain representations is not highly successful in analyzing and classifying the sputum sounds. We utilize WT for time-frequency analysis of sputum sound signals and ANN for the classification using wavelet coefficients. We first pretreat the sputum sound signals and then decomposed it into frequency subbands using DWT. The subbands extracted a set of statistical features to represent the distribution of wavelet coefficients. At last, we implemented ANN system, trained using BP algorithm to diagnose the classification of sputum sound signals. The results show that three layers and 18 middle processing layer nodes (i.e., 14-14-2) has the maximum classification accuracy of 84.53%.
Automation is under fast development for medicine [23-26]. The method of neural classification of sputum sounds using wavelet coefficients may help physicians to automatically recognize the sputum deposition of patients with mechanical ventilation in ICU and serve as an aid for nurses to clear the sputum on time. The method will be useful in clinic to improve the secretion clearance technology level, save the lives of ventilated patients, reduce patients' pain and the work intensity of medical staffs. The method may set a foundation for automatic recognition technology applications in clinical treatment.
Abbreviations
ICU: intensive care unit; ANN: artificial neural network; BP: Back Propagation; WT: wavelet transform; DWT: discrete wavelet transform; PCM: pulse-code modulation; STFT: short time Fourier transform.
Acknowledgements
This work was supported by the Start-up Research Grant (SRG2016-00083-FHS) at University of Macau, the National Natural Science Foundation of China (Grant No. 51575020) and open foundation of the State Key Laboratory of Fluid Power and Mechatronic Systems.
Competing Interests
The authors have declared that no competing interest exists.
References
1. Tehrani FT. A control system for mechanical ventilation of passive and active subjects. Computer methods and programs in biomedicine. 2013;110:511-8
2. Song FT. Clinical effect of bronchofiberscopic sputum aspiration in treatment of se-vere pulmonary infection. China Modern Medicine. 2015;22:39-41
3. Schadler D, Mersmann S, Frerichs I, Elke G, Semmel-Griebeler T, Noll O. et al. A knowledge- and model-based system for automated weaning from mechanical ventilation: technical description and first clinical application. Journal of clinical monitoring and computing. 2014;28:487-98
4. Branson RD. Secretion management in the mechanically ventilated patient. Respiratory care. 2007;52:1328-42 discussion 42-7
5. Denney JA, Capanni F, Herrera P, Dulanto A, Roldan R, Paz E. et al. Establishment of a prospective cohort of mechanically ventilated patients in five intensive care units in Lima, Peru: protocol and organisational characteristics of participating centres. BMJ open. 2015;5:e005803
6. Durbin CG Jr, Blanch L, Fan E, Hess DR. Respiratory Care year in review 2013: airway management, noninvasive monitoring, and invasive mechanical ventilation. Respiratory care. 2014;59:595-606
7. Drzewiecki G, Katta H, Pfahnl A, Bello D, Dicken D. "Active and passive stethoscope frequency transfer functions: Electronic stethoscope frequency response," 2014 IEEE Signal Processing in Medicine and Biology Symposium (SPMB), Philadelphia, PA, 2014, pp. 1-4.
8. Palaniappan R, Sundaraj K, Sundaraj S. A comparative study of the SVM and K-nn machine learning algorithms for the diagnosis of respiratory pathologies using pulmonary acoustic signals. BMC bioinformatics. 2014;15:223
9. Zhang W, Guo X, Yuan Z, Zhu X. Heart Sound Classification and recognition based on EEMD and Correlation dimension. Journal of Mechanics in Medicine and Biology. 2014;14:1450046
10. Patidar S, Pachori RB. Classification of cardiac sound signals using constrained tunable-Q wavelet transform. Expert Systems with Applications. 2014;41:7161-70
11. Peng Y, Dai Z, Mansy HA, Sandler RH, Balk RA, Royston TJ. Sound transmission in the chest under surface excitation: an experimental and computational study with diagnostic applications. Medical & biological engineering & computing. 2014;52:695-706
12. Kandaswamy A, Kumar CS, Ramanathan RP, Jayaraman S, Malmurugan N. Neural classification of lung sounds using wavelet coefficients. Computers in Biology and Medicine. 2004;34:523-37
13. Dennis J, Dat T, Li H. Combining robust spike coding with spiking neural networks for sound event classification 2015.
14. Abbas A. Statistical signal processing technique for identification of different infected sites of the diseased lungs. Journal of medical systems. 2012;36:1537-41
15. Freeborn T, Maundy B, Elwakil AS. Approximated Fractional Order Chebyshev Lowpass Filters. Mathematical Problems in Engineering. 2015;2015:7
16. Liu Y, Zhang CM, Zhao YH, Dong L. The feature extraction and classification of lung sounds based on wavelet packet multiscale analysis. chinese journal of computers. 2005;29:769-77
17. Wang L, Zeng Y, Chen T. Back propagation neural network with adaptive differential evolution algorithm for time series forecasting. Expert Systems with Applications. 2015;42:855-63
18. Bianchini M, Scarselli F. On the complexity of neural network classifiers: a comparison between shallow and deep architectures. IEEE transactions on neural networks and learning systems. 2014;25:1553-65
19. Niu J, Shi Y, Cai M, Cao Z, Wang D, Zhang Z. et al. Detection of Sputum by Interpreting the Time-frequency Distribution of Respiratory Sound Signal Using Image Processing Techniques. Bioinformatics. 2017 doi:10.1093/bioinformatics/btx652
20. Ren S, Cai M, Shi Y, Xu W, Zhang XD. Influence of Bronchial Diameter Change on the airflow dynamics Based on a Pressure-controlled Ventilation System. International Journal for Numerical Methods in Biomedical Engineering. 2017 doi:10.1002/cnm.2929
21. Shi Y, Zhang B, Cai M, Zhang XD. Numerical simulation of volume-controlled mechanical ventilated respiratory system with 2 different lungs. International Journal for Numerical Methods in Biomedical Engineering. 2017;33:e2852
22. Shi Y, Wang Y, Cai M, Zhang B, Zhu J. An aviation oxygen supply system based on a mechanical ventilation model. Chinese Journal of Aeronautics. 2017 doi: 10.1016/j.cja.2017.10.008
23. Zhang XD, Zhang Z, Wang D. CGManalyzer: an R package for analyzing continuous glucose monitoring studies. Bioinformatics. 2018 doi: 10.1093/bioinformatics/btx826
24. Zhang XD. An effective method controlling false discoveries and false non-discoveries in genome-scale RNAi screens. Journal of Biomolecular Screening. 2010;15:1116-22
25. Zhang XD, Roeder K, Wallstrom G, Devlin B. Integration of association statistics over genomic regions using Bayesian adaptive regression splines. Human Genomics. 2003;1:20-29
26. Zhang XD, Zhang ZZ. displayHTS: a R package for displaying data and results from high-throughput screening experiments. Bioinformatics. 2013;29:794-6
Author contact
![]() Corresponding authors: Xiaohua Douglas Zhang, Email: douglaszhangmo; Jinglong Niu, Email: niujinglong723com
Corresponding authors: Xiaohua Douglas Zhang, Email: douglaszhangmo; Jinglong Niu, Email: niujinglong723com