10
Impact Factor
ISSN: 1449-2288
Int J Biol Sci 2018; 14(10):1277-1290. doi:10.7150/ijbs.27055 This issue Cite
Research Paper
Fluid Shear Stress Promotes Autophagy in Hepatocellular Carcinoma Cells
Institute of Biomedical Engineering, West China School of Basic Medical Sciences & Forensic Medicine, Sichuan University, Chengdu 610041, China
Received 2018-5-3; Accepted 2018-6-18; Published 2018-7-27
Abstract

The autophagy in cancer cells is recognized as an essential hallmark of tumors, which can enhance cancer cell migration and invasion, and result in high incidence of tumor metastasis. The fluid shear stress (FSS) in tumor mechanical microenvironment plays a pivotal role in mediating the behaviors and functions of cells. In this study, the hepatocellular carcinoma cells were exposed to 1.4 dyn/cm2 FSS to explore whether FSS could induce autophagy. The results of TEM, Ad-mCherry-GFP labeled LC3B, and mRNA and protein expression of autophagy markers confirmed that FSS could induce autophagy in a time-dependent manner. Additionally, the inhibition of autophagy significantly downregulated the expression of PI3K, FAK and Rho GTPases, and attenuated the ability of cell migration, suggesting that FSS-induced autophagy depended on PI3K- FAK-Rho GTPases pathway. This study elucidated the role of FSS in inducing autophagy during tumor progression, which has emerged as a promising clinical strategy for cancer.
Keywords: Hepatocellular carcinoma, Tumor microenvironment, Fluid shear stress, Autophagy, Cell migration.
Introduction
Hepatocellular carcinoma (HCC) is a subtype of liver cancer with poor prognosis and limited treatments. The migration, invasion and metastasis of primary hepatoma carcinoma cells are the main causes of postoperative recurrence and poor curative effect of HCC [1]. Autophagy is an evolutionarily conserved physiologic process that is maintained at a basal rate by cells throughout the body [2, 3]. Recently, increasing evidence suggests that autophagy is a double-edged sword in hepatocarcinogenesis, which autophagy prevents the initiation of hepatocarcinogenesis by suppressing oxidative stress and DNA damage at early tumorigenesis, promoting tumor cell migration and metastasis once hepatocarcinogenesis has been initiated [4, 5].
The occurrence of autophagy in cancer cells depends on the tumor microenvironment. The tumor microenvironment is a complex environment which consists of growth factors, chemokines and surrounding matrix tissues, as well as mechanical factors such as interstitial flow and fluid shear stress (FSS) generated by the flow of blood, tissue fluid and lymph fluid [6]. Zhang et al [7] reported that TGF-β2 could initiate autophagy and promote invasion of glioma cells. The adipocytokine secreted by adipocytes in the breast tumor microenvironment, induced autophagy in breast cancer cells [8]. IL-37 induced the occurrence of autophagy in hepatocellular carcinoma cells, mediating the tumorigenesis and tumor suppression [9]. However, these studies on the occurrence of autophagy in tumor cells mainly focus on the induction of chemical factors. There are few researches on the effect of biophysical factors such as FSS triggering autophagy. Due to dysplasia of tumor tissue vessel and incompletion of endothelial layer, HCC is directly exposed to blood or lymph flow, which results in the high occurrence of tumor metastasis. Studies have shown that cancer cells in the tumor microenvironment are often exposed to FSS ranging from 0.01 to 0.2 Pa (0.1 dyn/cm2 to 2 dyn/cm2) [10]. 2 dyn/cm2 FSS markedly upregulated the expression of matrix metalloproteinase-12 (MMP-12) and promoted the invasion of chondrosarcoma [11].
There are a lot of works highlight the direct involvement of autophagy in cell migration and cancer metastasis [5, 12]. The autophagy regulated tumor cell motility by various mechanisms such as synergistic interaction with epithelial-mesenchymal transition (EMT), focal adhesion (FA) turnover, PERK1 signaling pathway and FAK signaling pathway [12]. Our previous studies have confirmed that FSS regulated endothelial cell and tumor cell migration through Integrins-FAK-Rho GTPases signaling pathway [13]. As a crucial downstream regulator of PI3K, FAK leads to a cascade of activation of downstream signaling pathways [14], which is involved in autophagy induction [15]. Especially, PI3K/AKT/mTOR cascade is regarded as a classic signaling pathway in mediating the occurrence of autophagy [16]. The phosphatidylinositol-3 kinase (PI3K) signaling pathway is an important regulator of cell functions including survival and proliferation, as well as cell migration [17]. Activation of PI3K further activates a downstream serine/threonine protein kinase (AKT) signaling via Ras and P110. The phosphorylation of AKT determines the activity of Rho GTPases (Rho A, Rac1 and Cdc42), which eventually contribute to the cellular migration behavior through the activation of cell filopodia, pseudopodia and stress fibers [18-20]. Accordingly, we hypothesized that autophagy induced by FSS regulates the liver cancer cell migration depended on PI3K-FAK-Rho GTPases signaling pathway.
Accordingly, in the present study, HepG2 and QGY-7703 cells as model cell lines were exposed to 1.4 dyn/cm2 FSS for different duration (0.5h, 1h, 2h, 4h) to explore whether FSS could induce autophagy in hepatocellular carcinoma cells. The formation of autophagosomes and the autophagy flux were examined, and the time-dependent changes in mRNA and protein expression of autophagy-relative genes and proteins ATG5, ATG7, Beclin1, P62 and LC3Ⅱ/Ⅰ were examined. Using autophagy inhibitor 3-Methyladenine (3MA) which targeted PI3K Class Ⅲ, we further determined whether FSS-induced autophagy depended on PI3K-FAK-Rho GTPases signaling pathway. This work provides a further understanding of mechanics in tumor microenvironment regulating autophagy, which is expected to provide new approaches to HCC therapeutic applications.
Materials and methods
Ethics statement
This article does not contain any studies with human participants or animals performed by any of the authors.
Cells and cell culture
HepG2 and QGY-7703 cells were selected as model cancer cells for the present study. HepG2 cells (Institute of Cell Biology and Biochemistry, Shanghai, China) are adherent, epithelial-like cells growing with small aggregates. QGY-7703 cells (Institute of Cell Biology and Biochemistry, Shanghai, China) were derived from malignant hepatoma cells of the liver epithelial cells. Both HepG2 and QGY-7703 cells were maintained in RPMI-1640 complete growth medium (Invitrogen Company, USA), supplemented with 10% fetal bovine serum (FBS, Gibco BRL, USA), 2mM L-Glutamine, 100 U/mL penicillin, 20 mmol/L HEPES (Sigma, USA), 2‰ NaHCO3 and 50 mg/mL streptomycin (Beyotime Institute of Biotechnology).
Fluid flow stimulation
HepG2 and QGY-7703 cells were seeded onto glass slides (7.5 cm×2.5 cm×1.0 cm) at a concentration of 4×10⁴ cells/cm2 and incubated in an incubator (Heraeus Company, Germany) with 5% CO2 at 37°C. The cells on glass slides were cultured to about 90% confluence and then placed the slides in a parallel plate flow chamber with a laminar fluid shear stress of 1.4 dyn/cm2. HepG2 and QGY-7703 cells were subjected to FSS for 0.5h, 1h, 2h and 4h at 37°C with 5% CO2, which was defined as 0.5h group, 1h group, 2h group, and 4h group, respectively. In addition, HepG2 and QGY-7703 cells were pre-treated with autophagy inhibitor 3-methyladenine (3MA, 5 mM) overnight, then exposed to FSS for 0.5h and 1h respectively, which was defined as 0.5h+3MA and 1h+3MA group.
Analysis of autophagosome by TEM
HepG2 cells with 90% confluence were exposed to 1.4 dyn/cm2 FSS for 0.5h, 1h, and 2h, respectively. After exposing to FSS for different duration, the cells were washed three times with PBS for 5 min. The cells were collected and centrifuged at 1500 rpm for 15 minutes. Discard the supernatant, add 0.5% glutaraldehyde fixative (1: 6 dilution with PBS, Amersco Company, USA) and then let the sample stand still at 4 °C for 10 min. Then centrifuge it at 12000 rpm for 12 min, discard supernatant and slowly add 3% glutaraldehyde fixative (Amersco Company, USA). Finally, 1% osmium tetroxide fixed again, acetone dehydration, Epon812 embedded, ultra-thin sections, uranyl acetate and lead citrate double staining. The autophagosomes in cells were observed by TEM (H-600IV, Japan) in all different fields of view.
mCherry-GFP-LC3B infection
The mCherry-GFP-LC3B (Beyotime Biotechnology Co., LTD, Beijing, China) is an adenovirus that expresses the mCherry-GFP-LC3B fusion protein and is used for the monitor of autophagy flux after infection of cells or tissues. HepG2 and QGY-7703 cells with 90% confluence were prepared into 2 mL of cell suspension. Place a small round glass slide (12 mm in diameter) into a 24-well plate (Corning Company, USA), then add 100 μL to 120 μL of cell suspension to each slide, continue to incubate. After cells adhering to the glass slide, add 500 μL of RMPI1640 complete medium into the 24-well plate, continue to culture. When the cells grown to 50% confluence, the RMPI1640 complete growth medium was replaced with pre-configured virus solution with MOI=10. After 24h of infection, the virus-containing medium was removed, washed for three times with PBS, and added with 500 μL of RMPI1640 complete growth medium, keeping culture for 48h.
After mCherry-GFP-LC3B adenovirus infection, the HepG2 and QGY-7703 cells were loaded with 1.4 dyn/cm2 FSS for 0.5 and 1h, respectively. Subsequently, slides were removed at above various time points and put into 24-well plates, washed with PBS for three times. Then they were fixed with 4% paraformaldehyde for 8 min, washed with PBS 3 times for 5 min. Then DAPI (4', 6'-diamidino-2-phenylindole) with 1:400 dilution was added and co-incubated for 15-30 min at 37°C. Samples sealed with glycerol were observed by laser scanning confocal microscopy (Leica TCS SP5, Germany).
qRT-PCR
Quantitative real-time polymerase chain reaction (qRT-PCR) was used to investigate the expression of autophagy-related genes in hepatocellular carcinoma cells at different duration of FSS loading. The static cultured HepG2 and QGY-7703 cells were set as controls, and the cells cultured with Earle's balanced salt solution (EBSS) contains no serum and other nutrients were used as positive control. The ATG5, ATG7 and Beclin-1 gene primers were designed and synthesized by Dalian Bao biological company. Disintegrated by the Trizol reagent (Thermo Fisher Scientific company, USA), then cells were placed on ice and rinsed for three times with cool PBS. The total RNA was collected and quantified with Nano drop 2000 (Thermo Fisher company, USA). Then the total RNA was reverse transcribed into cDNA according to the procedure of the PrimeScript® RT reagent Kit with gDNA Eraser reverse transcription kit (Bao biological engineering company, Dalian, China). Finally, real-time fluorescence quantitative PCR mixture with SYBR® Premix Ex TaqⅡ (Tli RNaseH Plus) was prepared. The amplification of autophagy-related genes was achieved by the polymerase chain reaction (PCR). The expression level of the target gene was corrected by the expression level of reference gene GAPDH, and the relative expression level of the target gene was calculated by 2- △△Ct analysis. Each experiment was performed in triplicates and the same protocol was followed until the completion of the experiment.
Cell migration——scratch-wound assays
The scratch wound assay was applied to measure and evaluate migration ability of liver cancer cells. HepG2 and QGY-7703 cells were cultured to about 90% confluence, followed by fluid shear stress exposure, autophagy inhibitor 3MA pre-treatment combined FSS stimulation, EBSS pre-treatment, and EBSS pre-treatment combined 3MA inhibitor, respectively. Then a uniform scratch (about 500 μm width) was performed in the cell monolayer using a sterile micropipette tip. Washing the slides gently with PBS three times, then the cells were cultured in an incubator containing 5% CO2 at 37°C. Three images of the wounds were randomly chosen at 0h and photographed consecutively at 0h and 24h under static culture using an inverted microscope (CK2, Olympus, Japan). The cell migration distance at the end of each recording period was calculated as the difference between the end length and the original length of the wound edge.
Western blotting assays
The HepG2 and QGY-7703 cells were cultured to about 90% confluency and then exposed to FSS of 1.4 dyn/cm2. The cells were disintegrated by cell lysis solution. The total proteins were collected and centrifuged with 12,000 rpm at 4°C for 8 min, quantified by bicinchoninic acid (BCA) assay kit (Beyotime Biotechnology Co., LTD, Beijing, China). Equal amounts of protein (30 μg) were loaded onto each lane of a 10% SDS-PAGE gel. After gel electrophoresis and membrane transferring, polyvinylidene difluoride membranes (PVDF, GE Healthcare) were blocked for 2h in 5% BSA in TBST buffer (20 mM Tris-HCl [pH 8.0], 150 mM NaCl, 0.05% Tween 20) at 37°C. Membranes were incubated with primary antibodies including ATG5, ATG7, Beclin1 and P62 (Santa Cruz, Inc., USA) and LC3Ⅱ/Ⅰ (Sigma, USA), as well as PI3K (Sigma, USA), FAK, Rac1, Rho A, Cdc42 (Santa Cruz, Inc., USA) overnight at 4°C, respectively. HRP binding secondary antibodies were incubated for 2h at 37°C. Bands were visualized by enhanced chemiluminescence and Molecular Image®ChemiDocTM XRS+ system with Image LabTM Software. The tests were performed three times and quantification was done and analyzed by Image J 1.44p software (National Institutes of Health, USA). The intrinsic controls (GAPDH) were used to guarantee the uniformity of equal loaded protein among all groups.
Statistical analysis
All statistics were analyzed using statistical software SPSS 11.5 (SPSS, Inc., Chicago, Illinois). Data obtained from different treatment groups were statistically compared and reported as means ± SD. To reveal differences among the groups, one-way ANOVA followed by Tukey's test was used. Differences were considered significant at P< 0.05.
Results
FSS induced the formation of autophagosomes in HepG2 cells
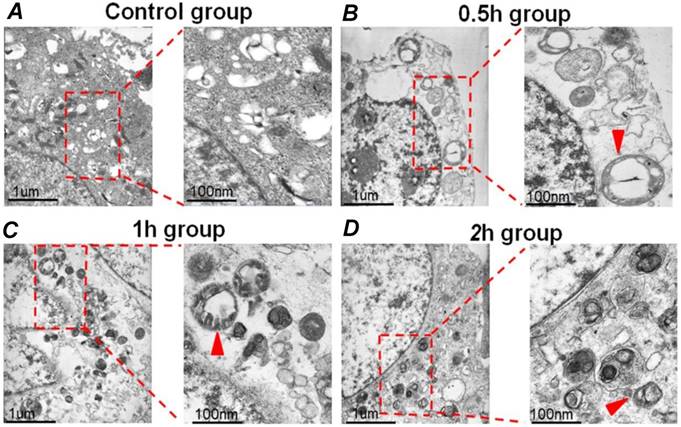
HepG2 cells were exposed to FSS, and the autophagosomes in cells were then observed by TEM. Autophagosomes are characterized by the vacuole-like structure of bilayer or multilayer membranes containing cytoplasmic components such as organelles. As shown in Figure 1A, there was no bilayer membrane structure could be found in control group (static culture conditions), while it was evident from the TEM images that a lot of autophagosomes formed in the cytoplasm at 0.5h, 1h and 2h group, respectively (Figures 1B-D). These results provided direct evidence that FSS could induce autophagy in HepG2 cells.
The LC3B distribution
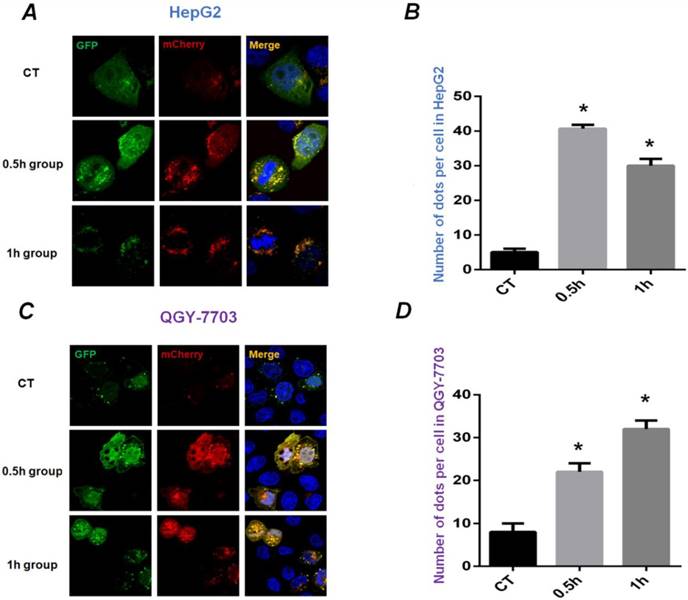
HepG2 and QGY-7703 cells were infected with mCherry-GFP-LC3B adenovirus to detect the occurrence of autophagy. The diffuse yellow mCherry-GFP-LC3B dots (the combination of red Cherry and green GFP) at the cytoplasm accumulate to yellow spots at the autophagosome membrane during the process of autophagy. As shown in Figure 2, HepG2 and QGY-7703 cells infected with mCherry-GFP-LC3B adenovirus showed diffuse yellow fluorescence in the cytoplasm under static culture conditions. Exposed to FSS for 0.5h, the yellow mCherry-GFP-LC3B spots obviously aggregated at autophagosome membrane. With the increase of FSS loading duration, the areas of yellow spots enlarged and further aggregated in 1h group (Figures 2A and C). The ImageJ software was used to calculate the number of spots in cells. The statistical results showed that the number of yellow fluorescent spots in HepG2 and QGY-7703 cells in 0.5h and 1h group increased significantly compared to static culture control (Figures 2B and D).
The typical TEM images of autophagosomes in HepG2 cells. (A) The HepG2 cells were cultured under static culture conditions (control group). The cells were exposed to 1.4 dyn/cm2 FSS for 0.5h, 1h and 2h, which defined as 0.5h (B), 1h (C), and 2h group (D). Scale bar=1 μm. The enlarged images showed the autophagosomes with bilayer membrane structure (indicated by red arrows). Scar bars in figures are 100 nm.
The mCherry-GFP-LC3B puncta formation assays. Confocal images showed distribution of LC3B during the process of autophagy in HepG2 cells (A) and QGY-7703 cells (C) transfected with mCherry-GFP-LC3B adenovirus. The static control (CT group) showed diffuse yellow dots at the cytoplasm; 0.5h group showed that yellow mCherry-GFP-LC3B spots aggregated at the autophagosome membrane; the areas of yellow spots enlarged and further aggregated in 1h group. The statistical results of fluorescent spots were analyzed in HepG2 cells (B) and QGY-7703 cells (D). *, P<0.05 vs CT.
The mRNA expression of autophagy-related genes
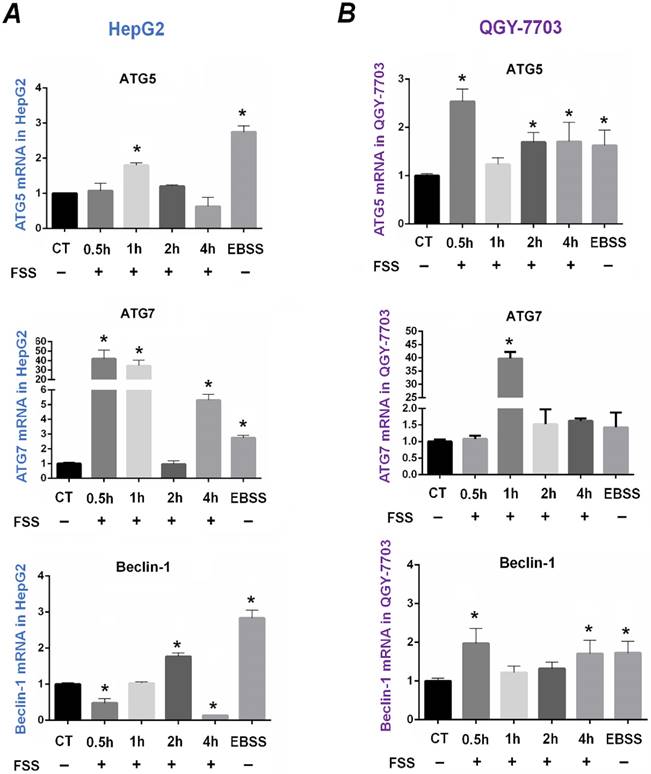
ATG5, ATG7, and Beclin-1 are closely related to the process of autophagy and have been regarded as the markers of autophagy. Exposed to FSS for different duration, the time-dependent mRNA expression of autophagy-related genes ATG5, ATG7, and Beclin1 was examined to determine the autophagy in HepG2 and QGY-7703 cells (as shown in Figure 3).
As the positive control, EBSS significantly upregulated the mRNA expression of ATG5, ATG7 and Beclin1 compared to that of the static culture control in two cell lines (P <0.05). In HepG2 cells, the expression of ATG5 at 1h group was remarkably higher than that of the control group. Exposing to FSS significantly up-regulated ATG7 expression at 0.5h and 1h, but ATG7 gene expression sharply decreased at 2h and subsequently increased at 4h. Interestingly, the mRNA expression of Beclin1 gene decreased at initial 0.5h compared with the control group, while was significantly up-regulated at 2h (Figure 3A). In QGY-7703 cells, FSS significantly upregulated mRNA expression of ATG5 and Beclin-1 at initial 0.5h, and ATG7 at 1h, respectively (Figure 3B). These results suggested that, as an important physical factor, FSS could induce the rapid occurrence of autophagy in hepatocellular carcinoma cells. The upregulation of autophagy-related genes suggested that FSS induced autophagy in a relatively short duration (0.5h and 1h).
FSS regulated the expression of autophagy-related marker proteins
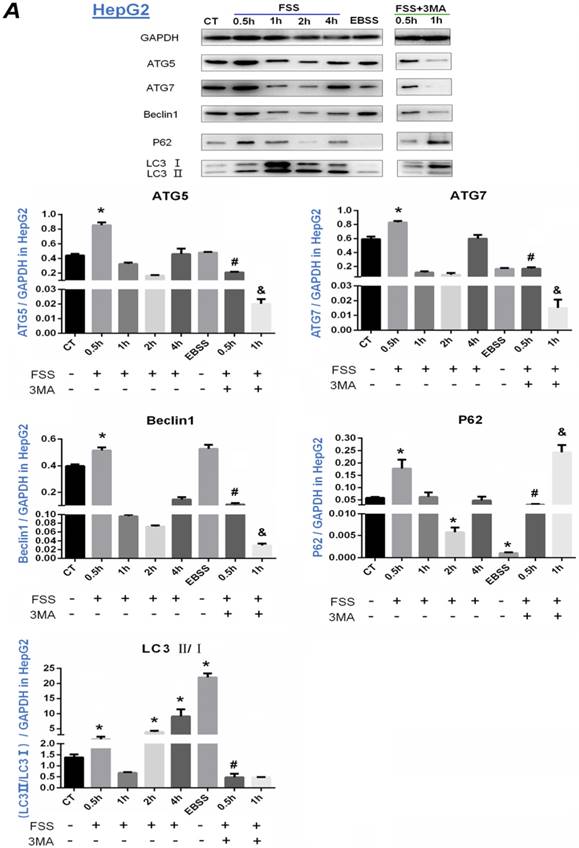
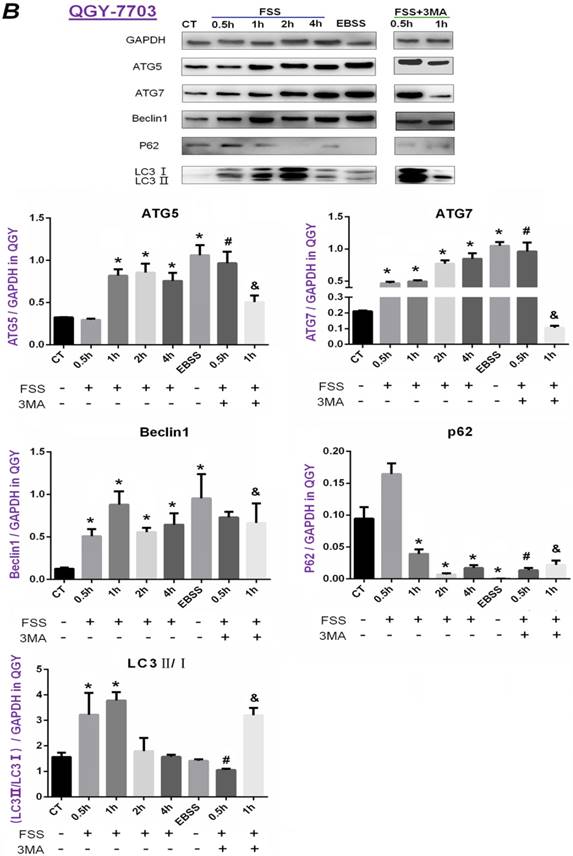
The expression of autophagy marker proteins ATG5, ATG7, Beclin-1, P62 and LC3II/I was further investigated in HepG2 cells (Figure 4A) and QGY-7703 cells (Figure 4B). According to Fig.4A, it was found that the expression of ATG5, ATG7 and Beclin1 protein in HepG2 cells was significantly up-regulated at 0.5h group compared with the static control group (P<0.05). The addition of 3MA remarkably decreased the level of ATG5, ATG7 and Beclin1 at 0.5 and 1h. As a reporter of autophagy activity, P62 protein is a degraded substrate protein during autophagy. Our results showed that P62 protein expression was significantly upregulated at 0.5h group, then decreased at 2h with FSS loading. Additionally, the expression of P62 with the addition of 3MA inhibitor showed a sharp upregulation at 1h. During the process of autophagy, LC3B binds to autophagosomes, then LC3I gradually converts to LC3II, the ratio of LC3Ⅱ/Ⅰ becomes higher. LC3B is the most widely used marker of autophagy flux [21]. As shown in Figure 4A, the ratio of LC3II/I significantly increased in 0.5h, 2h and 4h groups, but showed a decrease at 1h after exposing to FSS. With addition of 3MA inhibitor, the ratio of LC3II/I was lower than that of the control, and there was a significant difference compared with 0.5h FSS-loaded group (P<0.05).
Effects of FSS on autophagy-related genes expression in HepG2 cells and QGY-7703 cells. FSS induced the time-dependent expression of autophagy-related genes ATG5, ATG7, Beclin1 in HepG2 cells (A) and in QGY-7703 cells (B). *, P<0.05 vs CT.
Similarly, FSS induced a significant up-regulation of ATG5, ATG7, Beclin1 in QGY-7703 cells at 1h. Inconsistent with HepG2 cells, the ratio of LC3II/I in QGY-7703 cells was significantly up-regulated at 0.5h and 1h, then showed a sharp decrease and was equal to control level at 2h and 4h. Interestingly, the expression of P62 protein obviously decreased not at initial 0.5h but at 2h in both cells. Also, the addition of 3MA remarkably decreased the level of ATG5, ATG7 and Beclin1 at 1h (Figure 4B). In conclusion, 1.4 dyn/cm2 FSS significantly up-regulated the expression of autophagy-related marker proteins ATG5, ATG7, Beclin1, LC3Ⅱ and degraded P62 in HepG2 cells at 0.5h and in QGY-7703 cells at 1h, respectively, which could be significantly suppressed by 3MA inhibitor.
FSS-induced autophagy enhanced the migration of HepG2 and QGY-7703 cells
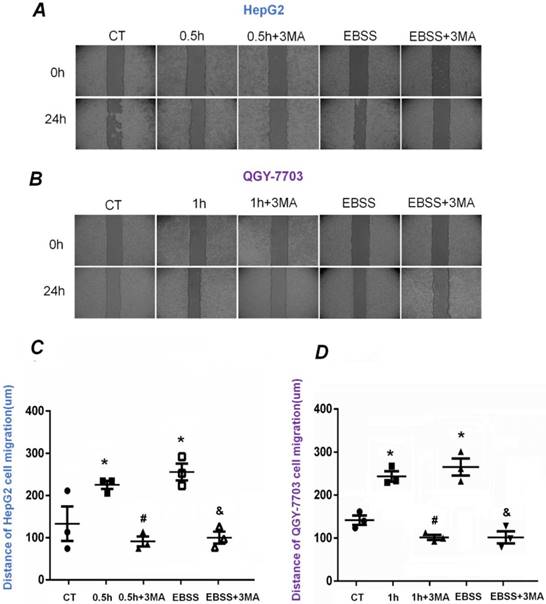
To explore the alteration of migration ability of HepG2 and QGY-7703 cells, wound scratch assays were performed (Figure 5A-B). The cells were exposed to FSS for 0.5h and 1h, respectively. The statistical results indicated that the migrated distance of HepG2 and QGY-7703 cells after 24h were 210±10 μm/225±10 μm in FSS groups and 260±10 μm/275±10 μm in EBSS groups, which were larger than that of static culture controls, suggesting that FSS-induced autophagy significantly enhanced the migration ability of both cell lines (Fig. 5C-D). Compared with the FSS group, it could be found that the addition of inhibitor 3MA significantly inhibited the migration of both cells. Similarly, pre-treatment with 3MA in EBSS groups also significantly inhibited the migration of both cell lines, in contrast with the EBSS groups (Fig. 5C-D).
Effects of FSS on the expression of autophagy marker proteins in HepG2 cells and QGY-7703 cells. Exposing to FSS, the expression of autophagy-related proteins ATG5, ATG7, Beclin1, LC3Ⅱ/ LC3Ⅰ showed up-regulation in HepG2 cells (A) and QGY-7703 cells (B). Totally, the peak of autophagy-related proteins expression changes in HepG2 at 0.5h and in QGY-7703 cells at 1h. With the addition of 3MA, the expression of ATG5, ATG7, Beclin1 protein and LC3Ⅱ/ LC3Ⅰ was remarkably decreased, P62 level was up-regulated. Based on the gray value of Western blot bands, the statistic results were analyzed. *, P<0.05 vs CT; #, P<0.05 vs 0.5h group; &, P<0.05 vs 1h group.
FSS-induced autophagy depended on PI3K-FAK-Rho GTPases pathway
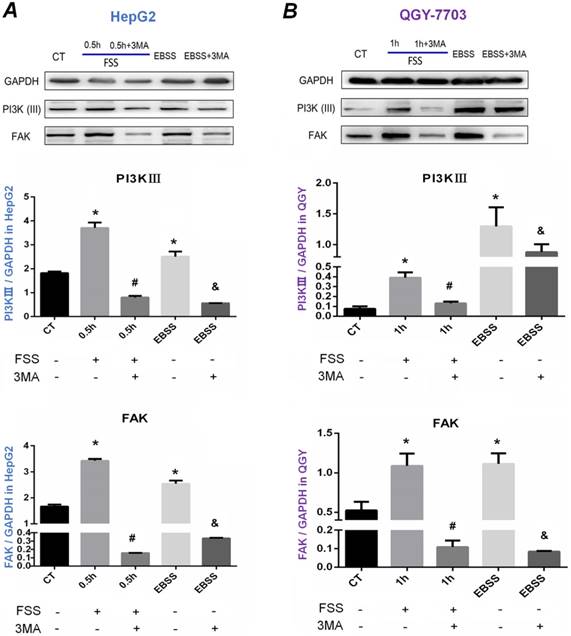
Our previous results indicated that HepG2 cells and QGY-7703 cells revealed obvious autophagy exposed to FSS at 0.5h and 1h respectively, and autophagy inhibitor 3MA significantly inhibited autophagy and cell migration. We further explored the potential mechanism of FSS-induced cellular autophagy. As shown in Figure 6, consistent with positive control EBSS group, FSS significantly up-regulated the intracellular PI3K (Ⅲ) and FAK expression in both HepG2 cells and QGY-7703 cells at 0.5h and 1h. The expression of PI3K (Ⅲ) and FAK was significantly decreased with pre-treatment of 3MA inhibitor, suggesting that FSS and EBSS-induced autophagy both depended on PI3K (Ⅲ)-FAK signaling pathway.
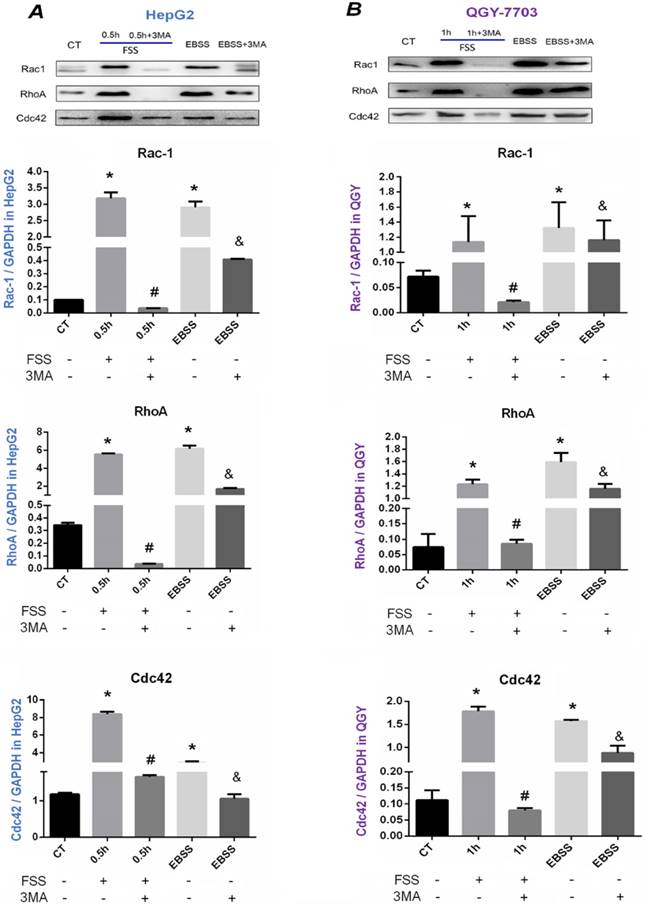
The downstream signals of Rho GTPases were further explored (Figure 7). As illustrated in Western blot assays and statistical analysis, FSS significantly up-regulated the levels of Rho A, Rac1 and Cdc42 in both HepG2 cells and QGY-7703 cells, and the total expression of these small G proteins was significantly down-regulated with the treatment of 3MA inhibitor (P<0.05). The EBSS positive control group also significantly increased the expression of three proteins in both cells, which was significantly decreased with autophagy inhibitor 3MA addition (P<0.05). Accordingly, these results confirmed that FSS-induced autophagy depended on PI3K (Ⅲ)-FAK signaling pathway, and the occurrence of autophagy enhanced cell migration ability via Rho GTPases.
Discussion
HCC has the characteristics of high malignancy, rapid progression, poor curative effect and short survival time. During the progression of cancer, the tumor cells migrated from the primary tumor and invaded into the nascent blood vessel, metastasized to form new solid tumors. Therefore, the study of the mechanism of tumor cell migration is crucial for developing new treatment strategies for cancer patients.
The tumor microenvironment is composed of extracellular matrix molecules, tumor cells, endothelial cells, fibroblasts and immune cells, which contributes to tumor growth, invasion and metastasis [22]. Dynamic stresses which exerted by the interactions among these cellular components and the blood and lymphatic flow, constitute together a complicated tumor mechanical microenvironment [23]. Increasing evidence reveals that multiple mechanical forces such as FSS have been identified as crucial factors in cancer initiation and progression. 2 dyn/cm2 FSS increased the release of cyclic AMP and interleukin-1β via the induction of MMPs (MMP-1, MMP-7 and MMP-12) in PI3K and ERK1/2-dependent manner, which significantly promoted motility and invasion of chondrosarcoma cells [24, 25].
The effects of FSS-induced autophagy on HepG2 and QGY-7703 cell migration. Typical images of HepG2 cells (A) and QGY-7703 cells (B) migration at 0h and 24 h, respectively. Statistically analyzed the migration distance of HepG2 cells (C) and QGY-7703 cells (D). Both cells migration ability remarkably enhanced in FSS group and EBSS group, then decreased with the pre-treatment of 3MA inhibitor. *, P<0.05 vs CT; #, P<0.05 vs 0.5h (HepG2 cells) or 1h group (QGY-7703 cells); &, P<0.05 vs EBSS group.
Western blot analysis of the effects of autophagy on PI3K and FAK proteins expression. Western blot bands of PI3K and FAK level in HepG2 cells (A) and QGY-7703 cells (B) under the conditions of FSS, EBSS and 3MA inhibitor. PI3K and FAK level increased in FSS and EBSS groups, while decreased with the treatment of 3MA. Quantification of PI3K and FAK level based on Western blot bands. The expression of GAPDH in each group was used as intrinsic controls, and relative expression of each proteins /GAPDH were calculated. Values are presented as the mean ±SD of three independent experiments. *, P<0.05 vs CT; #, P<0.05 vs 0.5h group in HepG2 cells or 1h group in QGY-7703 cells; &, P<0.05 vs EBSS group.
As an important mechanism for tumor cells metastasis, tumor cell autophagy has been widespread concerned [26]. In tumor microenvironments, a variety of factors, including starvation, low cellular energy levels, endoplasmic reticulum (ER) stress, oxidative stress and organelle damage have been indicated to trigger autophagy in cells [27]. Interestingly, the role of FSS in the occurrence of autophagy is controversial. Grabias et al [28] revealed that FSS (2 and 4 dyn/cm2) increased type I collagen deposition and reduced cell motility and transmigration of proximal tubular epithelial cells (PTECs), suggesting that shear stress did not induce autophagy in proximal tubular epithelial cells. Conversely, King et al [29] noted that the autophagosome level increased rapidly in cells upon compression (0.2-1 kPa) and reverted to the basal levels after 90 min. Hep3B cells exposed to FSS of 0.5-12 dyn/cm2 exhibited autophagy and enhanced resistance to shear stress [30]. In this study, we also confirmed that 1.4 dyn/cm2 FSS could enhance cellular autophagy in both HepG2 and QGY-7703 cells. Besides, autophagy associated with cancer cell migration was investigated. We aimed to clarify: 1) whether FSS regulated hepatocellular carcinoma cell migration through the activation of autophagy. 2) Especially, to explore the potential mechanism of FSS-induced autophagy, and further regulated cell migration.
The occurrence of autophagy requires alterations in many in vitro functional markers, including the formation of autophagosomes, the distribution of LC3B and the expression of autophagy-related makers ATG5, ATG7, Beclin1, P62, LC3 Ⅱ/ Ⅰ in cells [31].The process of autophagy can be divided into three steps: 1) forming a liposome-like membrane structure in the cytoplasm, which is called phagophore; 2) extending, wrapping certain cytoplasm and organelles together to form autophagosomes. 3) autophagosomes and lysosomes fuse to form autophagic lysosomes, eventually autophagic substrates are degraded or sent back to the cytoplasm for reuse. The whole process of cell autophagy is described as autophagy flux [32]. In the current study, bilayer membrane structure of autophagosome was clearly observed at 0.5h, 1h, 2h group in HepG2 cells by TEM, while almost not observed in the control group (Figure 1). As a result, it preliminarily indicated that FSS could induce autophagy in HepG2 cells.
Effects of autophagy on the expression of Rac1, Rho A, and Cdc42. Western blot bands of Rac1, Rho A and Cdc42 in HepG2 cells (A) and QGY-7703 cells (B). FSS and EBSS upregulated Rac1, Rho A and Cdc42 level, which could be effectively suppressed by 3MA inhibitor. Quantification of Rac1, Rho A and Cdc42 level based on Western blot bands. The expression of GAPDH in each group was used as intrinsic controls, and relative expression of each protein /GAPDH were calculated. Values are presented as the mean ± SD of three independent experiments. *, P<0.05 vs CT; #, P<0.05 vs 0.5h group in HepG2 cells or 1h in QGY-7703 cells; &, P<0.05 vs EBSS group.
The microtubule-associated protein LC3B, a member of the highly conserved ATG8 protein family, is a central protein in the autophagy pathway that plays an important role in autophagy substrate selection and autophagosome formation. During the process of autophagy, LC3B will bind to autophagosomes, and LC3I gradually converted to LC3II, the ratio of LC3 Ⅱ/Ⅰ becomes higher [33, 34]. LC3B is the most widely used marker of autophagy flux [21]. Using mCherry-GFP-LC3B adenovirus infection of hepatocellular carcinoma cells, we can observe clearly that more yellow LC3B spots were clustered in the FSS group compared with the control group. With increased duration of exposing to FSS, the expression of LC3B enhanced (as shown in Figure 2). These results were consistent with previous studies, which further confirmed that exposing to FSS could induce autophagy in hepatoma carcinoma cells.
It has been well-demonstrated that autophagy depends on Atg5/Atg7, which is associated with microtubule-associated protein LC3 truncation and lipidation and may originate directly from the ER membrane and other membrane organelles. ATG5 and ATG7 regulate the formation of autophagosomes, but they are separated from autophagosomes after the formation of autophagosomes [35, 36]. Therefore, there is an upregulation in the expression of ATG5 and ATG7, but it may not be a positive correlation between the ATG5/ATG7 mRNA levels and the autophagosomes in the spatial-temporal distribution. Recently, Atg5/Atg7-independent pathway in autophagy has been identified. This pathway of autophagy was not associated with LC3 processing but appeared to involve autophagosome formation from late endosomes and the trans-Golgi [37]. Atg7-independent autophagy had been implicated in mitochondrial clearance from reticulocytes [38]. Beclin1 is required for Atg5/Atg7-dependent and -independent autophagy. This protein interacts with BCL-2 or PI3K class III and plays a key role in the regulation of autophagy and cell death [31]. However, a research suggested that despite its sustained expression, Beclin-1 was dispensable for autophagy induction in ovarian tumor cells in vitro, which may be retained to promote cell viability by a mechanism independent of autophagy or apoptosis regulation [39]. P62, an autophagosome that is targeted for degradation by interaction with GATA4, which inhibits GATA-4-related senescence and senescence-associated secretory phenotypes [40, 41]. P62 protein is an autophagic substrate that is selectively degraded. There is an inverse relationship between the amount of P62 protein and the autophagic flux. The detection of P62 protein by Western Blot can be used to evaluate the autophagy and the flux of autophagy.
Large number of studies have confirmed that cells rapidly responded to biophysical factors such as shear stress (ranged from 10min to 2h) [13, 42], which are faster than biochemical factors [43, 44]. Our studies determined the effects of FSS on the expression of ATG5, ATG7, Beclin-1 and P62 at mRNA and protein levels, respectively. The results showed that the expression levels of these proteins changed with FSS stimulation in a time-dependent manner (Figure 3 and 4). In HepG2 cells, the expression of ATG5, ATG7 and Beclin1 reached the peak at 0.5h, decreased to the control level at 1h and 2h, and subsequently up-regulated again at 4h. The ratio of LC3 Ⅱ/Ⅰ also significantly increased at 0.5h, 2h, 4h in HepG2 cells, but there was no statistical difference between 1h and CT group. However, in QGY-7703 cells, the expression of these three proteins peaked at 1h, and the ratio of LC3 Ⅱ/Ⅰ significantly increased at 1h. In addition, our results indicated that the expression of P62 protein in both cells reached the lowest value in the 2h group. Compared with other marker proteins that the peak of expression appeared at 0.5h and 1h, the degradation of P62 protein was delayed. We speculated that the degradation of P62 protein may retard behind the expression of ATG5, ATG7 and Beclin1. By synthetically analyzing the mRNA levels and protein expression of autophagy-related genes, we concluded that FSS could induce the rapid occurrence of autophagy in hepatoma cells (0.5h in HepG2 cells and 1h in QGY-7703 cells, respectively), which is consistent with previous findings.
To investigate the effects of FSS-induced autophagy on cell migration, scratch tests were performed. It is known that FSS regulated cell migration, independent of autophagy [13]. It is difficult to determine whether the enhanced migration was induced by autophagy process or by FSS. As an inhibitor of autophagy, 3MA is widely used in the literature to inhibit autophagy through the Class III PI3K pathway [45]. Recent studies have shown that 3MA also has a sustained inhibitory effect on class I PI3K [46]. Our results suggested that FSS induced the occurrence of autophagy, which accompanied by significantly enhanced liver cancer cell migration ability and the inhibition of autophagy decreased its migration (Figure 5).
PI3K/AKT/mTOR cascade is regarded as a classic signaling pathway in mediating the occurrence of autophagy [16]. 3MA is a well-established autophagy inhibitor, which targeted on Class III PI3K [45]. Our previous studies have confirmed that FSS regulated endothelial cell and tumor cell migration through Integrins-FAK-Rho GTPases signaling pathway [13]. As a crucial downstream regulator of PI3K, FAK leads to a cascade of activation of other downstream signal pathways [14], which is involved in autophagy induction [15]. To further explore whether FSS-induced autophagy depends on PI3K-FAK-Rho GTPases signaling pathway, the expression of PI3K, FAK and several small G proteins were examined. It was found that FSS and EBSS significantly up-regulated the expression of PI3K, FAK and Rho GTPases, which could be inhibited by 3MA (Figure 6 and 7). The results indicated that the occurrence of FSS-induced autophagy in hepatocellular carcinoma cells improved its migration ability, which is related to PI3K-FAK-Rho GTPases signaling pathway. Based on the current results, we demonstrated that the FSS-induced autophagy enhanced cell motility by Rho GTPases. However, whether Rho GTPases are required for FSS-induced autophagy remains unclear. A recent report indicated that the small GTPase functioned as an organizer for autophagosome biogenesis [47]. On the contrary, other studies previously reported a negative role of Rho GTPases in regulating autophagy activation [36].
In addition, recent publications proposed that autophagy promoted FA disassembly and cell motility of metastatic tumor cells through the direct interaction of Paxillin with LC3. The key FA protein paxillin is degraded by autophagy, and paxillin is targeted to the autophagosome through the Src-regulated interaction of LC3 with a conserved LC3-interacting region (LIR) in paxillin [48-50]. Other data demonstrated that autophagy positively regulated TGF β1-induced EMT in non-small cell lung cancer (NSCLC) cells, thereby promoting tumor cell migration [51]. Interestingly, Shen et al [52] demonstrated that Ubiquitin conjugating E2 enzyme variant proteins 1 (Ube2v1) promotes EMT and metastasis in colorectal cancer by epigenetically transcriptional suppression of autophagy.
In conclusion, we demonstrated FSS could induce autophagy in hepatocellular carcinoma cells in vitro in a time-dependent manner. The FSS-induced autophagy was triggered in a relatively short duration and enhanced the migration of hepatocellular carcinoma cells, which was dependent on the PI3K-FAK-Rho GTPases signaling pathway. These findings clarified the role of FSS in the occurrence of autophagy during tumor progression, which may provide a potential clinical strategy for the treatment of liver carcinoma.
Acknowledgements
This study was supported by National Natural Science Foundation of China (31670960, 31570948).
Competing Interests
The authors have declared that no competing interest exists.
References
1. Zhu AX, Duda DG, Sahani DV, Jain RK. HCC and angiogenesis: possible targets and future directions. Nat Rev Clin Oncol. 2011;8:292-301
2. Mizushima N, Levine B. Autophagy in mammalian development and differentiation. Nat Cell Biol. 2010;12:823-30
3. Jiang P, Mizushima N. Autophagy and human diseases. Cell Res. 2014;24:69-79
4. Tian Y, Wang L, Ou JH. Autophagy, a double-edged sword in hepatocarcinogenesis. Mol Cell Oncol. 2015;2:e1004968
5. Coly PM, Gandolfo P, Castel H, Morin F. The Autophagy Machinery: A New Player in Chemotactic Cell Migration. Front Neurosci. 2017;11:78
6. Tarbell JM, Shi ZD, Dunn J, Jo H. Fluid Mechanics, Arterial Disease, and Gene Expression. Annu Rev Fluid Mech. 2014;46:591-614
7. Zhang C, Zhang X, Xu R, Huang B, Chen AJ, Li C. et al. TGF-beta2 initiates autophagy via Smad and non-Smad pathway to promote glioma cells' invasion. J Exp Clin Cancer Res. 2017;36:162
8. Chung SJ, Nagaraju GP, Nagalingam A, Muniraj N, Kuppusamy P, Walker A. et al. ADIPOQ/adiponectin induces cytotoxic autophagy in breast cancer cells through STK11/LKB1-mediated activation of the AMPK-ULK1 axis. Autophagy. 2017;13:1386-403
9. Li TT, Zhu D, Mou T, Guo Z, Pu JL, Chen QS. et al. IL-37 induces autophagy in hepatocellular carcinoma cells by inhibiting the PI3K/AKT/mTOR pathway. Mol Immunol. 2017;87:132-40
10. Mitchell MJ, King MR. Computational and experimental models of cancer cell response to fluid shear stress. Frontiers in Oncology. 2013:3 MAR (no pagination)
11. Wang P, Chen SH, Hung WC, Paul C, Zhu F, Guan PP. et al. Fluid shear promotes chondrosarcoma cell invasion by activating matrix metalloproteinase 12 via IGF-2 and VEGF signaling pathways. Oncogene. 2015;34:4558-69
12. Mowers EE, Sharifi MN, Macleod KF. Autophagy in cancer metastasis. Oncogene. 2017;36:1619-30
13. Yu H, Shen Y, Jin J, Zhang Y, Feng T, Liu X. Fluid shear stress regulates HepG2 cell migration though time-dependent integrin signaling cascade. Cell Adh Migr. 2018;12:56-68
14. Reiske HR, Kao SC, Cary LA, Guan JL, Lai JF, Chen HC. Requirement of phosphatidylinositol 3-kinase in focal adhesion kinase-promoted cell migration. J Biol Chem. 1999;274:12361-6
15. Kim M, Park HL, Park HW, Ro SH, Nam SG, Reed JM. et al. Drosophila Fip200 is an essential regulator of autophagy that attenuates both growth and aging. Autophagy. 2013;9:1201-13
16. Dikic I, Elazar Z. Mechanism and medical implications of mammalian autophagy. Nat Rev Mol Cell Biol. 2018;19:349-64
17. Cain RJ, Ridley AJ. Phosphoinositide 3-kinases in cell migration. Biol Cell. 2009;101:13-29
18. Chai R, Fu H, Zheng Z, Liu T, Ji S, Li G. Resveratrol inhibits proliferation and migration through SIRT1 mediated posttranslational modification of PI3K/AKT signaling in hepatocellular carcinoma cells. Mol Med Rep. 2017;16:8037-44
19. Wang H, Wang B, Liao Q, An H, Li W, Jin X. et al. Overexpression of RhoGDI, a novel predictor of distant metastasis, promotes cell proliferation and migration in hepatocellular carcinoma. FEBS Lett. 2014;588:503-8
20. Ghasemi A, Hashemy SI, Aghaei M, Panjehpour M. RhoA/ROCK pathway mediates leptin-induced uPA expression to promote cell invasion in ovarian cancer cells. Cell Signal. 2017;32:104-14
21. Perry G. Erratum to: Guidelines for the use and interpretation of assays for monitoring autophagy (3rd edition) (Autophagy, 12, 1, 1-222. Autophagy. 2016;12:443
22. Nyberg P, Salo T, Kalluri R. Tumor microenvironment and angiogenesis. Front Biosci. 2008;13:6537-53
23. Jain RK, Martin JD, Stylianopoulos T. The role of mechanical forces in tumor growth and therapy. Annu Rev Biomed Eng. 2014;16:321-46
24. Wang P, Guan PP, Wang T, Yu X, Guo JJ, Konstantopoulos K. et al. Interleukin-1beta and cyclic AMP mediate the invasion of sheared chondrosarcoma cells via a matrix metalloproteinase-1-dependent mechanism. Biochim Biophys Acta. 2014;1843:923-33
25. Guan PP, Yu X, Guo JJ, Wang Y, Wang T, Li JY. et al. By activating matrix metalloproteinase-7, shear stress promotes chondrosarcoma cell motility, invasion and lung colonization. Oncotarget. 2015;6:9140-59
26. Fan Q, Yang L, Zhang X, Ma Y, Li Y, Dong L. et al. Autophagy promotes metastasis and glycolysis by upregulating MCT1 expression and Wnt/beta-catenin signaling pathway activation in hepatocellular carcinoma cells. J Exp Clin Cancer Res. 2018;37:9
27. Burman C, Ktistakis NT. Autophagosome formation in mammalian cells. Seminars In Immunopathology. 2010;32:397-413
28. Grabias BM, Konstantopoulos K. Epithelial-mesenchymal transition and fibrosis are mutually exclusive reponses in shear-activated proximal tubular epithelial cells. FASEB J. 2012;26:4131-41
29. King JS, Veltman DM, Insall RH. The induction of autophagy by mechanical stress. Autophagy. 2011;7:1490-9
30. Lien SC, Chang SF, Lee PL, Wei SY, Chang MD, Chang JY. et al. Mechanical regulation of cancer cell apoptosis and autophagy: roles of bone morphogenetic protein receptor, Smad1/5, and p38 MAPK. Biochim Biophys Acta. 2013;1833:3124-33
31. Kang R, Zeh HJ, Lotze MT, Tang D. The Beclin 1 network regulates autophagy and apoptosis. Cell Death Differ. 2011;18:571-80
32. Kaizuka T, Morishita H, Hama Y, Tsukamoto S, Matsui T, Toyota Y. et al. An Autophagic Flux Probe that Releases an Internal Control. Mol Cell. 2016;64:835-49
33. Kirisako T, Ichimura Y, Okada H, Kabeya Y, Mizushima N, Yoshimori T. et al. The reversible modification regulates the membrane-binding state of Apg8/Aut7 essential for autophagy and the cytoplasm to vacuole targeting pathway. Journal of Cell Biology. 2000;151:263-76
34. Ohsumi Y. Molecular dissection of autophagy: two ubiquitin-like systems. Nature Reviews Molecular Cell Biology. 2001;2:211-6
35. Chandrasekar T, Evans CP. Autophagy and urothelial carcinoma of the bladder: A review. Investig Clin Urol. 2016;57(Suppl 1):S89-97
36. Dower CM, Wills CA, Frisch SM, Wang HG. Mechanisms and context underlying the role of autophagy in cancer metastasis. Autophagy. 2018:1-19
37. Nishida Y, Arakawa S, Fujitani K, Yamaguchi H, Mizuta T, Kanaseki T. et al. Discovery of Atg5/Atg7-independent alternative macroautophagy. Nature. 2009;461:654-8
38. Zhang J, Randall MS, Loyd MR, Dorsey FC, Kundu M, Cleveland JL. et al. Mitochondrial clearance is regulated by Atg7-dependent and -independent mechanisms during reticulocyte maturation. Blood. 2009;114:157-64
39. Correa RJ, Valdes YR, Shepherd TG, DiMattia GE. Beclin-1 expression is retained in high-grade serous ovarian cancer yet is not essential for autophagy induction in vitro. J Ovarian Res. 2015;8:52
40. Devergne O, Hummel M, Koeppen H, Le Beau MM, Nathanson EC, Kieff E. et al. A novel interleukin-12 p40-related protein induced by latent Epstein-Barr virus infection in B lymphocytes. Journal of Virology. 1996;70:1143-53
41. Cassidy LD, Narita M. CELL BIOLOGY. GATA get a hold on senescence. Science. 2015;349:1448-9
42. Zhang B, Hou R, Zou Z, Luo T, Zhang Y, Wang L. et al. Mechanically induced autophagy is associated with ATP metabolism and cellular viability in osteocytes in vitro. Redox Biol. 2018;14:492-8
43. Shi YH, Ding ZB, Zhou J, Hui B, Shi GM, Ke AW. et al. Targeting autophagy enhances sorafenib lethality for hepatocellular carcinoma via ER stress-related apoptosis. Autophagy. 2011;7:1159-72
44. Alirezaei M, Kemball CC, Flynn CT, Wood MR, Whitton JL, Kiosses WB. Short-term fasting induces profound neuronal autophagy. Autophagy. 2010;6:702-10
45. Wu Y, Wang X, Guo H, Zhang B, Zhang XB, Shi ZJ. et al. Synthesis and screening of 3-MA derivatives for autophagy inhibitors. Autophagy. 2013;9:595-603
46. Wu YT, Tan HL, Shui G, Bauvy C, Huang Q, Wenk MR. et al. Dual role of 3-methyladenine in modulation of autophagy via different temporal patterns of inhibition on class I and III phosphoinositide 3-kinase. Journal of Biological Chemistry. 2010;285:10850-61
47. Song Y, Shang D, Cheng H, Zhou R. The small GTPase RAB37 functions as an organizer for autophagosome biogenesis. Autophagy. 2018;14:727-9
48. Mowers EE, Sharifi MN, Macleod KF. Novel insights into how autophagy regulates tumor cell motility. Autophagy. 2016;12:1679-80
49. Sharifi MN, Mowers EE, Drake LE, Collier C, Chen H, Zamora M. et al. Autophagy Promotes Focal Adhesion Disassembly and Cell Motility of Metastatic Tumor Cells through the Direct Interaction of Paxillin with LC3. Cell Reports. 2016;15:1660-72
50. Wildenberg ME, Koelink PJ, Diederen K, Te Velde AA, Wolfkamp SCS, Nuij VJ. et al. The ATG16L1 risk allele associated with Crohn's disease results in a Rac1-dependent defect in dendritic cell migration that is corrected by thiopurines. Mucosal Immunology. 2017;10:352-60
51. Ghavami S, Alizadeh J, Klonisch T, Thliveris J. Autophagy inhibition directs the epithelial to mesenchymal transition in non-small lung cancer cells. Iranian Journal of Biotechnology. 2017 ISSUE): 34-5
52. Shen T, Cai DL, Liu HY, Gan JW, Li M, Wang RJ. et al. Ube2v1 promotes epithelial mesenchymal transition and metastasis in colorectal cancer by epigenetically transcriptional suppression of autophagy. Cancer Research Conference: American Association for Cancer Research Annual Meeting. 2017:77
Author contact
![]() Corresponding authors: Institute of Biomedical Engineering, West China School of Basic Medical Sciences & Forensic Medicine, Sichuan University, Chengdu 610041, China. Email address: Yang Shen (shenyang24com) and Xiaoheng Liu (liuxiaohgedu.cn)
Corresponding authors: Institute of Biomedical Engineering, West China School of Basic Medical Sciences & Forensic Medicine, Sichuan University, Chengdu 610041, China. Email address: Yang Shen (shenyang24com) and Xiaoheng Liu (liuxiaohgedu.cn)

 Global reach, higher impact