Impact Factor ISSN: 1449-2288
- Issue 12; 2026
- Issue 11; 2026
- Issue 10; 2026
- Issue 9; 2026
- Issue 8; 2026
- Volume 22; 2026
- Past Issues
- Advance Articles
- Editorial Board
- Cover Images
- Index & Coverage
- Cover Suggestion
- Special Issues
Introduction
Materials and Methods
Results
Discussion
Abbreviations
Supplementary Material
Acknowledgements
References

 Global reach, higher impact
Int J Biol Sci 2018; 14(11):1571-1585. doi:10.7150/ijbs.25328 This issue Cite
Research Paper
Genome-Wide Chromatin Structure Changes During Adipogenesis and Myogenesis
Mengnan He1,2*, Yan Li1,2*, Qianzi Tang1,2*, Diyan Li1,2, Long Jin1,2, Shilin Tian3, Tiandong Che1,2, Shen He1,2, Lamei Deng3, Guangliang Gao1,2,4, Yiren Gu5, Zhi Jiang3, Xuewei Li1,2 ![]() , Mingzhou Li1,2
, Mingzhou Li1,2 ![]()
1. Institute of Animal Genetics and Breeding, College of Animal Science and Technology, Sichuan Agricultural University, Chengdu 611130, China;
2. Farm Animal Genetic Resources Exploration and Innovation Key Laboratory of Sichuan Province, Sichuan Agricultural University, Chengdu 611130, China;
3. Novogene Bioinformatics Institute, Beijing 100089, China;
4. Chongqing Academy of Animal Sciences, Chongqing 402460, China;
5. Animal Breeding and Genetics Key Laboratory of Sichuan Province, Pig Science Institute, Sichuan Animal Science Academy, Chengdu 610066, China.
*These authors contributed equally to this work.
Received 2018-2-3; Accepted 2018-7-29; Published 2018-9-7
Abstract

The recently developed high-throughput chromatin conformation capture (Hi-C) technology enables us to explore the spatial architecture of genomes, which is increasingly considered an important regulator of gene expression. To investigate the changes in three-dimensional (3D) chromatin structure and its mediated gene expression during adipogenesis and myogenesis, we comprehensively mapped 3D chromatin organization for four cell types (3T3-L1 pre-adipocytes, 3T3-L1-D adipocytes, C2C12 myoblasts, and C2C12-D myotubes). We demonstrate that the dynamic spatial genome architecture affected gene expression during cell differentiation. A considerable proportion (~22%) of the mouse genome underwent compartment A/B rearrangement during adipogenic and myogenic differentiation, and most (~80%) upregulated marker genes exhibited an active chromatin state with B to A switch or stable A compartment. More than half (65.4%-73.2%) of the topologically associating domains (TADs) are dynamic. The newly formed TAD and intensified local interactions in the Fabp gene cluster indicated more precise structural regulation of the expression of pro-differentiation genes during adipogenesis. About half (32.39%-59.04%) of the differential chromatin interactions (DCIs) during differentiation are promoter interactions, although these DCIs only account for a small proportion of genome-wide interactions (~9.67% in adipogenesis and ~4.24% in myogenesis). These differential promoter interactions were enriched with promoter-enhancer interactions (PEIs), which were mediated by typical adipogenic and myogenic transcription factors. Differential promoter interactions also included more differentially expressed genes than nonpromoter interactions. Our results provide a global view of dynamic chromatin interactions during adipogenesis and myogenesis and are a resource for studying long-range chromatin interactions mediating the expression of pro-differentiation genes.
Keywords: Adipogenesis, Myogenesis, Compartment A/B, Topologically associating domain, Differential chromatin interaction, Gene expression.
Introduction
Adipose tissue and skeletal muscle tissue are two important organs involved in energy metabolism and physical movement [1, 2]. Adipose tissue not only cushions and insulates the body and stores energy in the form of lipids but also secretes adipokines that regulate systemic processes such as food intake and nutrient metabolism, insulin sensitivity, glucose homeostasis, cell proliferation, inflammation, and angiogenesis [3, 4]. Skeletal muscle is associated with insulin-dependent glucose metabolism, and its contraction produces myokine control adaptive processes in skeletal muscle by regulating fuel oxidation, hypertrophy, angiogenesis, and inflammatory processes [1, 5]. Both adipose- and skeletal muscle-derived adipokines and myokines have detrimental or beneficial effects in the prevention and treatment of metabolic diseases such as obesity and type II diabetes [6, 7]. Therefore, research on adipose and skeletal muscle development and function should help to improve human health.
Adipogenic differentiation and myogenic differentiation are essential developmental processes of adipose and skeletal muscle, regulated by complex molecular networks and epigenetic modifications [8-11]. Adipogenesis and myogenesis marker genes (e.g., PPARG, CEBPA, and FABP4 in adipocytes, and MRFs and MHC in myotubes) were shown to be activated during differentiation, accompanied by changes in cell morphology (lipid droplet accumulation of adipocytes and fusion of myoblasts into multinucleated myotubes, respectively) [12, 13]. Adipogenesis- and myogenesis-associated expression of PPARG and FRG1 was found to be regulated by long-range chromatin interactions, respectively, suggesting the modulatory role of spatial chromatin structure in adipogenesis and myogenesis [14, 15]. Investigation of the higher-order chromatin interactions can explain the complex molecular regulatory network that functions during adipogenic and myogenic differentiation [16-18].
Here, we use the high-throughput chromatin conformation capture (Hi-C) technology to explore the chromatin folding during adipogenic and myogenic differentiation. We determined the global similarity and divergence of chromatin folding and compared the spatial chromatin structure for three structural units of chromatin folding [epigenetic modification-determined compartment A/B, self-associating topologically associating domains (TADs), and potential chromatin loops (putative promoter interactions)]. We further evaluated the relationship between dynamic chromatin interactions and the expression of genes that promote cell differentiation. We found that both adipogenesis and myogenesis were associated with numerous dynamic chromatin structures at these three features, accompanied by coordinated gene expression. Our findings should contribute to future study on the long-range control of gene expression during adipogenesis and myogenesis.
Materials and Methods
Cell culture and in vitro differentiation
C2C12 myoblasts were obtained from the Cell Resource Center, Peking Union Medical College (Beijing, China). 3T3-L1 pre-adipocytes were obtained from the Type Culture Collection of the Chinese Academy of Sciences (Shanghai, China). Proliferating C2C12 and 3T3-L1 were grown in Dulbecco's modified Eagle's medium (DMEM) containing 10% fetal bovine serum (FBS) and 1× penicillin/streptomycin, incubated at 37 °C in 5% CO2 atmosphere. 3T3-L1-D adipocytes and C2C12-D myotubes were derived from 3T3-L1 and C2C12, respectively.
When becoming 90% confluent, 3T3-L1 were induced to undergo differentiation as previously described [19]. Briefly, two days' post-confluence, cells were exposed to differentiation medium containing 0.5 mmol/L isobutylmethylxanthine, 1 µmol/L dexamethasone, 850 nmol/L insulin, 1 µmol/L rosiglitazone, and 10% FBS for three days. At the end of day 3, the differentiation medium was replaced with maintenance medium with only 850 nmol/L insulin, 1 µmol/L rosiglitazone, and 10% FBS, and replenished every other day. After the differentiation process, at least 90% of the cells had accumulated lipid droplets at day 10, which were then used as mature adipocytes (3T3-L1-D).
To induce myogenic differentiation, when about 80% cell confluence of proliferating C2C12 was attained, the medium containing 10% FBS was substituted with 2% horse serum and replenished every other day. Myotubes were formed at day 4 after differentiation induction [20]. We used the induced myoblasts at day 8 as mature myocytes (C2C12-D) as most myotubes had been completely formed by that stage.
Oil Red O staining
Lipid droplets in differentiated 3T3-L1-D adipocytes were stained using Oil Red O as follows. Oil Red O stock solution (0.35% w/v) dissolved in isopropanol was stirring overnight. Then diluted in water (6:4) to obtain fresh Oil Red O working solution and filtered by 0.2 μm nitrocellulose membrane. Cells grown on 3-cm-diameter culture dishes were washed three times with 1× PBS, then fixed for 20 minutes with 4% paraformaldehyde. After fixation, cells were washed with 1× PBS, then were added with the Oil Red O working solution for 1 hour at room temperature (20-25 °C). Subsequently, cells were washed with 1× PBS and 60% isopropanol and were used for microscopy analysis.
Hi-C experiment
Hi-C libraries from four cell types were generated according to the previously published Hi-C protocol with some minor modifications [21]. Briefly, 25 million (M) cells were resuspended in 45 ml serum free DMEM, and 37% formaldehyde was added to obtain a final concentration of 2% for chromatin cross-linking. Cells were incubated at room temperature for 5 minutes, then glycine was added to obtain a final concentration of 0.25 mol/L to quench the formaldehyde. The mixture was incubated at room temperature for 5 minutes, and subsequently on ice for at least 15 minutes. Fixed cells were lysed using a Dounce homogenizer in the presence of cold lysis buffer (10 mmol/L Tris-HCl, pH 8.0, 10 mmol/L NaCl, 0.2% IGEPAL CA-630, and 1× protease inhibitor solution). Chromatin digestion, labelling, and ligation steps were performed according to the original protocol [21]. After deproteinization, removal of biotinylated free-ends, and DNA purification, Hi-C libraries were controlled for quality and sequenced on an Illumina Hiseq X Ten sequencer (paired-end sequencing with 150 bp in read length).
Hi-C reads mapping, filtering, and generation of contact matrices
Initial Hi-C data analyses including reads mapping, filtering, and bias correction were conducted by Hiclib (https://bitbucket.org/mirnylab/hiclib). The high quality paired-end reads were mapped to the mouse genome (GRCm38 or mm10) by Bowtie2 (--very-sensitive) through iterative mapping. Mapped reads were filtered using Hiclib with default parameters [22], discarding the invalid self-ligated and un-ligated fragments, as well as PCR artefacts. Valid Hi-C read pairs harbored more intrachromosomal (cis) interactions than inter- (trans) (Table S1). Normalized interaction matrices were generated at four resolutions from low to high, 1 Mb, 500 kb, 100 kb, and 40 kb, respectively.
Interchromosomal interaction matrices
Interchromosomal interaction matrices were generated by calculating the expected number of interchromosomal interactions for chromosome pair i,j [21]. We multiplied the fraction of interchromosomal read pairs containing i with the fraction of interchromosomal read pairs containing j, then multiplied by the total number of interchromosomal read pairs. Next, we computed the enrichment by dividing the observed interaction number between i and j by the expected value.
Identification of compartment A and B
Identification of compartment A/B was performed as previously described using the 40-kb interaction matrix [21]. Briefly, principal component analysis was performed to generate PC1 vectors of each chromosome, Spearman's correlation between PC1 and genomic characteristics (gene density and GC content) were calculated. GC content (%) for each bin (1-Mb and 40-kb bin sizes) was calculated by nuc implemented in bedtools (v2.26.0). Gene density (number of genes per bin) was calculated based on the number of promoter (from -2,000 to +500 bp of TSS) located in (namely more than 50% length overlapped with) each bin. Compartment A and B were determined by the PC1 values. Bins with positive Spearman's correlation between PC1 values and genomic features were defined as compartment A, otherwise B.
To evaluate the compartmentalization of the each chromosome of the genome, we introduced the compartment strength as the square root of (AA×BB)/AB2, where AA is the mean contact enrichment (log2 ratio of observed/expected) between pairs of bins with a strong compartment A signal (those with PC1 values from the top 20% of each chromosome), BB is the mean contact enrichment between pairs of bins with a strong compartment B signal (those with PC1 values from the bottom 20% of each chromosome), and AB is the mean contact depletion between pairs of bins with a strong compartment A and B signal [23, 24].
Identification of topologically associating domains (TADs) and topological boundaries
The normalized contact matrix was used to identify the TAD units as previously reported [25]. Directionality index (DI) was calculated from upstream 2 Mb to downstream 2 Mb along the center of each bin at 40-kb resolution, and hidden Markov model (HMM) was then used to predict the states of DI for final TAD generation. We used the same criteria 400 kb (distance between two adjacent TADs) to distinguish unorganized chromatin from topological boundaries. That is, the topological boundaries are less than 400 kb and unorganized chromatin are larger than 400 kb.
Boundary correlation between samples was performed as previously described [25]. We merged the center positions of the boundaries in two samples and calculated the directionality indexes of ±10 bins for each center. Then we randomly selected 20 bins from each of the two samples and calculated the Spearman's correlation between the two vectors. We attained the random distribution of Spearman's correlation coefficients by repeating the randomization 10,000 times. We defined values at the top 1% of distribution as the threshold of significant correlation. Boundaries were identified as “cell type specific” if the boundary regions were called in only one sample and lacked a significant correlation in directionality index between the two samples compared.
Identification of differential chromatin interactions
We identified the differential chromatin interactions (DCIs) by using the HOMER software [26], which containing two steps. The first step is to search for pairs of bins that have greater number of Hi-C interaction counts than those expected by chance (referred to “significant interactions”, namely high confidence interactions) (binomial test). Secondly, these high confidence interactions were used to find DCIs between two Hi-C experiments with default parameters.
We kept the interactions supported by > 20 counts and spanned within 2 Mb with Benjamini corrected FDR of binomial test < 0.01 as high confidence interactions and used them to identify DCIs. DCIs were determined by natural logP and fold change of interaction frequency of Primary Experiment vs. Background (P < 0.001 and fold change > 1.5).
In the two samples compared, each one was used as background, and obtained one set of DCIs that has significantly higher interaction frequency in the other than the background, which were called higher DCIs. Both two sets were defined as DCIs in this paper.
Putative promoter-enhancer interactions
Promoter segment was determined as a region from -2,000 to +500 bp of the transcription start site (TSS). When at least half of a promoter segment was in either one of the two bins which involved in a chromatin interaction, this interaction was defined as a putative promoter interaction.
The predicted mouse enhancer coordinates relative to mm9 were downloaded from the FANTOM Data Resources (http://fantom.gsc.riken.jp/5/datafiles/latest/extra/Enhancers/) and were converted to mm10 by using the liftOver tool. When at least one enhancer was in either one of the two bins which involved in a chromatin interaction and one promoter in the other, this interaction was determined as a putative promoter-enhancer interaction (PEI).
Publicly available ChIP-seq peak data of transcription factor (TF) Cebpb for 3T3-L1; Cebpa, Cebpb, and Pparg for 3T3-L1-D; Myod and Myog for C2C12; and MEF2A, MEF2D, Myod, and Myog for C2C12-D were downloaded from the NCBI's Gene Expression Omnibus database (Table S2). Putative PEIs between a bin classified as a promoter and a bin classified as an enhancer that overlapped with ChIP-seq peaks (more than 60% in length) were considered as the TF-mediated active PEIs.
Histone modification and accessibility of chromatin
Available ChIP-seq data of active histone mark H3K4me3 of 3T3-L1 (signal) and C2C12 (peaks), ChIP-seq data of architectural protein CTCF of 3T3-L1 (signal) and C2C12 (signal), and ATAC-seq data of C2C12 (peaks) and C2C12-D (peaks) were downloaded from the GEO database (Table S2). Signal or peak coordinates relative to mm9 were converted to mm10 by using the liftOver tool.
For compartment A/B, we divided the continuous compartment A or B intervals into 40 equable segments and calculated the signal value or peak number of each segments, as well as other 20 segments upstream or downstream of the compartment borders.
For TAD boundary, we first identified the mid-point of each TAD boundary, then calculated the signal value or peak number in 10-kb bins for ± 500 kb from the mid-point of boundary, as well as the TSS number [25].
RNA-seq
Same batch of cells in Hi-C experiment was used for the construction of RNA library. Cells were treated with Trizol reagent, and total RNA was extracted according to the manufacture's protocols. Strand-specific RNA libraries were constructed following the manufacture's standard procedures, then sequenced on Illumina HiSeq X Ten sequencer, generating a total of ~46.60 Gb data (Table S3).
High-quality reads were obtained by discarding reads that containing over 10% Ns (uncalled bases) or reads with > 10 nt aligned to the adapter (allowing ≤ 10% mismatches) or reads including over 50% of bases with base quality score less than five. The remaining reads were aligned to the mouse reference genome (GRCm38 or mm10) by using Tophat version 2.0.11 [27]. Cufflinks (version 2.2.1) [28] was used to quantify gene expression. Only protein coding genes with FPKM (denoted as fragments per kilobase of transcript per million mapped reads) > 0.5 in at least one of the samples were kept for subsequent analyses. A total of 12,753 protein coding genes were expressed in at least one sample with FPKM > 0.5 (11,204 in pre-adipocytes, 11,347 in adipocytes, 11,096 in myoblasts, and 11,458 in myotubes, respectively.) (Table S3). DEGseq was applied to detect differentially expressed genes (DEGs) based on the read count produced by HTseq [29]. Genes with P < 0.001 and Benjamini-adjusted P < 0.05 were identified as DEGs.
Functional enrichment analysis
The Enrichr web server (http://amp.pharm.mssm.edu/Enrichr/) was used to perform gene functional enrichment analysis of Gene Ontology (GO) and KEGG pathway categories [30, 31]. Only GO-BP (GO Biological Processes), GO-MF (GO Molecular Function) terminologies, and KEGG pathways with adjusted P < 0.05 and combined score > 10 were considered to be significant and retained in the list.
Results
Similar nonrandom positioning of chromosomes in nucleus across cell types
We first established adipogenic and myogenic differentiation models. Briefly, 3T3-L1-D adipocytes and C2C12-D myotubes were obtained by inducing the differentiation of 3T3-L1 pre-adipocytes and C2C12 myoblasts, respectively. We observed numerous varied sizes of lipid droplets in 3T3-L1-D, and multinucleated myotubes in C2C12-D (Figure S1A). The well-characterized marker genes during adipogenesis and myogenesis were significantly upregulated after differentiation (DEG-seq analysis, P < 0.001 and FDR < 0.05) (Figure S1B).
Hi-C libraries of the four cell types (3T3-L1, C2C12, 3T3-L1-D, and C2C12-D) were separately constructed and sequenced using the Illumina Hiseq X Ten platform, generating ~696.14 M read pairs for each library (Table S1). After the filtering of invalid read pairs (see Materials and methods) by using the Hiclib pipeline [22], ~332.40 M unique Hi-C read pairs (359.82 M in 3T3-L1, 322.22 M in 3T3-L1-D, 336.15 in C2C12, and 311.42 M in C2C12-D) were kept as authentic interactions. Among these, cis interactions are the dominant chromatin contacts, of which ~67.87% occurred within single chromosome and ~32.13% between chromosomes (Figure S2, Table S1). The probabilities of interchromosomal contact between pairs of chromosomes revealed that chromosomes are nonrandomly distributed in the mouse nucleus. Similar relative positions of chromosomes were found during differentiation and between cell types, that the longer chromosomes (Chr. 1 to 6) were in a proximately spatial position with more frequent interactions with each other than with the shorter ones (Chr. 15 to 19), and the shorter ones preferentially contacted with each other more frequently (Figure S3A). Consistent with previous findings [21, 26, 32], we also found a significantly negative correlation between trans contact probability and differences of chromosome length (Pearson's r = -0.39, -0.38, -0.17, and -0.21 in 3T3-L1, 3T3-L1-D, C2C12, and C2C12-D, respectively, P < 0.05) (Figure S3B), which is an intrinsic property of chromatin folding [33].
Global chromatin structure conservation and divergence
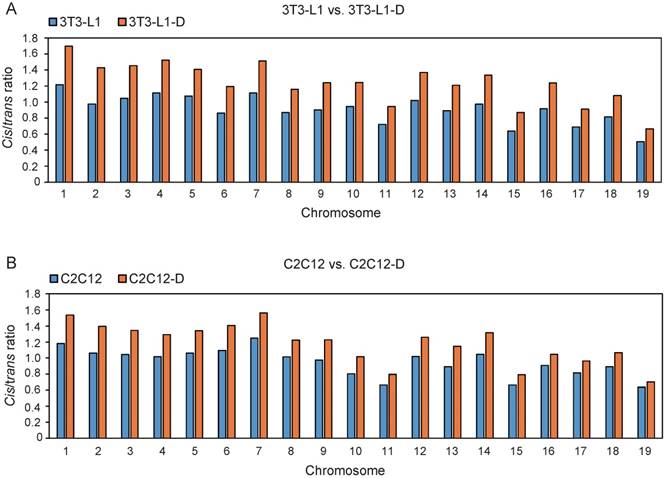
It is well documented that the linear genome interacts much more frequently and reproducibly in cis than in trans in a cell population [34]. Thus, we investigated the genome-wide chromatin interactions by using the prominent cis interactions, which exhibited a significant increase during adipogenesis and myogenesis, with a higher cis/trans ratio after differentiation (Student's t-test, P ≤ 2.75×10⁻¹⁰) (Figure 1).
Significant increase of cis interactions during adipogenesis and myogenesis. The ratio of cis/trans interactions of 19 euchromosomes in 3T3-L1 and 3T3-L1-D (A), C2C12 and C2C12-D (B). The ratio in 3T3-L1-D is significantly higher than in 3T3-L1 (Student's t-test, P = 1.51×10⁻¹²). The ratio in C2C12-D is significantly higher than in C2C12 (Student's t-test, P = 2.75×10⁻¹⁰).
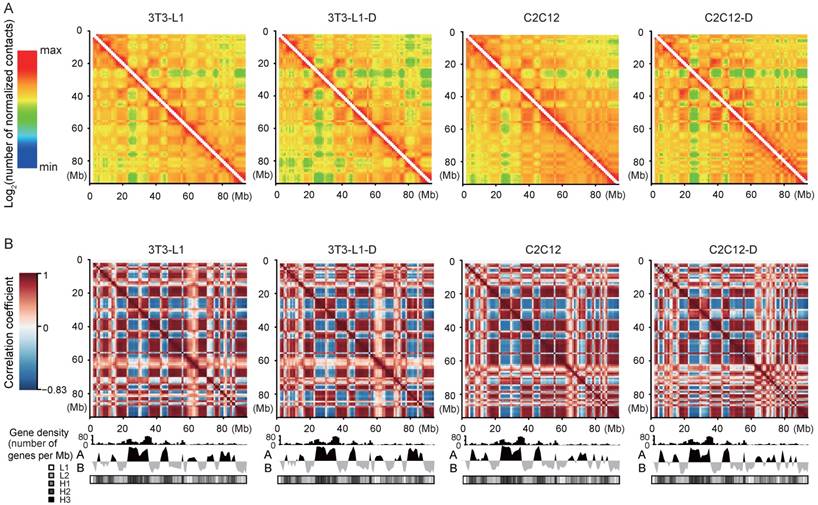
First, the normalized intrachromosomal interaction maps at 1-Mb resolution visually present reproducible “plaid” patterns, which represent alternating regions with high and low interaction frequency (Figure 2A). The “plaid” pattern is more obvious in the correlation maps, indicating the interaction profiles of loci (Figure 2B). Second, the interaction frequency decreased with increasing genomic distance in four cell types (Figure S4). These results confirmed the general principles of genome packing [21, 32].
Reproducible “plaid” pattern of intrachromosomal interactions in four cell types. (A) Intrachromosomal interactions along Chr.17 (1-Mb bins smoothed with a 200-kb step size). The color of each dot represents the log2 of the normalized contact number for the corresponding genome bins. (B) Pearson's correlation map of Chr.17 at 1-Mb resolution shows chromosome compartmentalization and the characteristic plaid patterns. The first principal component eigenvector (below heat map: “A” and “B” refer to active and inactive chromatin states) identifies compartments and correlates with gene density and GC content defined isochores (in GC%: L1 < 37%; L2 37%-41%; H1 41%-46%; H2 46%-53%; and H3 > 53%).
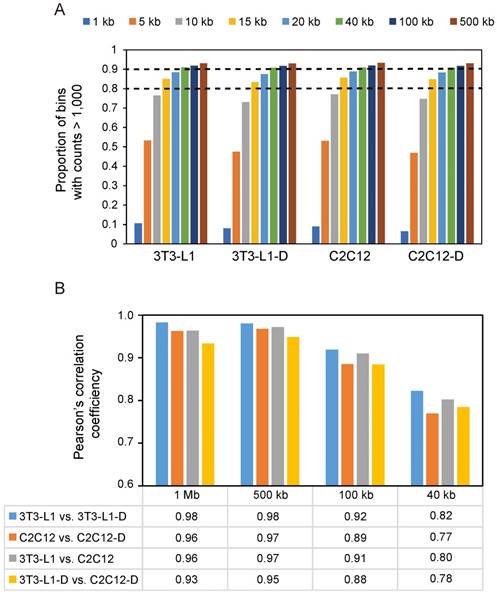
Next, we performed Pearson's correlation analysis at four resolutions (i.e. 1 Mb, 500 kb, 100 kb, and 40 kb) to test the difference of chromatin interactions during adipogenic and myogenic differentiation. Even for the highest resolution (40 kb) that we used, over 90% of bins had at least 1,000 contacts (Figure 3A). We found that a divergence of chromatin folding during differentiation gradually appeared with increasing resolution, showing a decreased correlation (Pearson's r ≥ 0.96 at 1 Mb vs. ≤ 0.82 at 40 kb, P < 10-16) (Figure 3B). Therefore, we subsequently discussed the difference of spatial chromatin organization during differentiation and between cell types at 40-kb resolution. We found that myogenesis presents more changes in chromatin interaction (Pearson's r = 0.77, P < 10-16) than occur during adipogenesis (Pearson's r = 0.82, P < 10-16). Mature adipocytes and myotubes showed more divergence in chromatin spatial organization (Pearson's r = 0.78, P < 10-16) than proliferating pre-adipocytes and myoblasts (Pearson's r = 0.80, P < 10-16) because of the common fibroblast properties in 3T3-L1 and C2C12.
Decreased correlation between different cell types with increasing resolution. (A) Map resolution evaluation using the proportion of bins with interaction counts > 1,000. At 15-kb resolution, more than 80% of bins have at least 1,000 contacts. At 40-kb resolution, over 90% of bins have at least 1,000 contacts. (B) Pearson's correlation analysis at four resolutions from low to high (1 Mb, 500 kb, 100 kb, and 40 kb). In each sample pair, Pearson's correlation analysis was performed in each chromosomal cis interaction matrices, then a mean Pearson's r of 19 euchromosomes was obtained as shown.
Extensive compartment A/B changes during adipogenic and myogenic differentiation
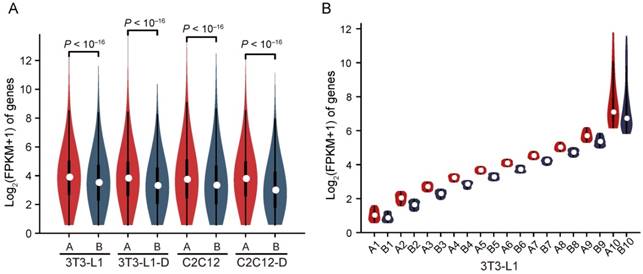
Compartments A and B correlate strongly with genetic and epigenetic features of the genome, representing the relatively active (euchromatin, GC-rich and gene-rich, more open, accessible, and actively transcribed) and inactive (heterochromatin, GC-poor and gene-sparse, more closed, less accessible, and inactively transcribed) chromatin regions, respectively [21, 35]. We divided the genome into compartments A and B using the first principal component (PC1) values of normalized interaction matrices at a 40-kb bin size. The mouse genome is almost equally divided into two parts, compartments A and B (excluding the centromeric and telomeric regions with PC1 = 0) (Figure S5A). Pairs of bins in compartment B exhibited higher interaction frequency at any genomic distance than pairs of bins in compartment A, and pairs of bins between A and B showed the lowest interaction frequency (Figure S6A). The mean interaction frequency between pairs of bins arranged by their PC1 values confirmed these results (Figure S6B). Compared with compartment B, compartment A had a significantly higher gene expression level [mean log2(FPKM+1) = 3.92 in A vs. 3.44 in B, Wilcoxon's test, P < 10-16)] (Figure 4A), and exhibited a stronger active histone mark H3K4me3 signal and higher chromatin accessibility (Figure S6C-E), confirming the intrinsic properties of compartments A (open, GC-rich and gene-rich, and actively transcribed) and B (closed, GC-poor and gene-sparse, and inactively transcribed) (Figure 2B, Figure S5B, S5C). To investigate this in more detail, we divided the genes into ten clusters according to FPKM decile in each compartment, and compartment A showed a significantly higher expression level than B in each cluster, implying that compartments A and B play a board range of roles in regulating gene expression (Figure 4B).
Higher gene expression in compartment A than in B. Genes located in compartment A have a significantly higher expression level than those in B in each cell type. Mean log2(FPKM+1) in compartment A is 3.73, 3.66, 3.69, and 3.63, and that in B is 3.34, 3.12, 3.26, and 2.81, respectively, in 3T3-L1, 3T3-L1-D, C2C12, and C2C12-D (Wilcoxon's test, P < 10-16). Genes located in compartment A/B are divided into ten clusters by FPKM decile. In each cluster, genes in compartment A are significantly more highly expressed than in B (Wilcoxon's test, P < 10-16 for each pair of compartment A vs. B).
Notably, compartment strength was significantly divergent in the four cell types, and the differentiated 3T3-L1-D and C2C12-D showed significantly higher compartment strength than proliferating 3T3-L1 and C2C12, respectively (Student's t-test, P < 0.01) (Figure 5A), suggesting the dynamic compartmentalization during cell differentiation and between cell types. As expected, we observed marked spatial plasticity in the arrangement of compartments A and B during differentiation (~14.48% of genome regions exhibited B to A switch and 8.38% exhibited A to B switch during adipogenesis, and ~13.08% B to A and 8.39% A to B during myogenesis), which is comparable to that between adipocytes and myotubes (~14.3% B to A and 9.91% A to B) (Figure 5B). Intriguingly, these upregulated genes [log2 fold change of (FPKM+1) > 1.0] located in the activated regions (i.e., B to A switch) during adipogenesis were significantly enriched in the GO terms of adipocyte-specific functional categories, such as negative regulation of lipid metabolic process (GO: 0045833, adjusted P = 0.01, combined score = 28.33), high-density-lipoprotein particle remodeling (GO: 0034375, adjusted P = 0.01, combined score = 25.76), triglyceride homeostasis (GO: 0070328, adjusted P = 0.02, combined score = 25.66), as well as the regulation of lipolysis in adipocytes (hsa04923, adjusted P = 0.25×10⁻⁴, combined score = 17.28) KEGG pathway. Upregulated genes in activated regions during myogenesis were significantly enriched in the GO terms branchiomeric skeletal muscle development (GO: 0014707, adjusted P = 0.34×10⁻⁴, combined score = 37.39), visceral muscle development (GO: 00075227, adjusted P = 0.34×10⁻⁴, combined score = 36.80), muscle filament sliding (GO: 0030049, adjusted P = 0.92×10⁻⁴, combined score = 35.87), and the KEGG pathways focal adhesion (hsa04510, adjusted P = 0.10×10⁻⁴, combined score = 22.17 and FoxO signaling pathway (hsa04068, adjusted P = 0.10×10⁻⁴, combined score = 20.58) (Table S4).
Compartment A/B changes of adipogenesis and myogenesis marker genes are coordinated with gene expression changes. Compartment strength in each chromosome of four cell types. The compartment strength is divergent during cell differentiation and between cell types (P = 3.61×10⁻³ in 3T3-L1 vs. 3T3-L1-D, P = 2.00×10⁻⁸ in 3T3-L1 vs. C2C12, P = 2.56×10⁻³ in 3T3-L1 vs. C2C12, P = 1.00×10⁻³ in 3T3-L1-D vs. C2C12-D, Student's t-test). Percentage of the genome that changes A/B compartment upon adipogenic and myogenic differentiation, as well as between proliferating and differentiated 3T3-L1 and C2C12. (C, D) Significantly highly expressed adipogenesis (C) and myogenesis (D) marker genes have more positive PC1 values after differentiation. These marker genes are well known and widely reported. Negative PC1 value represents compartment B, positive PC1 value represents compartment A.
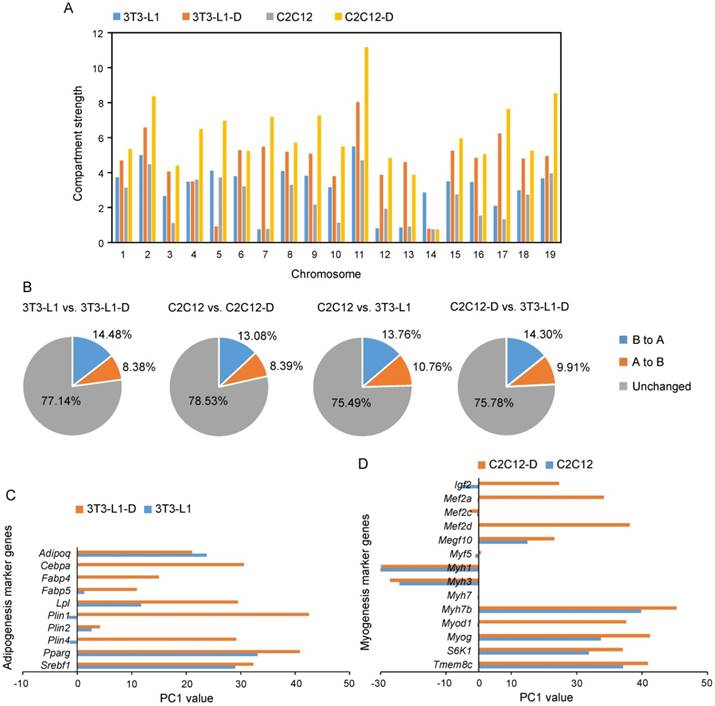
In addition, we also found an activated chromatin status of the well-characterized and widely reported adipogenesis and myogenesis marker genes (the same genes as in Figure S1B). Nine out of ten significantly upregulated adipogenesis marker genes had a more active compartment status after differentiation (elevated PC1 value in adipocytes compared with that in pre-adipocytes), especially the adipogenic transcription factors Cebpa and Pparg (the master regulators of adipocyte differentiation and metabolism) and their target genes Plin1 and Fabp4 [9, 36] (Figure 5C). Approximately 80% (12 out of 15) of the significantly highly expressed myogenesis marker genes were subjected to an activated chromatin state (elevated PC1 values) in myotubes (Figure 5C). These results provide evidence that the epigenetic chromatin state-mediated compartment activation may contribute to cell differentiation by upregulating pro-differentiation genes.
Domain-level chromatin dynamics corresponding to cell differentiation
TADs appear to be chromosomal secondary structure units of genome packing, with two basic features: “self-association” within TADs and “insulation” between neighboring TADs [37]. We identified a mean of 1,761 TADs, which constitute ~91.09% of the mouse genome (excluding sex chromosomes). The adipocytes and myotubes clearly harbored more TADs with a smaller size than pre-adipocytes and myoblasts, respectively (n = 1,683, median size 1.04 Mb in pre-adipocytes; n = 1,974, median size 0.88 Mb in adipocytes; n = 1,593, median size 1.16 Mb in myoblasts; and n = 1,792, median size 0.96 Mb in myotubes) (Table 1, Figure S8A). This is consistent with the increased intrachromosomal interactions after differentiation (Figure 1), and may be due to activation of the precise regulation of adjacent gene expression during adipogenesis and myogenesis. We also found that the smallest (61.43 Mb) chromosome 19 harbored the highest TAD density in four cell types (0.88 of Chr. 19 vs. 0.69 of chromosomal mean in 3T3-L1, 0.99 vs. 0.81 in 3T3-L1-D, 0.81 vs. 0.65 in C2C12, and 0.86 vs. 0.74 in C2C12-D) (Figure S7).
Summary of TADs
| Sample | TAD number | TAD length (Mb) | ||||
|---|---|---|---|---|---|---|
| Median | Arithmetic mean | Maximum | Minimum | Total length | ||
| 3T3-L1 | 1,683 | 1.04 | 1.34 | 8.36 | 0.12 | 2258.15 |
| 3T3-L1-D | 1,974 | 0.88 | 1.13 | 6.56 | 0.16 | 2237.54 |
| C2C12 | 1,593 | 1.16 | 1.41 | 6.80 | 0.20 | 2239.92 |
| C2C12-D | 1,792 | 0.96 | 1.25 | 8.56 | 0.16 | 2237.35 |
Next, we calculated Spearman's correlation between the directionality index vectors around the TAD boundary center to evaluate the conservation of boundary regions [25]. Approximately 97.96% (2,741 out of 2,798) and 97.70% (2,549 out of 2,609) of TAD boundaries were shared during adipogenesis and myogenesis. Comparable proportions of shared TAD boundaries were also identified in proliferating (~97.01%) and terminally differentiated (~96.97%) 3T3-L1 and C2C12 (Figure S8B). The TAD boundaries also showed universal characteristics that were enriched with TSS, architectural protein CTCF, and active histone mark H3K4me3 (Figure S8C-E). The TAD boundary-corresponding Hoxa gene cluster, which is species-conserved, was also confirmed here (Figure S8F). These results are consistent with previous reports describing that TADs are generally conserved between cell types and species [25, 38].
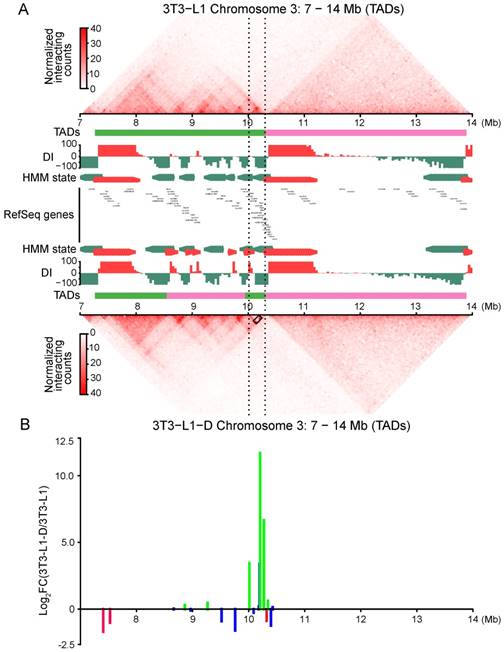
In addition, we found a considerable number of dynamic TADs with their genomic location changed. We identified 583 completely stable TADs (with a completely consistent genomic location) during adipogenic differentiation and 457 during myogenic differentiation; only 156 TADs were completely stable in all four of the cell types (Figure S8G). More than half (65.4%-73.2%) of the TADs were found to be dynamic during cell differentiation. Typically, the Fabp gene cluster (containing the adipogenic marker gene Fabp4)-located TAD was split into three in adipocytes, forming a separate TAD with strong intradomain interactions and significantly upregulated gene expression (Figure 6A, 6B). This finding supports a previous report describing that Fabp4 undergoes rewiring of the promoter-anchored chromatin loop during adipogenic differentiation [16]. We also studied a 5-Mb region containing skeletal muscle-specific Myhc, the multigene family Myh3/2/1/4/8/13, located in a 300-kb region of chromosome 11 in mouse [39]. Although there was no obvious change in TAD, we still found an intensification of local interaction frequency and upregulated gene expression in myotubes, compared with those in myoblasts (Figure S9A, S9B).
Adipogenic differentiation generated adipocyte-specific chromatin interactions and correlated with gene activity. Genome browser shots showing domain structure of a 7-Mb region over Fabp gene clusters in 3T3-L1 (top panel) and 3T3-L1-D (bottom panel). The region between the black dashed lines represents the Fabp4/5/8/9/12 gene cluster. Green and pink lines represent different TADs. The Fabp gene cluster-located TAD in 3T3-L1 was split into three TADs in 3T3-L1-D, forming a separate TAD with strong intradomain interactions in the Fabp gene cluster. The black box between the black dashed lines in 3T3-L1-D indicates highly promoter-associated interactions of Fabp4. Newly formed TAD of the Fabp gene cluster was activated with significantly upregulated gene expression. The green lines indicate upregulated DEGs and the red lines indicate downregulated ones, blue lines refer to non-DEGs.
Putative promoter interactions involved in adipogenesis and myogenesis
Promoter interactions that associated with long-range regulatory elements (particularly enhancers) can modulate gene expression [40, 41]. To investigate the putative promoter interactions that contribute to cell differentiation and specification, we first identified differential chromatin interactions (DCIs) between sample pairs. Approximately 5,951 (~2.82%) DCIs (binomial P < 0.001) out of 211,332 interactions with high confidence (binomial Benjamini-corrected FDR < 0.01) in pre-adipocytes and adipocytes were found. Fewer DCIs (~1.47%, 2,609 out of 177,569) were found in myoblasts and myotubes. Differentiated adipocytes and myotubes harbored more DCIs (~6.98%, 15,145 out of 217,062) than in proliferating cells (~2.61%, 4,814 out of 184,554) (Figure 7A), which coincides with the lower interaction matrix correlation between adipocytes and myotubes (Figure 3). These DCI regions account for ~21.73% of the mouse genome (excluding sex chromosomes). Moreover, about half of these DCIs were identified as putative promoter interactions (2,918 or 49.03% in pre-adipocytes and adipocytes; 845 or 32.39% in myoblasts and myotubes; 2,842 or 59.04% in pre-adipocytes and myoblasts; and 6,007 or 39.66% in adipocytes and myotubes) (Figure 7A). These promoter interactions featured thousands of protein-coding genes (3,307 in 3T3-L1, 1,161 in 3T3-L1-D, 2,809 in C2C12, and 4,510 in C2C12-D).
Differential chromatin interactions contribute to differential gene expression. Histogram showing the proportion of DCIs (binomial P < 0.001) in the high-confidence interactions (binomial Benjamini-corrected FDR < 0.01). Pie chart showing the proportion of promoter interactions among the DCIs. The fraction of putative promoter-enhancer interactions and non-promoter-enhancer interactions in DCIs. The area of the pie chart represents the number of DCIs between each sample pair. The cyan region indicates the number of putative promoter-enhancer interactions, and the gray region indicates the number of non-promoter-enhancer interactions. Putative promoter-enhancer interactions were significantly enriched in DCIs than in the genome background (randomly selected). The FDR is based on the χ2 test. Genes differentially expressed during cell differentiation and between cell types are significantly enriched in these putative promoter interactions, excluding between 3T3-L1 and C2C12. χ2 test, (***) FDR < 0.001, (**) FDR < 0.01, (*) FDR < 0.05, (ns.) FDR > 0.05. Violin plot showing the difference of gene expression in these DCIs. Student's t-test, P < 0.05.
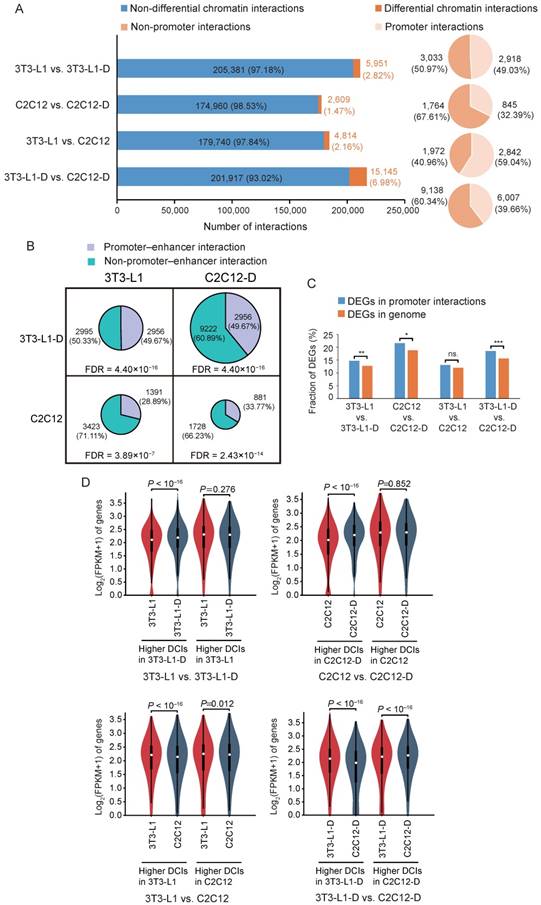
We further estimated the enrichment of putative promoter-enhancer interactions (PEIs) in these differential promoter interactions, which directly drive the expression of the target genes [40]. As expected, these promoter interactions included more putative PEIs than in the genome background (χ2 test, FDR < 3.89×10⁻⁷) (Figure 7B). It is well documented that cell-specific transcription factors (TFs) mediate the formation of PEIs, which may contribute to adipogenic and neural differentiation by activating the expression of pro-differentiation genes [16, 42]. Indeed, we identified significant enrichment of TF binding sites in the putative enhancer regions of PEIs (z-score transformation, P < 0.001) using the publicly available ChIP-seq data of three adipogenic and four myogenic TFs (Figure S10A and Table S2). Compared with all putative PEIs, which may include a non-trivial fraction of silent or inactive enhancers, the TF-mediated active PEIs exhibited significantly higher strength of interaction (Wilcoxon's test, P < 0.001) and higher gene expression level (Wilcoxon's test, P < 0.02) (Figure S10B-D).
The acquisition of promoter interaction is an essential prerequisite of gene activation and high expression [34, 43]. We further evaluated the global gene expression in these differential promoter interactions. We found that they harbored more cell differentiation- and cell type-specific differentially expressed genes (DEGs) than differential nonpromoter interactions (excluding proliferating fibroblast-like 3T3-L1 vs. C2C12, χ2 test, FDR < 0.05) (Figure 7C). Differential promoter interactions with higher interaction strength also exhibited compatible higher gene expression level, especially in mature adipocytes and myotubes (Figure 7D, Student's t-test, P < 0.05), confirming that differential promoter interactions can contribute to differential gene expression [25, 44]. We found 51 and 113 higher promoter interactions related to 48 and 86 significantly upregulated DEGs in adipocytes and myotubes, compared with pre-adipocytes and myoblasts, respectively (Table S5). These higher promoter interactions that harbored upregulated DEGs after differentiation may be the key regulators of adipogenic and myogenic differentiation. Increased local interactions of these putative promoters may contribute to adipogenesis and myogenesis by activating the expression of pro-differentiation genes.
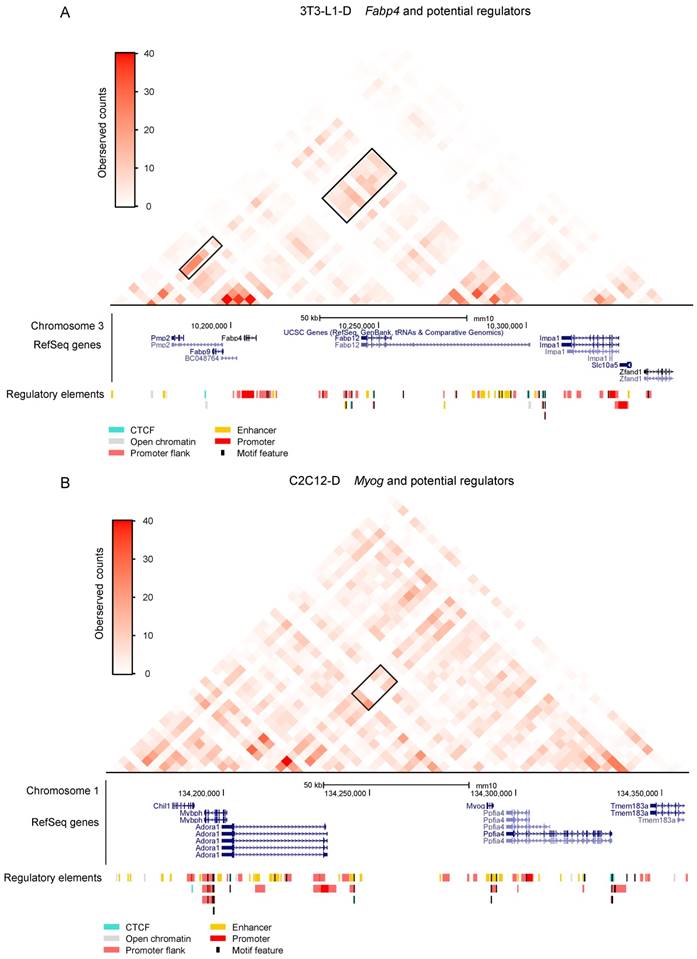
As expected, upregulated adipogenesis marker genes such as Fabp4, Fabp5, and Lpl were embedded in these higher promoter interactions in adipocytes. Analysis of Fabp4 involved in three higher promoter interactions, two of which are 160-200 kb upstream and the other is 40 kb downstream, confirmed the intensification of intradomain interactions (Figure 6A, Figure 8A, Table S5), as well as promoter-enriched interactions in early adipogenesis (day 2) [16]. Moreover, we can speculate that the enrichment of Fabp4 promoter interactions can be maintained until the terminal differentiation of adipocytes (day 10), consistent with its sustained high expression during adipogenic differentiation [45]. The adipocyte-specific gene Lpl is also regulated by a potential cis regulatory element at 40 kb upstream (Table S5). Myocyte Enhancer Factor 2C (Mef2c) and 2A (Mef2a), which play roles in maintaining the differentiated state of muscle cells, also showed higher promoter interactions in myotubes than in myoblasts. The myogenic marker gene Myog significantly interacted with two potential cis regulatory elements at 40 and 80 kb upstream (Figure 8B, Table S5). Moreover, Igf2, which regulates skeletal muscle development [13, 46], was also found to exhibit higher interaction with imprinted Igf2/H19 in myotubes than in myoblasts (Table S5).
Potential regulators of adipogenesis and myogenesis. Significantly stronger promoter interactions of the adipogenic marker gene Fabp4 in 3T3-L1-D. The black box on the right indicates one of the significantly stronger promoter interactions of Fabp4, which is located upstream, referring to a cluster of experimental annotated enhancers. The black box on the left indicates a potential promoter-enhancer interaction of Fabp4 downstream. Significantly stronger promoter interactions of the adipogenic marker gene Myog in C2C12-D. The black box indicates significantly stronger promoter interactions of Fabp4 located upstream, referring to a cluster of enhancers annotated in Ensemble. RefSeq genes were downloaded from the UCSC Genome Browser and regulatory elements were downloaded from the Ensemble annotation.
Discussion
We compared the genome-wide chromatin interactions that presented spatial genome organization during adipogenesis and myogenesis in three spatial structures: compartment A/B, TADs, and DCIs, and explored how they affect adipogenic and myogenic gene expression. Although the global chromatin folding principle is conserved during adipogenic and myogenic differentiation, as well as across cell types, the chromatin interactions are divergent at higher resolution in finer structure units.
The dynamic genome compartmentalization during adipogenic and myogenic differentiation and between cell types suggests its crucial role in mediating genome function and cell identity. The remarkable compartment A/B switching that occurs during adipogenesis (~22.86%) and myogenesis (~21.47%) is comparable to that of human ESC differentiation (25.0%, 21.8%, 14.1%, 10.0%, and 3.8% changes from ES to MSC, IMR90, TB, NPC, and ME, respectively) [44]. Only 8.0% of the genome changed compartment residence during myotube development (day 3 post-differentiation) [17], which is less than in terminally differentiated myotubes (day 8 post-differentiation). Therefore, the chromatin interaction undergoes continuous dynamic change during cell differentiation until the terminal differentiation stage (day 8), which reached the maximum level of multinucleated myotubes [47]. The combination of compartment A/B switching and gene expression suggests extensive regulation of epigenetic modification in the expression of pro-differentiation genes [48].
Self-organized TADs are basic units of chromatin folding, and tissue-invariant to a large extent, but can also be distinct in structure, function, and cell-to-cell variability in different organisms [25, 34, 49, 50]. However, TAD predictions varied greatly in number, size distribution, nesting, and other biological properties, based on different algorithms, data input, as well as resolution and data depth [51]. Here, we identified over 1,590 TADs (median size 880 kb-1.16 Mb) in each cell type, which is comparable to that of early differentiated adipocytes (>1,500 TADs) and other mouse genomes such as from ESCs (2,200 TADs with median length of 880 kb), cortex (1,518 TADs with median length of 1.32 Mb), and fibroblasts (2,590 TADs with median length of 680 kb) [16, 25, 26]. Although TAD boundaries were highly conserved, more than half of the TADs were identified to be dynamic with an inconsistent genomic location, accompanied by alterable local interaction frequency, which contributes to corresponding gene activation or inactivation. The newly formed TAD and enhanced local interactions in the Fabp gene cluster indicated more precise structural regulation during adipogenic differentiation. These results confirmed the alterable intra-TAD interaction frequency and associated upregulation or downregulation of gene expression during hESC differentiation [44]. We speculate that the spatial chromatin structure requires more elaborate TADs to achieve more precise gene regulation and avoid disordered transcription during cell differentiation. This is consistent with the features of 3D genome structure (from large nuclear compartments and TADs to smaller chromatin loops that connect promoters and enhancers) that the larger these structures, the more stable they are within cells, while becoming more variable in finer structure [52].
Chromatin loops formed by promoter interactions are the finest and most direct spatial structures that regulate gene expression. We identified thousands of potential promoter interactions that may be the key regulators of adipogenesis and myogenesis. At the genome-wide scale, these promoter interactions included more promoter-enhancer interactions than in the genome background and included more DEGs, indicating their direct regulatory role in gene expression by activating promoter-enhancer interactions. At the individual DCI level, upregulated differentiation marker genes (such as Fabp4, Fabp5, and Lpl in adipogenesis, and Mef2a, Mef2c, and Myog in myogenesis) exhibit stronger promoter interactions after differentiation, which may involve activated promoter-enhancer chromatin loops. Although some other adipogenesis- and myogenesis-related genes such as Pparg, Cebpa, and Myod do not show stronger promoter interaction after differentiation, which may due to the resolution not covering single genes, the increased PC1 values of the bins in which these genes were located indicated their activated chromatin state (Figure 5B, 5C). Therefore, the promoter interactions can partially induce cell differentiation by the activation of differentiation-related genes. Further study of promoter interactions (especially promoter-enhancer interactions) at higher resolution combined with epigenetic modification at various stages of differentiation can provide more accurate information about the mechanisms of adipogenesis and myogenesis.
In conclusion, we demonstrated numerous dynamic chromatin interactions during adipogenic and myogenic differentiation at various spatial structures. The dynamic spatial reorganization is consistent with gene expression modulation. Putative promoter interactions will provide evidence for further study of promoter-anchored chromatin loops to obtain a comprehensive understanding of the molecular regulatory mechanisms of adipogenesis and myogenesis.
Abbreviations
Hi-C: high-throughput chromosome conformation capture; 3D: three-dimensional; TAD: topologically associating domain; DCI: differential chromatin interaction; PEI: promoter-enhancer interaction; DEG: differentially expressed gene; DMEM: Dulbecco's modified Eagle's medium; FBS: fetal bovine serum; PBS: phosphate buffer solution DI: directionality index; HMM: hidden Markov model; TSS: transcription start site; FPKM: fragments per kilobase of transcript per million mapped reads.
Supplementary Material
Supplementary table 2-3 and figures.
Supplementary table 1.
Supplementary table 4.
Supplementary table 5.
Acknowledgements
This work was supported by grants from the National Key R & D Program of China (2018YFD0500403), the National Natural Science Foundation of China (31530073, 31772576, 31522055, 31601918 and 31601919), the Sichuan Province & Chinese Academy of Science of Science & Technology Cooperation Project (2017JZ0025), the Science & Technology Support Program of Sichuan (2016NYZ0042 and 2017NZDZX0002), and the Application Basic Research Plan Project of Sichuan Province (2016JY0167).
Author Contributions
Mingzhou Li and Xuewei Li designed the research. Mengnan He and Shen He prepared the cell materials. Mengnan He and Lamei Deng prepared the Hi-C libraries and Zhi Jiang prepared the RNA-seq libraries. Yan Li and Qianzi Tang analyzed the Hi-C data. Tiandong Che, Shilin Tian and Mengnan He analyzed the RNA-seq data. Mengnan He and Yan Li wrote the manuscript. Long Jin, Guangliang Gao, and Yiren Gu reviewed the manuscript. Mingzhou Li, Xuewei Li, and Diyan Li revised the manuscript. All authors read and approved the final manuscript.
Data Availability
The sequencing results of Hi-C and RNA-seq libraries in our experiment are available in the NCBI Sequence Read Archive (SRA; https://www.ncbi.nlm.nih.gov/sra/) under accession numbers SRP082116 and SRP090724, respectively.
Competing Interests
The authors have declared that no competing interest exists.
References
1. Hoffmann C, Weigert C. Skeletal muscle as an endocrine organ: the role of myokines in exercise adaptations. Cold Spring Harb Perspect Med. 2017:7
2. Kajimura S. Adipose tissue in 2016: Advances in the understanding of adipose tissue biology. Nat Rev Endocrinol. 2017;13:69-70
3. Skoczen S, Tomasik PJ, Fijorek K, Strojny W, Wieczorek A, Balwierz W. et al. Concentrations of adipokines in children before and after hematopoietic stem cell transplantation. Pediatr Hematol and Oncol. 2016;33:21-38
4. MacDougald OA, Burant CF. The rapidly expanding family of adipokines. Cell Metab. 2007;6:159-61
5. Carson BP. The potential role of contraction-induced myokines in the regulation of metabolic function for the prevention and treatment of type 2 diabetes. Front Endocrinol (Lausanne). 2017;8:97
6. So B, Kim HJ, Kim J, Song W. Exercise-induced myokines in health and metabolic diseases. Integr Med Res. 2014;3:172-9
7. Kostrominova TY. Role of myokines in the maintenance of whole-body metabolic homeostasis. Minerva Endocrinol. 2016;41:403-20
8. Siersbæk R, Nielsen R, John S, Sung MH, Baek S, Loft A. et al. Extensive chromatin remodelling and establishment of transcription factor 'hotspots' during early adipogenesis. EMBO J. 2011;30:1459-72
9. Lefterova MI, Haakonsson AK, Lazar MA, Mandrup S. PPARγ and the global map of adipogenesis and beyond. Trends Endocrinol Metab. 2014;25:293-302
10. Aboalola D, Han VKM. Insulin-like growth factor binding protein-6 alters skeletal muscle differentiation of human mesenchymal stem cells. Stem Cells Int. 2017;2017:2348485
11. Taylor MV, Hughes SM. Mef2 and the skeletal muscle differentiation program. Semin Cell & Dev Biol. 2017;72:33-44
12. Che Y, Wang Q, Xiao R, Zhang J, Zhang Y, Gu W. et al. Kudinoside-D, a triterpenoid saponin derived from Ilex kudingcha suppresses adipogenesis through modulation of the AMPK pathway in 3T3-L1 adipocytes. Fitoterapia. 2017
13. Jang YJ, Son HJ, Choi YM, Ahn J, Jung CH, Ha TY. Apigenin enhances skeletal muscle hypertrophy and myoblast differentiation by regulating Prmt7. Oncotarget. 2017;8:78300-11
14. Bodega B, Ramirez GD, Grasser F, Cheli S, Brunelli S, Mora M. et al. Remodeling of the chromatin structure of the facioscapulohumeral muscular dystrophy (FSHD) locus and upregulation of FSHD-related gene 1 (FRG1) expression during human myogenic differentiation. BMC Biol. 2009;7:41
15. LeBlanc SE, Wu Q, Barutcu AR, Xiao H, Ohkawa Y, Imbalzano AN. The PPARgamma locus makes long-range chromatin interactions with selected tissue-specific gene loci during adipocyte differentiation in a protein kinase A dependent manner. PLoS One. 2014;9:e86140
16. Siersbaek R, Madsen JGS, Javierre BM, Nielsen R, Bagge EK, Cairns J. et al. Dynamic rewiring of promoter-anchored chromatin loops during adipocyte differentiation. Mol Cell. 2017;66:420-35 e5
17. Doynova MD, Markworth JF, Cameron-Smith D, Vickers MH, O'Sullivan JM. Linkages between changes in the 3D organization of the genome and transcription during myotube differentiation in vitro. Skelet Muscle. 2017;7:5
18. Neems DS, Garza-Gongora AG, Smith ED, Kosak ST. Topologically associated domains enriched for lineage-specific genes reveal expression-dependent nuclear topologies during myogenesis. Proc Natl Acad Sci U S A. 2016;113:E1691-700
19. Zhao X, Yang Y, Sun B-F, Shi Y, Yang X, Xiao W. et al. FTO-dependent demethylation of N6-methyladenosine regulates mRNA splicing and is required for adipogenesis. Cell Res. 2014;24:1403-19
20. Dey BK, Pfeifer K, Dutta A. The H19 long noncoding RNA gives rise to microRNAs miR-675-3p and miR-675-5p to promote skeletal muscle differentiation and regeneration. Genes Dev. 2014;28:491-501
21. Lieberman-Aiden E, van Berkum NL, Williams L, Imakaev M, Ragoczy T, Telling A. et al. Comprehensive mapping of long-range interactions reveals folding principles of the human genome. Science. 2009;326:289-93
22. Imakaev M, Fudenberg G, McCord RP, Naumova N, Goloborodko A, Lajoie BR. et al. Iterative correction of Hi-C data reveals hallmarks of chromosome organization. Nat Methods. 2012;9:999-1003
23. Ke Y, Xu Y, Chen X, Feng S, Liu Z, Sun Y. et al. 3D chromatin structures of mature gametes and structural reprogramming during mammalian embryogenesis. Cell. 2017;170:367-81.e20
24. Schwarzer W, Abdennur N, Goloborodko A, Pekowska A, Fudenberg G, Loe-Mie Y. et al. Two independent modes of chromatin organization revealed by cohesin removal. Nature. 2017;551:51-6
25. Dixon JR, Selvaraj S, Yue F, Kim A, Li Y, Shen Y. et al. Topological domains in mammalian genomes identified by analysis of chromatin interactions. Nature. 2012;485:376-80
26. Battulin N, Fishman VS, Mazur AM, Pomaznoy M, Khabarova AA, Afonnikov DA. et al. Comparison of the 3D organization of sperm and fibroblast genomes using the Hi-C approach. Genome Biol. 2015;16:77
27. Kim D, Pertea G, Trapnell C, Pimentel H, Kelley R, Salzberg SL. TopHat2: accurate alignment of transcriptomes in the presence of insertions, deletions and gene fusions. Genome Biol. 2013;14:R36
28. Trapnell C, Williams BA, Pertea G, Mortazavi A, Kwan G, van Baren MJ. et al. Transcript assembly and quantification by RNA-Seq reveals unannotated transcripts and isoform switching during cell differentiation. Nat Biotechnol. 2010;28:511-5
29. Wang L, Feng Z, Wang X, Wang X, Zhang X. DEGseq: an R package for identifying differentially expressed genes from RNA-seq data. Bioinformatics. 2010;26:136-8
30. Kuleshov MV, Jones MR, Rouillard AD, Fernandez NF, Duan Q, Wang Z. et al. Enrichr: a comprehensive gene set enrichment analysis web server 2016 update. Nucleic Acids Res. 2016;44:W90-7
31. Chen EY, Tan CM, Kou Y, Duan Q, Wang Z, Meirelles GV. et al. Enrichr: interactive and collaborative HTML5 gene list enrichment analysis tool. BMC Bioinformatics. 2013;14:128
32. Zhang Y, McCord RP, Ho YJ, Lajoie BR, Hildebrand DG, Simon AC. et al. Spatial organization of the mouse genome and its role in recurrent chromosomal translocations. Cell. 2012;148:908-21
33. Pueschel R, Coraggio F, Meister P. From single genes to entire genomes: the search for a function of nuclear organization. Development. 2016;143:910-23
34. Dekker J, Mirny L. The 3D genome as moderator of chromosomal communication. Cell. 2016;164:1110-21
35. Jost D, Vaillant C, Meister P. Coupling 1D modifications and 3D nuclear organization: data, models and function. Curr Opin Cell Biol. 2017;44:20-7
36. Haj-Yasein NN, Berg O, Jernerén F, Refsum H, Nebb HI, Dalen KT. Cysteine deprivation prevents induction of peroxisome proliferator-activated receptor gamma-2 and adipose differentiation of 3T3-L1 cells. Biochim Biophys Acta. 2017;1862:623-35
37. Dixon JR, Gorkin DU, Ren B. Chromatin domains: the unit of chromosome organization. Mol Cell. 2016;62:668-80
38. Le Dily F, Bau D, Pohl A, Vicent GP, Serra F, Soronellas D. et al. Distinct structural transitions of chromatin topological domains correlate with coordinated hormone-induced gene regulation. Genes Dev. 2014;28:2151-62
39. Weiss A, McDonough D, Wertman B, Acakpo-Satchivi L, Montgomery K, Kucherlapati R. et al. Organization of human and mouse skeletal myosin heavy chain gene clusters is highly conserved. Proc Natl Acad Sci U S A. 1999;96:2958-63
40. Schoenfelder S, Furlan-Magaril M, Mifsud B, Tavares-Cadete F, Sugar R, Javierre BM. et al. The pluripotent regulatory circuitry connecting promoters to their long-range interacting elements. Genome Res. 2015;25:582-97
41. Mifsud B, Tavares-Cadete F, Young AN, Sugar R, Schoenfelder S, Ferreira L. et al. Mapping long-range promoter contacts in human cells with high-resolution capture Hi-C. Nat Genet. 2015;47:598-606
42. Zabidi MA, Stark A. Regulatory enhancer-core-promoter communication via transcription factors and cofactors. Trends Genet. 2016;32:801-14
43. Reiter F, Wienerroither S, Stark A. Combinatorial function of transcription factors and cofactors. Curr Opin Genet Dev. 2017;43:73-81
44. Dixon JR, Jung I, Selvaraj S, Shen Y, Antosiewicz-Bourget JE, Lee AY. et al. Chromatin architecture reorganization during stem cell differentiation. Nature. 2015;518:331-6
45. Kusuyama J, Ohnishi T, Bandow K, Amir MS, Shima K, Semba I. et al. Constitutive activation of p46JNK2 is indispensable for C/EBPdelta induction in the initial stage of adipogenic differentiation. The Biochem J. 2017;474:3421-37
46. Erbay E, Park I-H, Nuzzi PD, Schoenherr CJ, Chen J. IGF-II transcription in skeletal myogenesis is controlled by mTOR and nutrients. J Cell Biol. 2003;163:931
47. Dedieu S, Mazeres G, Cottin P, Brustis JJ. Involvement of myogenic regulator factors during fusion in the cell line C2C12. Int J Dev Biol. 2002;46:235-41
48. Rivera CM, Ren B. Mapping human epigenomes. Cell. 2013;155:39-55
49. Sexton T, Cavalli G. The role of chromosome domains in shaping the functional genome. Cell. 2015;160:1049-59
50. Ea V, Baudement M-O, Lesne A, Forné T. Contribution of topological domains and loop formation to 3D chromatin organization. Genes (Basel). 2015;6:734-50
51. Dali R, Blanchette M. A critical assessment of topologically associating domain prediction tools. Nucleic Acids Res. 2017;45:2994-3005
52. Gibcus JH, Dekker J. The hierarchy of the 3D genome. Mol Cell. 2013;49:773-82
Author contact
![]() Corresponding authors: Mingzhou Li, E-mail: mingzhou.liedu.cn; Xuewei Li, E-mail: xuewei.liedu.cn.
Corresponding authors: Mingzhou Li, E-mail: mingzhou.liedu.cn; Xuewei Li, E-mail: xuewei.liedu.cn.