10
Impact Factor
ISSN: 1449-2288
Int J Biol Sci 2018; 14(14):2023-2036. doi:10.7150/ijbs.28302 This issue Cite
Research Paper
The intracellular NADH level regulates atrophic nonunion pathogenesis through the CtBP2-p300-Runx2 transcriptional complex
1. Department of Orthopedics, the Second Affiliated Hospital of Xi'an Jiaotong University, Xi'an 710005, Shaanxi, China;
2. Department of Orthopaedics, Hong-Hui Hospital, Xi'an Jiaotong University, Xi'an 710054, Shaanxi, China;
3. The second department of surgery room, Shaanxi Provincial Tumor Hospital, Xi'an 710061, Shaanxi, China.
* These authors contribute equally to this work.
Received 2018-7-4; Accepted 2018-10-5; Published 2018-11-3
Abstract

Atrophic nonunion, a complicated failure of fracture healing, is still obscure regarding its molecular pathological mechanisms. Carboxyl-terminal binding proteins (CtBPs), an NADH-sensitive transcriptional corepressor family, are involved in many diseases, such as cancer and inflammation. Here, we found that CtBP2, but not CtBP1, was significantly overexpressed in atrophic nonunion tissues compared to healthy controls. Using a mass spectrometry assay, we found that CtBP2 can form a complex with histone acetyltransferase p300 and transcription factor Runx2. The lower NADH level in atrophic nonunion tissues disrupted CtBP2 dimerization and enhanced the blockage of the accessibility of the p300-Runx2 complex to the promoters of a series of bone-related target genes, such as OSC, ALPL, COL1A1, IBSP, SPP1 and MMP13. The expression of these genes can be reversed by a forced increase in NADH with CoCl2 treatment. In conclusion, our study revealed that NADH levels determine the expression of bone formation and development of related genes through affecting the dissociation or binding of CtBP2 to the p300-Runx2 complex. These results represent a conserved mechanism, by which CtBP2 serves as a NADH-dependent repressor of the p300-Runx2 transcriptional complex and thus affects bone formation.
Keywords: atrophic nonunion, CtBP2, p300, Runx2, NADH/NAD ratio
1. Introduction
A small portion (5-10%) of bone fracture patients have impaired healing, eventually causing nonunion bone fractures and thus prolonging pain and disability [1]. Nonunion is routinely classified into two groups, namely, hypertrophic and atrophic, according to its radiological appearance [2, 3]. Hypertrophic nonunion has exuberant callus formation and results from inadequate immobilization of the fracture [2, 3]. Atrophic nonunion is absent of callus, bone ends and lacks vascularity, and it is caused by inadequate immobilization and blood supply [2, 3]. The most common treatment of nonunion is surgery, which is mainly devoted to stabilizing the nonunion area through inserting a bone graft to stimulate vasculogenesis and osteogenesis [4]. However, little is known regarding the molecular pathogenesis of nonunion [4]. Although only a small percentage of fractured patients eventually lead to nonunion, it imposes a heavy burden on families and society [1-4]. Thus, we are interested in studying the molecular mechanisms that cause nonunion.
The gene expression procedures that determine specific biological processes (e.g., cell differentiation and cell cycle progression) are controlled by numerous transcription factors (TFs) and their associated cofactors (e.g., corepressors and chromatin regulators) [5-8]. Importantly, dysregulation of these gene expression programs can cause a broad range of diseases, such as cancer and cardiovascular disease [5-8]. Mammals express numerous transcriptional corepressors to regulate gene expression in coordination with TFs [9-12]. The carboxyl-terminal binding proteins (CtBPs), a family of corepressors that have been well studied, form transcriptional complexes with histone acetyltransferases (e.g., p300, CBP and PCAF) [13-16], histone deacetylases (e.g., HDAC1, 2, 3 and 4) [13-16], and TFs (e.g., KLF3, KLF8, KLF12, FOXP2, NF-κB, TCF4 and ZNF750) [13-20]. Commonly, CtBPs interact with other proteins directly through a conserved PXDLS (X represents any residue) motif [21, 22], and the formed transcriptional complex binds to gene promoters and helps turn genes off [21, 22]. CtBPs are broadly expressed at high levels in many organs, including embryo, eyes, brain and heart, and therefore have multiple biological roles in these tissues [23-26]. In recent years, CtBPs, especially CtBP1, have been widely found to function as oncogenes in many cancer types [15, 27-30]. Overexpression of CtBP1 in cancer cells disrupts gene expression networks and affects cell behavior, such as cell proliferation, invasion, migration and the epithelial-mesenchymal transition (EMT) [15, 27-30]. However, there are currently no reports showing that CtBPs are involved in the process of bone formation. Human CtBP1 and CtBP2 share amino acid sequence homology and crystal structure similarity with NADH-dependent dehydrogenases, and they can utilize NADH/NAD+ as a cofactor [15, 31-33]. Emerging evidence indicates that CtBPs form a homodimer or a heterodimer through a large predominately hydrophobic dimerization interface within the nucleotide-binding domain (NBD) under a high NADH level condition, which causes the dissociation of the CtBP-associated transcriptional complex [15, 16]. Thus, the NADH level determines the dimerization of CtBPs and the dissociation of the CtBP-TF complex, eventually contributing to the regulation of the expression of downstream targets [15, 16, 32, 34].
Runt-related transcription factor 2 (Runx2), a critical member of the Runx TF family, mainly functions to control osteoblast development and bone formation through regulating numerous genes, such as osteocalcin (OSC) [35], alkaline phosphatase (ALPL) [35], osteopontin (SPP1) [36], collagen 1a1 (COL1A1) [36], integrin binding sialoprotein (IBSP) [36, 37], and matrix metallopeptidases 9 and 13 (MMP9 and 13) [36- 38]. Interestingly, Runx2 can also interact with HDAC3 and p300 to regulate the expression of genes involved in bone formation [39]. For example, Runx2 interacts with HDAC3 to repress OSC expression [39] while Runx2 interacts with p300 to activate MMP13 expression [40]. Recently, Runx2 has been reported to function as a target of miR-628-3p and play roles in the pathogenesis of atrophic nonunion [41].
In the present study, by detecting CtBP levels in a large number of atrophic nonunion clinical samples, we found that CtBP2, but not CtBP1, was significantly overexpressed in nonunion samples compared to healthy controls. To investigate how CtBP2 is involved in nonunion pathogenesis, we performed microarray, LC-MS/MS mass spectrometry and chromatin immunoprecipitation (ChIP) experiments and found that CtBP2 can form a transcriptional complex with p300 and Runx2, which ultimately regulates the expression of many genes related to bone development and differentiation, such as OSC, ALPL, SPP1, COL1A1, IBSP and MMP13. In addition, we also detected the expression of the CtBP-p300-Runx2 complex and its downstream target genes in both high and low intracellular NADH conditions. Our results indicated that atrophic nonunion osteoblast cells had decreased NADH levels, which resulted in the dissociation of the CtBP2 homodimer and therefore enhanced its binding and inhibition of the p300-Runx2 complex, causing the downregulation of their targets and leading to the occurrence of atrophic nonunion.
2. Materials and methods
2.1 Tissue samples
Patients who had fibular head fracture and underwent surgery and therapy from May 2012 to April 2015 at the Department of Orthopedics of Honghui Hospital were selected for this study. Twenty-four tissue samples were collected from the bony callus formed around the steel plates in normal healing patients, and the other 24 tissue samples were taken from the scar tissues of atrophic nonunion patients. The tissue samples were acquired with written informed consent from patients following protocols approved by the ethical board of Xi'an Jiaotong University. The basic information of these patients is summarized in Supplementary Table 1. All of the related experimental procedures were strictly performed following protocols approved by the ethical board of Xi'an Jiaotong University.
2.2 Human primary osteoblast cell isolation, culture and transfection
Primary osteoblasts from healthy controls and atrophic nonunion samples were isolated following a method previously described [42]. Briefly, samples were minced into 1 mm pieces and digested with 1.25 mg/mL collagenase (Thermo Fisher Scientific, USA, #17100017) in Hank's Balanced Salt Solution (HBSS) (Thermo Fisher Scientific, #14025126) with shaking at a speed of 20 rpm for 30 min. The released cells were discarded and then washed with Dulbecco's Modified Eagle Medium (DMEM) (Thermo Fisher Scientific, #12491015) solution three times. Bone pieces were subsequently treated with 4 mM EGTA and 1.25 mg/mL collagenase for 20 min and 30 min, respectively. The released cells were collected with a 100-μm nylon cell strainer and subsequently cultured in DMEM medium at 37°C with 5% CO2 for 7 days to ensure that the outgrowing cells adhere to the dishes. The plasmid transfection was performed using HiPerFect Transfection Reagent (QIAGEN, USA, #301705) following the manufacturer's instructions.
2.3 Immunoprecipitation (IP) and mass spectrometry analysis
The IP analysis was performed as previously described [43]. Briefly, the primary HOB cells expressing pCDNA3-2xFlag-3xHA-CtBP2 or pCDNA3-2xFlag-3xHA were lysed with RIPA buffer (Sigma, USA, #R0278) supplemented with complete protease inhibitor (Roche, USA, #11697498001). Cell lysates were subjected to a two-step purification procedure. First, the centrifuged cell lysate was incubated with anti-Flag-agarose (Sigma, USA, #A4596) at 4°C for 6 hours. Then, the protein-bound beads were washed with RIPA buffer five times, followed by elution with Flag peptide (Sigma, #F3290) for four hours at room temperature. The resulting proteins were immunoprecipitated with anti-HA-agarose for at 4°C for 6 hours, and after washing five times with RIPA buffer, the HA-CtBP2 protein complex was loaded onto SDS-PAGE gels for electrophoresis, followed by staining with Coomassie Brilliant Blue R 250 (Thermo Fisher Scientific, #20278). The stained proteins were cut into small pieces, followed by digestion with trypsin. The resulting proteins were analyzed by liquid chromatography-tandem mass spectrometry (LC-MS/MS), and the obtained data were used to search the NCBI database using the MASCOT search engine (V.2.3).
2.4 Coimmunoprecipitation (Co-IP) and immunoblot analysis
The primary HOB cells expressing pCDNA3-2xFlag-CtBP2+pCDNA3-6xMyc-p300, pCDNA3-2xFlag-CtBP2+pCDNA3-6xMyc, pCDNA3-2xFlag+pCDNA3-6xMyc-p300, pCDNA3-2xFlag-CtBP2+pCDNA3-6xMyc-Runx2, pCDNA3-2xFlag-CtBP2+pCDNA3-6xMyc, pCDNA3-2xFlag+pCDNA3-6xMyc-Runx2, pCDNA3-2xFlag-Runx2+pCDNA3-6xMyc-p300, pCDNA3-2xFlag-Runx2+pCDNA3-6xMyc, or pCDNA3-2xFlag+pCDNA3-6xMyc-p300 were lysed with RIPA buffer supplemented with complete protease inhibitor. Cell lysates were centrifuged at 13,000 rpm for 15 min at 4°C. The resulting supernatant was incubated with anti-Flag-agarose and anti-Myc-agarose (Sigma, #A7470) at 4°C for four hours. After washing five times with RIPA buffer, the IP products were detected via immunoblot analysis. The blots were probed with primary anti-Flag (Sigma, USA), anti-Myc (Sigma, #F1804), anti-CtBP2 (BD Biosciences, USA, #612044), anti-p300 (Santa Cruz Biotechnology, USA, #sc-585), anti-GAPDH (Santa Cruz Biotechnology, #sc-365062), or anti-Runx2 (Santa Cruz Biotechnology, #sc-101145) antibodies, and the chemiluminescence signals were detected by autoradiography.
2.5 RNA isolation and quantitative real-time PCR (qRT-PCR)
The total RNA was extracted using TRIzol reagent (Thermo Fisher Scientific, #15596026) following the manufacturer's instructions. For each sample, 0.5 μg of RNA was used for reverse transcription to synthesize cDNA with a ProtoScript First Strand cDNA Synthesis Kit (New England Biolabs, USA, E6300S). The obtained cDNA was diluted 100-fold and subjected to gene expression determination by qRT-PCR with a SYBR Green Master Mix Kit (Bio-Rad, USA, #1725271) using the primers listed in Supplementary Table 2. The PCR procedure conditions were 95°C for 2 min, followed by 55 cycles of 95°C for 15 s and 68°C for 30 s. The individual gene expression was normalized against β-actin (ACTB) according to the 2-ΔCt method.
2.6 Microarray analysis
The microarray analysis was performed as previously described [44]. Briefly, the total RNA was extracted using TRIzol reagent following the manufacturer's instructions, and the RNA quality was measured using an Agilent Bioanalyzer (Agilent Technologies, USA, G2939BA). A total of 2 μg of RNA of each sample was labeled with biotin and then synthesized into cRNA using a GeneChip 3' IVT Express Kit (Thermo Fisher Scientific, #902416), followed by fragmentation and incubation with the array chip (GeneChip Human Genome U133 Plus 2.0, Thermo Fisher Scientific, #900466) for 12 hours at 45°C. After staining with streptavidin-phycoerythrin (SAPE) for 300 seconds at 35°C, arrays were scanned using a GeneArrayTM Scanner. Data were obtained and analyzed using GeneSpring GX (Agilent Technologies Inc., USA).
2.7 Chromatin immunoprecipitation (ChIP) assay
The ChIP assay was performed as previously described [45]. Briefly, cells were washed once with 1x PBS at room temperature and then crosslinked with 1x PBS containing 1% formaldehyde for 30 minutes. The fixed cells were sonicated to an average size of 300-500 bp, and cell lysates were subjected to chromatin precipitation with a Millipore ChIP Assay Kit (Millipore, USA, #17295) following the manufacturer's protocol. Chromatin fragments were immunoprecipitated with the following antibodies: anti-CtBP1 (#612042) and anti-CtBP2 (#612044) from BD Biosciences, mouse IgG (#sc-2025), anti-Pol II (#sc-47701), anti-HDAC1 (#sc-8410), anti-acetyl-histone H3 (#sc-8655), anti-p300 (#sc-585) and anti-Runx2 (#sc-101145) from Santa Cruz Biotechnology. The immunoprecipitated DNA was analyzed by qRT-PCR using the primers listed in Supplementary Table 3.
2.8 Statistical analysis
All experiments in the current study were independently repeated at least three times. Statistical analyses were performed using SPSS version 22 software. Statistical significance was set at a P-value less than 0.05.
Results
3.1 CtBP2 is significantly overexpressed in atrophic nonunion tissues
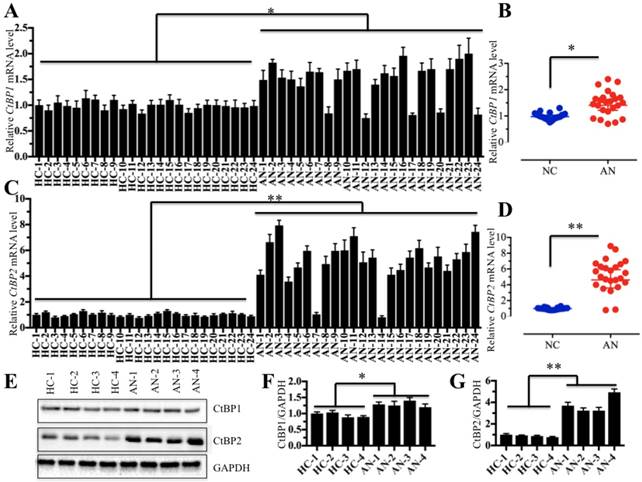
The aberrant expression of CtBPs is closely associated with the occurrence of numerous diseases [27-30], and thus, we sought to detect whether they also play a role in the pathogenesis of atrophic nonunion. Accordingly, we collected 48 samples, including 24 tissues from patients with normal fracture healing and 24 tissues from patients with atrophic nonunion, and then examined the mRNA and protein levels of CtBPs in these tissues. Primarily, we performed qRT-PCR assays to detect CtBP mRNA levels, and our results indicated that the CtBP1 mRNA level was slightly increased (∼1.4- to 1.8-fold) in nearly 80% (19/24) of the atrophic nonunion tissues compared to normal fracture healing tissues (Figures 1A and 1B). However, the CtBP2 mRNA level was significantly increased (∼3- to 9-fold) in over 90% (22/24) of the atrophic nonunion tissues compared to the normal tissues (Figures 1C and 1D). Then, we detected both the CtBP1 and CtBP2 protein levels in four atrophic nonunion tissues and four normal tissues. Similar to their mRNA levels, we only observed a slight increase of the CtBP1 protein level (∼1.2- to 1.4-fold) (Figures 1E and 1F) but a significant increase of the CtBP2 level (∼3- to 5-fold) (Figures 1E and 1G) in four atrophic nonunion tissues. Osteoblast cells are useful tools in studying bone formation and development as well as the formation of atrophic nonunion. However, there were no commercial osteoblast cell lines from atrophic nonunion. Thus, we isolated the primary osteoblast cells from four normal fracture healing tissues (namely, HOB-1, HOB-2, HOB-3 and HOB-4) and four atrophic nonunion tissues (namely, AOB-1, AOB-2, AOB-3 and AOB-4) and measured the CtBP mRNA and protein levels in these osteoblast cells. Similarly, we also found that CtBP1 mRNA and protein levels were only slightly increased, whereas the CtBP2 mRNA and protein levels were significantly upregulated in AOB cells compared to HOB cells (Supplementary Figure 1). Collectively, our data demonstrated that the overexpression of CtBPs, especially CtBP2, in atrophic nonunion tissues is a common phenomenon, which implies that CtBP2 may play an important role in the pathogenesis of nonunion. Based on the results that CtBP2 is more significantly induced than CtBP1, our following investigation will only focus on exploring how CtBP2 overexpression leads to the occurrence of nonunion.
3.2 Runx2 is dramatically downregulated in atrophic nonunion tissues
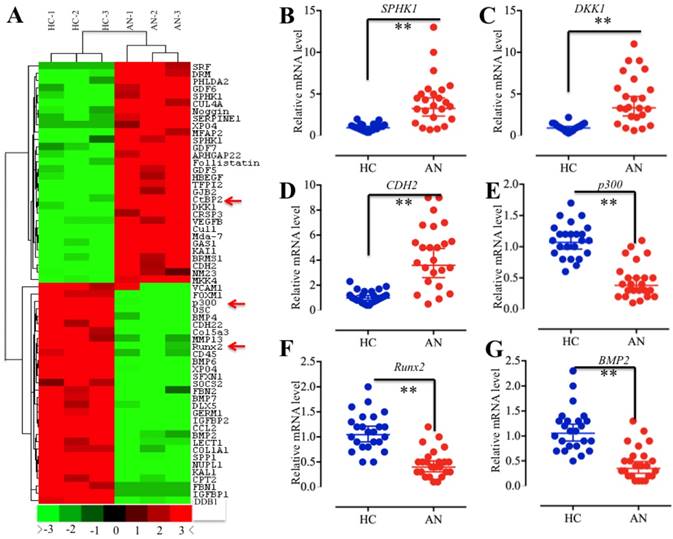
Given that CtBP2 functions as a corepressor that associates or directly interacts with TFs to regulate gene expression [15, 27-30], we next sought to identify the TFs associated with CtBP2 in the pathogenesis of atrophic nonunion. For this purpose, we isolated mRNAs from three normal fracture healing tissues (HC-1, HC-2 and HC-3) and three atrophic nonunion tissues (AN-1, AN-2 and AN-3), followed by subjecting them to microarray analysis. Overall, a total of 262 genes were identified as having aberrant levels in atrophic nonunion tissues compared to healthy controls (Supplementary Table 4). Among them, 127 genes were upregulated, and the other 135 genes were downregulated (Supplementary Table 4). In Figure 2A, we showed the top 30 upregulated and 30 downregulated genes with the most significant changes. Interestingly, we found CtBP2 in these upregulated genes. Among the downregulated genes, we found p300, Runx2, and a series of Runx2 target genes, such as COL1A1, SPP1, OSC, ALPL, IBSP and MMP13 (Figure 2A, Supplementary Table 4). To verify the reliability of the microarray results, we randomly chose three upregulated genes (SPHK1, DKK1 and CDH2) and three downregulated genes (p300, Runx2 and BMP2) for qRT-PCR verification in all clinical samples. Consistent with the microarray results, the qRT-PCR results indicated that the expression levels of SPHK1, DKK1 and CDH2 were significantly upregulated while the expression levels of p300, Runx2 and BMP2 were dramatically downregulated in all atrophic nonunion tissues compared to the healthy controls (Figures 2B-2G). These results, together with previous reports that CtBPs directly interact with p300 through the PXDLS motif and that p300 forms a complex with Runx2 to initiate transcription [21, 22, 39, 40], imply that there is a high possibility that CtBP2 forms a transcriptional complex with p300 and Runx2.
CtBP2 is overexpressed in atrophic nonunion tissues. (A and B) The relative mRNA levels of CtBP1 in normal fracture healing tissues (HC, n=24) and atrophic nonunion tissues (AN, n=24) determined by qRT-PCR. *P<0.05. (C and D) The relative mRNA levels of CtBP2 in the same tissues as (A) examined by qRT-PCR. **P<0.001. (E) The protein levels of CtBP1 and 2 in HC (n=4) and AN (n=4) tissues. GAPDH was used as a control. (F and G) Statistical analysis of the relative protein levels of CtBP1 and 2 in (E). *P<0.05. **P<0.001.
3.3 CtBP2 forms a transcriptional complex with p300 and Runx2
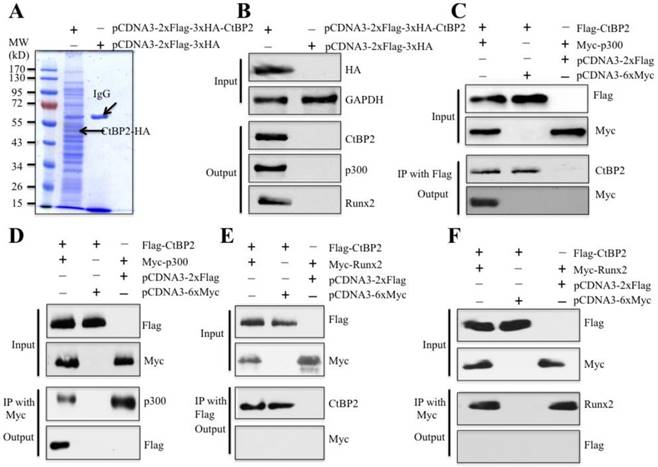
To verify whether CtBP2 can form a complex with p300 and Runx2 in vivo and identify other members of this complex, we primarily constructed a two-epitope-tagged vector pCDNA3-2xFlag-3xHA-CtBP2 and transfected it into HOB-1 primary osteoblast cells. After a two-step purification method with anti-Flag-agarose and anti-HA-agarose to remove unspecific binding proteins, the CtBP2-associated proteins were enriched (Figure 3A) and subjected to LC-MS/MS analysis. By applying the obtained peptides for comparison in the NCBI database, we identified a total of 145 proteins that were associated with CtBP2 (Supplementary Table 5). As expected, we identified p300, Runx2 and HDAC1 in these 145 CtBP2 associated proteins (Supplementary Table 5). Next, we verified the association of CtBP2 with p300, Runx2 and HDAC1 in materials used for LC-MS/MS analysis. As shown in Figure 3B, HA-CtBP2 can pull down p300, Runx2 and HDAC1, but not the negative control that was immunoprecipitated from cells expressing a pCDNA3-2xFlag-3xHA empty vector. In addition, we also detected if CtBP2 can directly interact with p300 and Runx2. Accordingly, we transfected HOB-1 cells with the following combinations of plasmids: pCDNA3-2xFlag-CtBP2 + pCDNA3-6xMyc-p300, pCDNA3-2xFlag-CtBP2 + pCDNA3-6xMyc, pCDNA3-2xFlag + pCDNA3-6xMyc-p300, pCDNA3-2xFlag-CtBP2 + pCDNA3-6xMyc-Runx2, and pCDNA3-2xFlag + pCDNA3-6xMyc-Runx2. After Co-IP with either anti-Flag-agarose or anti-Myc-agarose to obtain Flag-CtBP2, Myc-p300 and Myc-Runx2 proteins, we subjected them to immunoblots to determine the direct interactions between CtBP2 and p300 as well as CtBP2 and Runx2. As shown in Figures 3C and 3D, Flag-CtBP2 and Myc-p300 were able to pull each other down, suggesting direct interactions between them. However, we did not find direct interactions between Flag-CtBP2 and Myc-Runx2 (Figures 3E and 3F).
The aberrant gene expression profile in atrophic nonunion tissues. (A) The heat maps of the top 30 downregulated and upregulated genes with the most significant changes in three atrophic nonunion tissues. The mRNAs from three normal fracture healing tissues (HC-1, HC-2 and HC-3) and three atrophic nonunion tissues (AN-1, AN-2 and AN-3) were subjected to microarray analysis. The red or green colors indicated differentially up- or downregulated genes, respectively. The red arrows indicated genes that were interesting. (B-G) Verification of gene levels identified in microarray analysis in 24 healthy tissues and 24 atrophic nonunion tissues. The qRT-PCR was performed to verify the expressions of three upregulated genes, including SPHK1 (B), DKK1 (C), and CDH2 (D), and three downregulated genes, including p300 (E), Runx2 (F), and BMP2 (G). ** P < 0.001.
Given that previous publications have reported the direct interaction between p300 and Runx2 [40], we next sought to verify this interaction in the primary HOB-1 cells. For this purpose, we transfected HOB-1 cells with the following combinations of plasmids: pCDNA3-2xFlag-Runx2 + pCDNA3-6xMyc-p300, pCDNA3-2xFlag-Runx2 + pCDNA3-6xMyc, and pCDNA3-2xFlag + pCDNA3-6xMyc-p300. After Co-IP with either anti-Flag-agarose or anti-Myc-agarose, the purified Flag-Runx2 and Myc-p300 proteins were subjected to immunoblots to determine the direct interactions between p300 and Runx2. Our results indicated that both Flag-Runx2 and Myc-p300 were able to pull each other down (Supplementary Figures 2A and 2B), suggesting direct interactions between them. These results clearly indicated that CtBP2 formed a complex with p300 and Runx2 through the direct interactions between CtBP2-p300 and p300-Runx2.
In Supplementary Figure 1, we showed that CtBP2 mRNA and protein levels were significantly upregulated in AOB cells compared to HOB cells. We next sought to examine the p300 and Runx2 levels in AOB primary osteoblast cells. By subjecting cell lysates to immunoblot analyses, interestingly, we found that the protein levels of p300 and Runx2 were significantly reduced in AOB cells, which was opposite to the CtBP2 level (Supplementary Figure 2C). To further confirm this observation, we transfected CtBP2-specific siRNA into two HOB cell lines (HOB-1 and HOB-2) and in two AOB cell lines (AOB-1 and AOB-2) to knockdown the CtBP2 level. As shown in Supplementary Figure 2D, p300 and Runx2 protein levels were significantly increased with the downregulation of CtBP2. These results implied that CtBP2 plays an inhibitory role in regulating p300-Runx2 complex formation.
3.4 The CtBP2-p300-Runx2 transcriptional complex inhibits the expression of genes involved in bone formation and differentiation
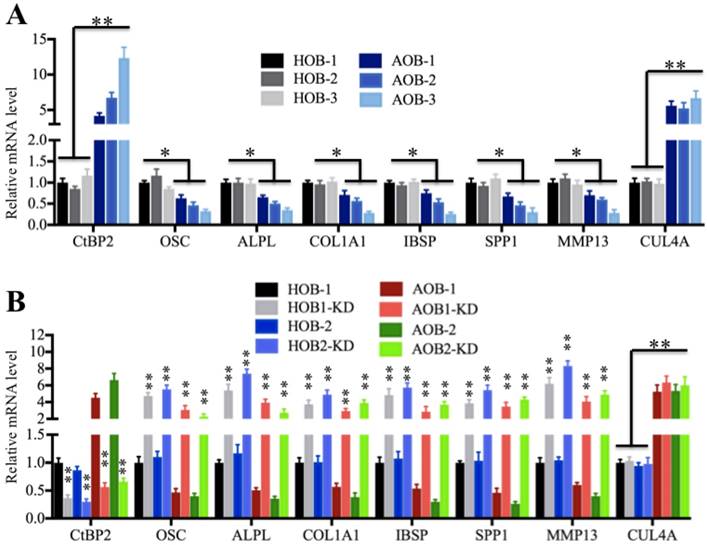
As mentioned earlier, Runx2 can regulate the expression of a number of critical members (e.g., OSC, ALPL, SPP1, COL1A1, IBSP and MMP13) involved in osteoblast development and bone formation [35-40], and we also identified that these genes were significantly downregulated in AOB cells in microarray assays (Supplementary Table 4). To verify this observation, we measured the mRNA levels of these genes in AOB primary osteoblast cells using CUL4A as a control, which was upregulated in atrophic nonunion tissues (Figure 2A). The qRT-PCR results indicated that the expressions of OSC, ALPL, SPP1, COL1A1, IBSP and MMP13 were downregulated in AOB cells compared to HOB cells, with the most obvious decrease in AOB-3 cells (∼2.5-fold) (Figure 4A), which was contrary to the expression of CtBP2. To further determine if the expressions of these genes were correlated with the CtBP2 level, we knocked down CtBP2 with its specific siRNA in AOB and HOB cells and then examined these Runx2 target gene levels. As shown in Figure 4B, the expression of OSC, ALPL, SPP1, COL1A1, IBSP and MMP13 but not CUL4A was significantly upregulated with the downregulation of CtBP2. Moreover, we also examined the protein levels of OSC, COL1A1, SPP1, MMP13 and CUL4A, and found they showed similar patterns as their corresponding mRNA levels (Supplementary Figure 3). These results demonstrated that CtBP2 repressed the expression of Runx2 downstream targets.
CtBP2 forms a complex with p300 and Runx2 in vivo. (A) In vivo pull-down of the Flag-HA-CtBP2-associated complexes. The HOB-1 cells were transfected with pCDNA3-2xFlag-3xHA-CtBP2 or pCDNA3-2xFlag-3xHA. After 48 hours, the cells were lysed and subjected to IP analysis. The resulting protein complexes were loaded onto SDS-PAGE gel for separation and then stained with Coomassie Brilliant Blue R 250. The IgG and CtBP2 bands were indicated. (B) Verification of CtBP2-associated proteins identified in LC-MS/MS analysis. The protein samples used in (A) were used to verify the association of CtBP2, p300 and Runx2. (C and D) CtBP2 directly interacted with p300 in HOB-1 cells. The HOB-1 cells were cotransfected with pCDNA3-2xFlag-CtBP2 + pCDNA3-6xMyc-p300, pCDNA3-2xFlag-CtBP2 + pCDNA3-6xMyc, or pCDNA3-2xFlag + pCDNA3-6xMyc-p300. After 48 hours, the cells were lysed and subjected to IP analysis with either anti-Flag-agarose (C) or anti-Myc-agarose (D). The pull-down products were then subjected to western blot with the antibodies indicated in the figures. (E and F) CtBP2 cannot directly interact with Runx2 in HOB-1 cells. The HOB-1 cells were cotransfected with pCDNA3-2xFlag-CtBP2 + pCDNA3-6xMyc-Runx2, pCDNA3-2xFlag + pCDNA3-6xMyc-Runx2, or pCDNA3-2xFlag-CtBP2 + pCDNA3-6xMyc. After 48 hours, the cells were lysed and subjected to IP analysis with either anti-Flag-agarose (E) or anti-Myc-agarose (F). The pull-down products were then subjected to western blot with the antibodies indicated in the figures.
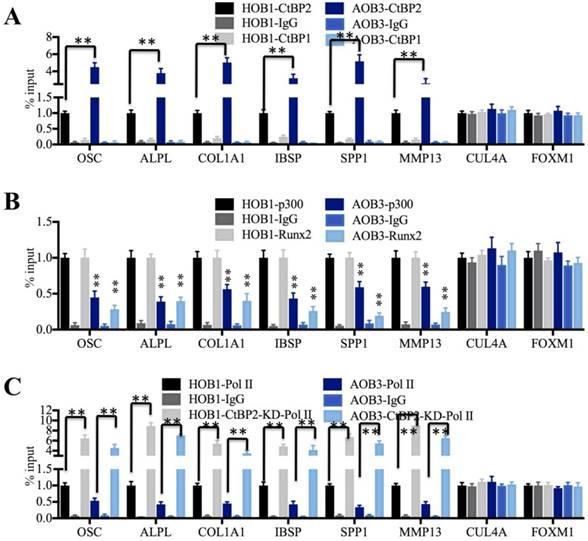
The transcriptional complex normally binds directly to promoter regions and initiates transcription [5-8]. To verify if the CtBP2-p300-Runx2 complex could bind to the promoters of these Runx2 target genes, we performed anti-CtBP2, anti-p300 and anti-Runx2 ChIP-coupled qRT-PCR assays in AOB and HOB cells using anti-CtBP1 and anti-IgG as controls. Our results revealed that CtBP2 occupancy on the promoters of these Runx2 target genes was significantly increased in AOB cells compared to HOB cells (Figure 5A). However, CtBP1 cannot directly bind to the promoters of these genes because it had a similar occupancy to that of anti-IgG, which was significantly lower than CtBP2 occupancy (Figure 5A). As expected, the occupancies of p300 and Runx2 were dramatically decreased in AOB cells compared to HOB cells (Figure 5B). Given that TFs normally couple with RNA polymerase II (Pol II) and bind to gene promoters to begin transcription [46, 47], we further performed an anti-Pol II ChIP assay to compare Pol II occupancy on the promoters of Runx2 target genes in AOB and HOB cells with and without CtBP2 knockdown. The occupancy of Pol II was dramatically decreased in AOB cells compared to HOB cells (Figure 5C). Interestingly, all Runx2 target genes displayed significantly increased Pol II binding to their promoters with CtBP2 knockdown, ranging from 4- to 9-fold compared to the scrambled siRNA-treated cells (Figure 5C). In addition, we also performed anti-p300 and anti-Runx2 ChIP assays in AOB and HOB cells with and without CtBP2 knockdown. The qRT-PCR results indicated that all Runx2 target genes displayed significantly increased p300 or Runx2 binding to their promoters with CtBP2 knockdown (Supplementary Figure 4). These results suggested that CtBP2 acted as a repressor to inhibit the p300-Runx2 transcriptional complex and thereby limited Pol II binding as well as repressed the expression of Runx2 target genes.
Runx2 target genes are downregulated in AOB cells. (A) Runx2 target genes are downregulated in AOB cells. The relative mRNA levels of Runx2 target genes, including OSC, ALPL, SPP1, COL1A1, IBSP and MMP13, in HOB and AOB cells were determined by qRT-PCR. CUL4A was used as a control. *P<0.05. (B) The expression of Runx2 target genes was dependent on the CtBP2 level. The HOB-1, HOB-2, AOB-1 and AOB-2 cells were transfected with control-siRNA or CtBP2-siRNA, respectively. After 48 hours, the cells were subjected to RNA isolation, followed by measuring the expression of Runx2 target genes by qRT-PCR. CUL4A was used as a control. **P<0.001.
3.5 An elevated NADH level upregulates Runx2 target gene levels in AOB cells
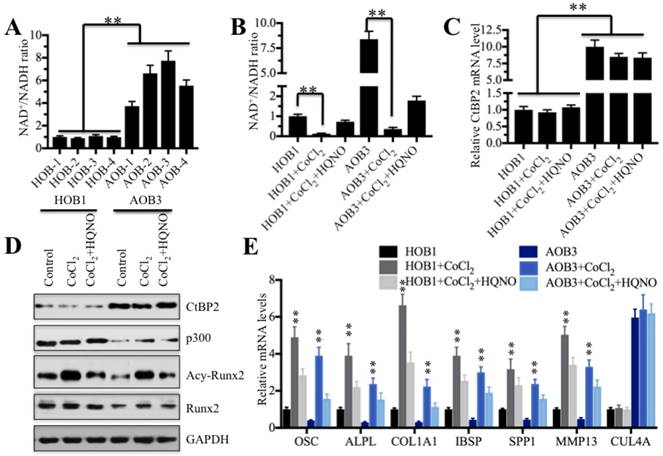
Numerous publications have reported that intracellular NADH level determines the formation of CtBP dimers and their associated binding partners [26-34]. Our above results indicated significant differences between CtBP2 and its transcriptional complex partners p300 and Runx2 in AOB and HOB cells. Thus, we speculated that the NADH levels in these two types of cells are also different. To test this hypothesis, we first determined the NAD+/NADH levels in AOB and HOB cells. As expected, our results showed that NAD+/NADH levels in AOB cells were significantly increased compared to HOB cells (Figure 6A), indicating that NADH levels in AOB cells were decreased. According to previous reports, the decreased NADH levels inhibited the formation of CtBP dimers [16, 34], which facilitates the tight binding of the CtBP monomer to p300 and inhibits downstream transcription [16, 26-34]. Based on this notion, we treated HOB and AOB cells with or without 200 μM cobalt chloride (CoCl2) and the combination of CoCl2 and 2-n-heptyl-4-hydroxyquinoline N-oxide (HQNO) to change intracellular NADH levels. The chemical CoCl2 can increase the NADH level [16], and HQNO is a high affinity inhibitor of NADH [48, 49]. As shown in Figure 6B, the CoCl2 treatment significantly increased the NADH levels in both HOB and AOB cells while the addition of HQNO reduced the NADH levels. Then, we measured the CtBP2 mRNA levels in these treated cells. Interestingly, we did not observe an obvious change in the CtBP2 mRNA level with either CoCl2 treatment alone or the combination of CoCl2 and HQNO (Figure 6C). In addition, we also examined the protein levels of CtBP2, p300, Runx2 and acetylated Runx2. As shown in Figure 6D, the CoCl2 treatment alone and combined treatment with CoCl2 and HQNO could not change the protein levels of CtBP2, p300 or Runx2. However, we found that the acetylated Runx2 was significantly upregulated with CoCl2 treatment but dramatically decreased with the addition of HQNO (Figure 6D). One possible explanation is that CtBP2 forms dimers with the increase of the NADH level, which reduces its inhibitory effect on p300 and enhances p300 activity, thereby facilitating the acetylation of Runx2.
Despite the fact that intracellular NADH level changes did not affect the mRNA and protein levels of CtBP2, p300 and Runx2, we speculated that the alterations of acetylated Runx2 with NADH level changes should affect its downstream targets. To verify this hypothesis, we examined the expression of Runx2 target genes in cells treated with CoCl2 and CoCl2+HQNO. Consistent with our expectation, CoCl2 treatment significantly increased the expression of Runx2 target genes in both AOB and HOB cells (Figure 6E), whereas the addition of HQNO markedly attenuated the expression of these genes (Figure 6E). In contrast, we did not find any change regarding CUL4A in these cells under different treatments (Figure 6E). In addition, we also performed ChIP-coupled qRT-PCR assays in HOB cells treated with CoCl2 and CoCl2+HQNO using anti-acetyl-Runx2. Our results revealed that the acetylated Runx2 occupancy on the promoters of Runx2 target genes was significantly increased in HOB cells treated with CoCl2 compared to no treatment or CoCl2+HQNO treated cells (Supplementary Figure 5). These results demonstrated that the elevated NADH level upregulated Runx2 target gene levels through the increased occupancy of acetylated Runx2.
The CtBP2-p300-Runx2 transcriptional complex specifically binds to the Runx2 target gene promoters. (A) The CtBP2 was significantly enriched on the promoters of Runx2 target genes in AOB cells. The HOB-1 and AOB-3 cells were subjected to ChIP assays with CtBP1, CtBP2 and IgG antibodies, followed by analysis with qRT-PCR to evaluate their binding to the promoters of Runx2 target genes. CUL4A and FOXM1 were used as controls. **P<0.001. (B) The binding of p300 and Runx2 on the promoters of Runx2 target genes was dramatically decreased in AOB cells. The HOB-1 and AOB-3 cells were subjected to ChIP assays with p300, Runx2 and IgG antibodies, followed by analysis with qRT-PCR to evaluate their binding to the promoters of Runx2 target genes. CUL4A and FOXM1 were used as controls. **P<0.001. (C) The binding of Pol II on the promoters of Runx2 target genes was dramatically decreased in AOB cells. The HOB-1 and AOB-3 cells were transfected with control siRNA and CtBP2-siRNA and subjected to ChIP assays with Pol II and IgG antibodies, followed by analysis with qRT-PCR to evaluate their binding to the promoters of Runx2 target genes. CUL4A and FOXM1 were used as controls. **P<0.001.
NADH levels determine Runx2 target gene expression. (A) The NAD+/NADH levels in AOB cells were significantly increased. Four HOB cell samples (1-4) and four AOB cell samples (1-4) were subjected to measure the NAD+/NADH levels. **P<0.001. (B) The CoCl2 treatment dramatically decreased the NAD+/NADH levels. The HOB1 and AOB cells were treated with CoCl2 or CoCl2+HQNO, and then, the NAD+/NADH levels were measured. **P<0.001. (C) Treatments with CoCl2 or CoCl2+HQNO cannot affect the CtBP2 mRNA level. The mRNAs from cells used in (B) were subjected to qRT-PCR analysis to determine the CtBP2 levels. **P<0.001. (D) The CoCl2 treatment significantly increased Runx2 acetylation. Cells used in (B) were subjected to western blot to examine the CtBP2, p300, Runx2 and acetylated-Runx2 levels. GAPDH was used as a control. (E) The CoCl2 treatment significantly increased the expressions of Runx2 target genes. The mRNAs used in (C) were subjected to qRT-PCR analysis to determine the expressions of Runx2 target genes including OSC, ALPL, SPP1, COL1A1, IBSP and MMP13. CUL4A was used as a control. **P<0.001.
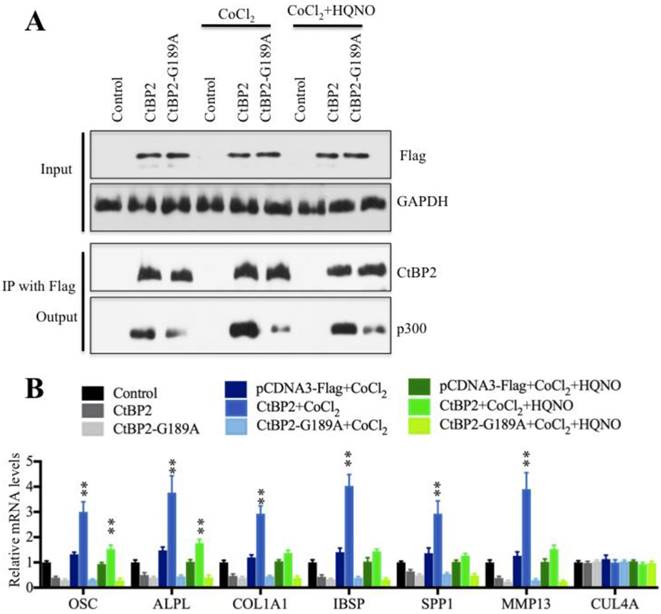
To verify that CtBP2 dimerization is a critical step for the regulation of Runx2 target genes, we then performed a Co-IP assay to detect the interactions between p300 and wild-type CtBP2 or the nondimerizing mutant CtBP2-G189A in the low and high NADH conditions. Our results indicated that p300 was most abundant in HOB cells treated with CoCl2 (high NADH), which decreased dramatically in the conditions of no treatment and CoCl2+HQNO treatment (low NADH) (Figure 7A). Interestingly, the protein level of p300 in cells expressing pCDNA3-2xFlag-CtBP2-G189A mutant was much lower than cells expressing pCDNA3-2xFlag-CtBP2 in different treatments (Figure 7A). And more importantly, the changes in the NADH levels did not affect p300 level in cells harboring CtBP2-G189A mutant (Figure 7A). These results indicated that CtBP2 dimerization determined p300 level because the undimerized CtBP2 in low NADH condition preferred to bind to p300. Meanwhile, we also examined the expression of Runx2 target genes in these conditions. Our results showed that the expression of OSC, ALPL, SPP1, COL1A1, IBSP and MMP13 was significantly increased with the CoCl2 treatment compared to no treatment or CoCl2+HQNO treatment (Figure 7B) while their expressions were not changed in CtBP2-G189A-containing cells under different treatments (Figure 7B). These results suggested that CtBP2 dimerization might determine the expression of Runx2 target genes.
3.6 HDACs are not required for the transcription of Runx2 target genes
Normally, CtBPs regulate gene transcription in two different manners: one is through interactions with acetyltransferases (e.g., p300, CBP and PCAF), and the other is through interactions with histone deacetylases (e.g., HDAC1 and 2) [16]. In our LC-MS/MS results, we also found that CtBP2 could immunoprecipitate with HDAC1 and 2. To investigate if HDAC1 and 2 are also involved in the pathogenesis of nonunion, we primarily detected HDAC1 and 2 mRNA and protein levels in HOB and AOB cells. The results showed that both the mRNA and protein levels of HDAC1 and 2 were not obviously changed in these two different cell sources (Supplementary Figures 6A and 6B). In addition, we also knocked down HDAC1 and 2 with their specific siRNAs in both HOB and AOB cells, followed by the detection of Runx2 target gene expression. Our results indicated that the expressions of OSC, ALPL, SPP1, COL1A1, IBSP and MMP13 were not changed with the knockdown of HDAC1 and 2 (Supplementary Figure 6C). These results suggested that HDAC1 and 2 are not required for the transcriptional regulation of Runx2 target genes in HOB and AOB cells. To further confirm this conclusion, we also performed ChIP-coupled qRT-PCR assays in AOB and HOB cells to evaluate the occupancies of HDAC1 and 2 on the promoters of Runx2 target genes. Our results indicated that the occupancies of HDAC1, HDAC2 and the negative control IgG were not significantly different, suggesting that HDAC1 and 2 cannot bind to the promoters of these Runx2 target genes (Supplementary Figure 6D). These results suggested that HDAC1 was not required for the Runx2-mediated transcription in AOB and HOB cells.
4. Discussion
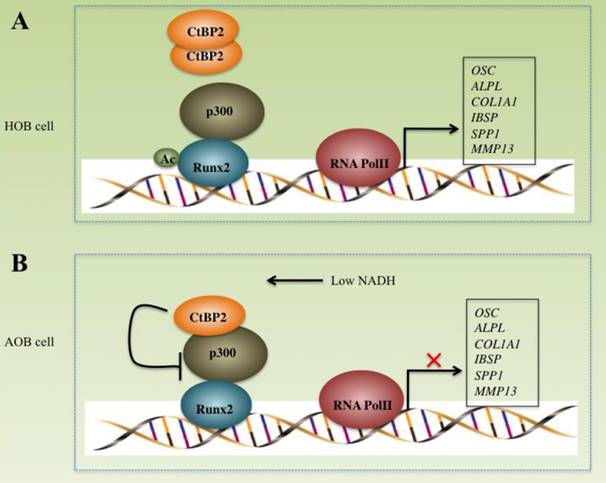
CtBPs play important roles in the pathogenesis of many diseases including cancer and inflammation [16, 27-30]. However, their roles in bone formation and differentiation have not been reported. In this study, we found that CtBP2, but not CtBP1, is significantly overexpressed in atrophic nonunion tissues with a mechanism involved in the regulation of the p300-Runx2 transcriptional complex and its downstream targets. Our results clearly demonstrate that CtBP2 forms a dimer, thus relieving its inhibition of the p300-Runx2 transcriptional complex in normal cells (Figure 8A). However, in AOB cells, the dissociation of CtBP2 dimers mediated by a low NADH level represses the activity of p300, thus significantly inhibiting the expression of numerous Runx2 target genes (Figure 8B), which ultimately leads to nonunion.
NDAH levels determine CtBP2 dimerization and regulate Runx2 target gene levels. (A) The elevated NADH levels increased CtBP2 dimerization. The HOB-1 cells were transfected with a pCDNA3-2xFlag (control), pCDNA3-2xFlag-CtBP2 or pCDNA3-2xFlag-CtBP2-G189A plasmid. After 48 hours, cells were treated with CoCl2 or CoCl2+HQNO. The treated cells were then subjected to IP analysis with anti-Flag-agarose, and the pull-down products were then subjected to western blot with anti-Flag, anti-CtBP2 and p300. GAPDH was used as an input loading control. (B) The elevated NADH levels increased Runx2 target gene expression. The mRNAs from cells used in (A) were subjected to qRT-PCR analysis to determine the expression of Runx2 target genes, including OSC, ALPL, SPP1, COL1A1, IBSP and MMP13. CUL4A was used a control. **P<0.001.
Schematic models of the CtBP2-p300-Runx2 transcriptional complex. The working model of CtBP2-p300-Runx2 in HOB cells. In HOB cells, CtBP2 tends to form a dimer, which enhances p300 activity and increases the acetylation of Runx2, eventually initiating transcription and regulating the expression of bone development as well as the differentiation of related genes including OSC, ALPL, SPP1, COL1A1, IBSP and MMP13. (B) The working model of CtBP2-p300-Runx2 in AOB cells. In AOB cells, the decreased NADH level disrupts CtBP2 dimerization, which inhibits p300 activity and attenuates the acetylation of Runx2, eventually repressing the expression of Runx2 target genes.
CtBP1 and CtBP2 share over 80% identical amino acid sequences, and they exhibit partially functional redundancy in previous studies [15]. In the present study, we found that CtBP1 is only slightly upregulated (1.5- to 1.8-fold) in AOB cells compared to HOB cells while the CtBP2 overexpression is more than 3-fold and even up to 9-fold in some samples. Although we only focused our studies on revealing CtBP2 function, we cannot exclude the possibility that CtBP1 is also involved in the occurrence of nonunion. In addition, we also did not clarify the mechanism regarding CtBP2 overexpression in the current study, but in fact, we have started to investigate the underlying mechanisms using RNA sequencing (RNA-Seq). Our preliminary results show that several microRNAs are involved in the overexpression of CtBP2. By increasing or inhibiting the expression of these microRNAs, we found that the expression of CtBP2 also changed (data not shown).
In the LC-MS/MS results, we found that CtBP2 could immunoprecipitate p300 as well as HDAC1 and 2, which have been previously reported to function as transcriptional coactivators and repressors in the regulation of gene expression by acetylating and deacetylating histones in the promoters of their targeted genes, respectively [15, 16, 34]. CtBPs have been previously shown to interact with p300 as well as HDAC1 and 2 through the PXDLS motif [15, 16, 34]. Compared to the dramatic decrease of p300, we did not find changes in the HDAC1 and 2 levels in AOB cells, suggesting that HDAC1 and 2 are not required, or at least do not play a major role, in the pathogenesis of nonunion. Previous studies have shown that NADH levels determine the manner in which CtBPs regulate gene expression [15, 16, 34]. We found that AOB cells have lower NADH levels than HOB cells, which contributes to the dissociation of the CtBP2 dimer. However, we do not know the exact reason for the reduction of NADH in AOB cells. By increasing or decreasing intracellular NADH levels as well as using the CtBP2-G189A mutant, we demonstrate that CtBP2 can alternatively associate with Runx2 and regulate its acetylation by a mechanism dependent on the transition between the dimer and monomer forms of CtBP2. These results are consistent with previous publications that found that CtBP1 represses p300 activity dependent on NADH while the CtBP1-G189A mutant suppresses p300 independent of NADH [15, 16, 34]. The high sensitivity of CtBP in responding to the NADH level changes implies that increasing NADH levels in the diet of nonunion patients may improve the formation of nonunion.
In conclusion, our findings demonstrate that intracellular NADH levels regulate Runx2 target gene expression through a mechanism involving CtBP2 dimerization. Conditions that increase NADH levels facilitate CtBP2 dimerization and enhance p300 activity, whereas reduced NADH levels contribute to the formation of CtBP2 monomers and suppress p300-Runx2-mediated transcription.
Supplementary Material
Supplementary figures and tables.
Acknowledgements
This work was supported by the following sources: National Natural Science Foundation of China (81301604), Shaanxi Province Natural Science Foundation (2014JQ4164), China Postdoctoral Science Foundation (2017M613178) and Shaanxi Province Postdoctoral Science Foundation (2017BSHQYXMZZ13).
Authors' contributions
X.C. and K.W. designed the research and experiments. W.Z. and N.D. performed the majority of the experiments. Q.Z., T.S., and Z.L. performed some of the experiments. W.Z., N.D., X.C. and K.W. analyzed data, performed statistical analyses and wrote the manuscript. All authors reviewed and approved the manuscript.
Ethical approval statement
The clinical samples were acquired with written informed consent from all of the participants following protocols approved by the ethical board of Xi'an Jiaotong University College of Medicine. All experimental procedures used in this study were performed in accordance with the approved guidelines of the ethical board of Xi'an Jiaotong University College of Medicine.
Competing Interests
The authors declare that they have no competing financial or non-financial interests that might have influenced the performance or presentation of the work described in this manuscript.
References
1. Giannotti S, Bottai V, Dell'osso G, Pini E, De Paola G, Bugelli G, Guido G. Current medical treatment strategies concerning fracture healing. Clin Cases Miner Bone Metab. 2013;10:116-20
2. Reed AA, Joyner CJ, Brownlow HC, Simpson AH. Human atrophic fracture non-unions are not avascular. J Orthop Res. 2002;20:593-9
3. Mills L, Tsang J, Hopper G, Keenan G, Simpson AH. The multifactorial aetiology of fracture nonunion and the importance of searching for latent infection. Bone Joint Res. 2016;5:512-9
4. Panteli M, Pountos I, Jones E, Giannoudis PV. Biological and molecular profile of fracture non-union tissue: current insights. J Cell Mol Med. 2015;19:685-713
5. Lee TI, Young RA. Transcriptional regulation and its misregulation in disease. Cell. 2013;152:1237-51
6. Reiter F, Wienerroither S, Stark A. Combinatorial function of transcription factors and cofactors. Curr Opin Genet Dev. 2017;43:73-81
7. Payankaulam S, Li LM, Arnosti DN. Transcriptional repression: conserved and evolved features. Curr Biol. 2010;20:R764-71
8. Lamparter D, Marbach D, Rueedi R, Bergmann S, Kutalik Z. Genome-Wide Association between Transcription Factor Expression and Chromatin Accessibility Reveals Regulators of Chromatin Accessibility. PLoS Comput Biol. 2017;13:e1005311
9. Schoch H, Abel T. Transcriptional co-repressors and memory storage. Neuropharmacology. 2014;80:53-60
10. Perissi V, Aggarwal A, Glass CK, Rose DW, Rosenfeld MG. A corepressor/coactivator exchange complex required for transcriptional activation by nuclear receptors and other regulated transcription factors. Cell. 2004;116:511-26
11. Goodson M, Jonas BA, Privalsky MA. Corepressors: custom tailoring and alterations while you wait. Nucl Recept Signal. 2005;3:e003
12. Kawamura A, Koshida S, Takada S. Activator-to-repressor conversion of T-box transcription factors by the Ripply family of Groucho/TLE-associated mediators. Mol Cell Biol. 2008;28:3236-44
13. Chinnadurai G. CtBP, an unconventional transcriptional corepressor in development and oncogenesis. Mol Cell. 2002;9:213-24
14. Stankiewicz TR, Gray JJ, Winter AN, Linseman DA. C-terminal binding proteins: central players in development and disease. Biomol Concepts. 2014;5:489-511
15. Blevins MA, Huang M, Zhao R. The Role of CtBP1 in Oncogenic Processes and Its Potential as a Therapeutic Target. Mol Cancer Ther. 2017;16:981-90
16. Shen Y, Kapfhamer D, Minnella AM, Kim JE, Won SJ, Chen Y. et al. Bioenergetic state regulates innate inflammatory responses through the transcriptional co-repressor CtBP. Nat Commun. 2017;8:624
17. Sue N, Jack BH, Eaton SA, Pearson RC, Funnell AP, Turner J. et al. Targeted disruption of the basic Kruppel-like factor gene (Klf3) reveals a role in adipogenesis. Mol Cell Biol. 2008;28:3967-78
18. Paliwal S, Ho N, Parker D, Grossman SR. CtBP2 Promotes Human Cancer Cell Migration by Transcriptional Activation of Tiam1. Genes Cancer. 2012;3:481-90
19. Fujita E, Tanabe Y, Momoi MY, Momoi T. Cntnap2 expression in the cerebellum of Foxp2(R552H) mice, with a mutation related to speech-language disorder. Neurosci Lett. 2012;506:277-80
20. Patel J, Baranwal S, Love IM, Patel NJ, Grossman SR, Patel BB. Inhibition of C-terminal binding protein attenuates transcription factor 4 signaling to selectively target colon cancer stem cells. Cell Cycle. 2014;13:3506-18
21. Quinlan KG, Verger A, Kwok A, Lee SH, Perdomo J, Nardini M. et al. Role of the C-terminal binding protein PXDLS motif binding cleft in protein interactions and transcriptional repression. Mol Cell Biol. 2006;26:8202-13
22. Byun JS, Gardner K. C-Terminal Binding Protein: A Molecular Link between Metabolic Imbalance and Epigenetic Regulation in Breast Cancer. Int J Cell Biol. 2013;2013:647975
23. Hildebrand JD, Soriano P. Overlapping and unique roles for C-terminal binding protein 1 (CtBP1) and CtBP2 during mouse development. Mol Cell Biol. 2002;22:5296-307
24. Dias JM, Ilkhanizadeh S, Karaca E, Duckworth JK, Lundin V, Rosenfeld MG. et al. CtBPs sense microenvironmental oxygen levels to regulate neural stem cell state. Cell Rep. 2014;8:665-70
25. Hubler D, Rankovic M, Richter K, Lazarevic V, Altrock WD, Fischer KD. et al. Differential spatial expression and subcellular localization of CtBP family members in rodent brain. PLoS One. 2012;7:e39710
26. Bhambhani C, Chang JL, Akey DL, Cadigan KM. The oligomeric state of CtBP determines its role as a transcriptional co-activator and co-repressor of Wingless targets. EMBO J. 2011;30:2031-43
27. Birts CN, Harding R, Soosaipillai G, Halder T, Azim-Araghi A, Darley M. et al. Expression of CtBP family protein isoforms in breast cancer and their role in chemoresistance. Biol Cell. 2010;103:1-19
28. Zhang C, Li S, Qiao B, Yang K, Liu R, Ma B. et al. CtBP2 overexpression is associated with tumorigenesis and poor clinical outcome of prostate cancer. Arch Med Sci. 2015;11:1318-23
29. Zhang Q, Wang SY, Nottke AC, Rocheleau JV, Piston DW, Goodman RH. Redox sensor CtBP mediates hypoxia-induced tumor cell migration. Proc Natl Acad Sci U S A. 2006;103:9029-33
30. Chinnadurai G. The transcriptional corepressor CtBP: a foe of multiple tumor suppressors. Cancer Res. 2009;69:731-4
31. Birts CN, Bergman LM, Blaydes JP. CtBPs promote mitotic fidelity through their activities in the cell nucleus. Oncogene. 2011;30:1272-80
32. Zhang Q, Piston DW, Goodman RH. Regulation of corepressor function by nuclear NADH. Science. 2002;295:1895-7
33. Blevins MA, Kouznetsova J, Krueger AB, King R, Griner LM, Hu X. et al. Small Molecule, NSC95397, Inhibits the CtBP1-Protein Partner Interaction and CtBP1-Mediated Transcriptional Repression. J Biomol Screen. 2015;20:663-72
34. Kim JH, Cho EJ, Kim ST, Youn HD. CtBP represses p300-mediated transcriptional activation by direct association with its bromodomain. Nat Struct Mol Biol. 2005;12:423-8
35. Zhang C. Transcriptional regulation of bone formation by the osteoblast-specific transcription factor Osx. J Orthop Surg Res. 2010;5:37
36. Jang WG, Kim EJ, Kim DK, Ryoo HM, Lee KB, Kim SH. et al. BMP2 protein regulates osteocalcin expression via Runx2-mediated Atf6 gene transcription. J Biol Chem. 2012;287:905-15
37. Komori T. Regulation of bone development and extracellular matrix protein genes by RUNX2. Cell Tissue Res. 2010;339:189-95
38. Komori T. Runx2, an inducer of osteoblast and chondrocyte differentiation. Histochem Cell Biol. 2018;149:313-23
39. Schroeder TM, Kahler RA, Li X, Westendorf JJ. Histone deacetylase 3 interacts with runx2 to repress the osteocalcin promoter and regulate osteoblast differentiation. J Biol Chem. 2004;279:41998-2007
40. Boumah CE, Lee M, Selvamurugan N, Shimizu E, Partridge NC. Runx2 recruits p300 to mediate parathyroid hormone's effects on histone acetylation and transcriptional activation of the matrix metalloproteinase-13 gene. Mol Endocrinol. 2009;23:1255-63
41. Chen H, Ji X, She F, Gao Y, Tang P. miR-628-3p regulates osteoblast differentiation by targeting RUNX2: Possible role in atrophic non-union. Int J Mol Med. 2017;39:279-86
42. Gartland A, Rumney RM, Dillon JP, Gallagher JA. Isolation and culture of human osteoblasts. Methods Mol Biol. 2012;806:337-55
43. Chen Z, Zhang W, Jiang K, Chen B, Wang K, Lao L. et al. MicroRNA-300 Regulates the Ubiquitination of PTEN through the CRL4B(DCAF13) E3 Ligase in Osteosarcoma Cells. Mol Ther Nucleic Acids. 2018;10:254-68
44. Jiang K, Zhang C, Yu B, Chen B, Liu Z, Hou C. et al. Autophagic degradation of FOXO3a represses the expression of PUMA to block cell apoptosis in cisplatin-resistant osteosarcoma cells. Am J Cancer Res. 2017;7:1407-22
45. Carey MF, Peterson CL, Smale ST. Chromatin immunoprecipitation (ChIP). Cold Spring Harb Protoc. 2009;2009:pdb prot5279
46. Hsin JP, Manley JL. The RNA polymerase II CTD coordinates transcription and RNA processing. Genes Dev. 2012;26:2119-37
47. Venters BJ, Pugh BF. How eukaryotic genes are transcribed. Crit Rev Biochem Mol Biol. 2009;44:117-41
48. Elguindy MM, Nakamaru-Ogiso E. Apoptosis-inducing Factor (AIF) and Its Family Member Protein, AMID, Are Rotenone-sensitive NADH:Ubiquinone Oxidoreductases (NDH-2). J Biol Chem. 2015;290:20815-26
49. Mogi T, Matsushita K, Murase Y, Kawahara K, Miyoshi H, Ui H. et al. Identification of new inhibitors for alternative NADH dehydrogenase (NDH-II). FEMS Microbiol Lett. 2009;291:157-61
Author contact
![]() Corresponding authors: chenxun2008com and kunzhengwangcom
Corresponding authors: chenxun2008com and kunzhengwangcom

 Global reach, higher impact