Impact Factor ISSN: 1449-2288
- Issue 12; 2026
- Issue 11; 2026
- Issue 10; 2026
- Issue 9; 2026
- Issue 8; 2026
- Volume 22; 2026
- Past Issues
- Advance Articles
- Editorial Board
- Cover Images
- Index & Coverage
- Cover Suggestion
- Special Issues
Introduction
Materials and Methods
Results
Discussion
Limitations and future studies
Conclusions
Supplementary Material
Acknowledgements
References

 Global reach, higher impact
Int J Biol Sci 2019; 15(1):81-92. doi:10.7150/ijbs.28304 This issue Cite
Research Paper
G Protein-Coupled Estrogen Receptor 1 Inhibits Angiotensin II-Induced Cardiomyocyte Hypertrophy via the Regulation of PI3K-Akt-mTOR Signalling and Autophagy
Hui Pei1,4*, Wei Wang2*, Di Zhao3, Hongyan Su2, Guohai Su1, Zhuo Zhao1 ![]()
1. Department of Cardiology, Jinan Central Hospital Affiliated with Shandong University, Shandong, China
2. Department of Cardiology, Shandong Provincial Chest Hospital, Shandong, China
3. Department of Cardiology, Affiliated Hospital of Shandong Academy of Medical Sciences, Shandong, China
4. Taian Central Hospital, Taian City, Shandong, China
* H.P. and W.W. contributed equally to this work.
Received 2018-7-4; Accepted 2018-9-14; Published 2019-1-6
Abstract

Estrogen has been demonstrated to protect the heart against cardiac remodelling and heart failure in women. G protein-coupled estrogen receptor 1 (GPER1) is a recently discovered estrogen receptor (ER) that is expressed in various tissues. However, the mechanisms by which estrogen protects the heart, especially the roles played by ERs, are not clear. In this study, we explored the effect of GPER1 activation on angiotensin II (Ang II)-induced cardiomyocyte hypertrophy and the involved signalling pathways and mechanisms. Our data demonstrated that GPER1 is expressed in cardiomyocytes, a GPER1 agonist, G1, attenuated Ang II-induced cardiomyocyte hypertrophy and downregulated the mRNA expression levels of atrial natriuretic factor (ANF) and brain natriuretic peptide (BNP). Bioinformatics analysis revealed that five proteins, including RAP1gap, might be the key proteins involved in the attenuation of Ang II-induced cardiomyocyte hypertrophy by GPER1. G1 increased the protein level of p-Akt, p-70S6K1 and p-mTOR but decreased p-4EBP1 expression. All these effects were inhibited by either G15 (a GPER1 antagonist) or MK2206 (an inhibitor of Akt). Autophagy analysis showed that the LC3II/LC3I ratio was increased in Ang II-treated cells, and the increase was inhibited by G1 treatment. The effect of G1 on autophagy was blocked by treatment with G15, rapamycin, and MK2206. These results suggest that GPER1 activation attenuates Ang II-induced cardiomyocyte hypertrophy by upregulating the PI3K-Akt-mTOR signalling pathway and inhibiting autophagy.
Keywords: Angiotensin II (Ang II), cardiac hypertrophy, G protein-coupled estrogen receptor 1 (GPER1), Akt, autophagy
Introduction
The incidence of cardiac hypertrophy and heart failure is significantly increased in postmenopausal women compared with age-matched men and premenopausal women. A number of clinical and preclinical studies have shown that estrogen, as a sex hormone, might protect the heart against cardiac remodelling and heart failure in premenopausal women [1, 2]. The loss of endogenous estrogen has been believed to be a key factor that induces cardiovascular diseases in postmenopausal women. However, the cardioprotective effects of estrogen therapy in clinical trials are controversial [3, 4]. It is critical in this field to further determine the mechanisms by which estrogen protects the heart in premenopausal women, especially the roles of individual estrogen receptors (ERs), including ERα, ERβ, and G protein-coupled estrogen receptor 1 (GPER1) in the heart, in order to generate more specific and effective hormone therapies for future clinical treatment.
GPER1, also known as G protein-coupled receptor 30 (GPR30), is a recently discovered estrogen receptor that is expressed in various tissues, including the cardiac tissue of humans and rodents. The activation of GPER1 by its specific agonist, G1, protects the heart from all types of stress, such as myocardial infarction and pressure overload, while GPER1 knockout impairs the structure and function of the heart in animal models [5]. Compared with the classical estrogen receptors ERα and ERβ, which relatively slowly regulate gene transcription [6], GPER1 mainly acts through fast transduction mechanisms involving non-genomic estrogen signalling, such as cellular calcium mobilization, kinase activation and nitric oxide production [7]. In this study, we found that the PI3K-Akt-mTOR signalling pathway and autophagy in cardiomyocytes are regulated by GPER1 in an angiotensin II (Ang II)- induced cardiomyocyte hypertrophy model. The results from tandem mass tag (TMT) protein mass spectrometry and bioinformatics analysis show that RAP1 protein might be one of the key proteins involved in the protective effects of GPER1.
Materials and Methods
Ethics statement
The animal experimental protocol complied with the Animal Management Rules of the Chinese Ministry of Health (Document No. 55, 2001) and was approved by the Animal Care and Use Committee of Shandong University. Wistar rats were purchased from the Animal Experimental Center of Shandong University. All animals were maintained at the Laboratory of Shandong University.
Reagents
Vehicle, Ang II, G1, G15 (a GPR30 antagonist), MK2206 [a protein kinase B (Akt) inhibitor], and rapamycin (an autophagy inducer) were purchased from Sigma-Aldrich (St. Louis, MO, USA). Antibodies against total and phosphorylated Akt (Akt and p-Akt, Ser473), total and phosphorylated mTOR (mTOR and p-mTOR, Ser2448), total and phosphorylated P70s6k1 (S6K1 and p-S6K1), total and phosphorylated 4EBP1 (4EBP and p-4EBP), LC3I and LC3II, andglyceraldehyde-3-phosphate dehydrogenase (GAPDH) were purchased from Cell Signalling Technology, Inc. (Danvers, MA, USA).
Neonatal cardiomyocyte isolation and culture
Neonatal cardiomyocytes were isolated from the hearts of 2- to 4-day-old Wistar rats. Briefly, the hearts of neonatal rats were cut into 2-3 mm3 pieces and digested with type 2 collagenase and trypsin (Gibco-BRL Life Technologies, Rockville, MD) at 37℃ for 10 min. The cell suspension was centrifuged and filtered to remove fibroblasts, and cardiomyocytes were counted and seeded at 5×10⁴ cells/cm2 in 6-well culture plates. Cells were then grown in complete Dulbecco's modified Eagle's medium (DMEM, Invitrogen) supplemented with 10% foetal calf serum, 1% penicillin and streptomycin and maintained in 95% air and 5% CO2 at 37℃. For each experiment, cells were starved for 12 h in DMEM without serum and washed once with phosphate-buffered saline (PBS) before they were used for experiments.
TMT labelling and bioinformatics analysis
Following digestion with 0.1% trypsin, the SDS-PAGE electrophoresis method was used to verify the quality of the samples to meet the requirements of subsequent tests. Protein samples were further enzymatically digested into peptides by FASP (Filter-aided sample preparation) method and peptides were quantified using Nano Drop 2000, and labelled according to the instructions of the Thermo Fisher Scientific TMT labelling kit. Samples were chromatographed and subjected to TMT quantitative proteomic analysis using a Q Exactive Plus (Thermo Fisher Scientific) high-resolution mass spectrometer. Liquid chromatography-mass spectrometry (LC/MS) data were identified and quantified using the Proteome Discoverer (version 2.1) software Suite and MASCOT 2.5 after selecting the key molecules and genes participating in the GPER1-mediated regulation of cardiac hypertrophy with a difference ratio (DR) >1.2 and P<0.05.
Database for annotation, visualization and integrated discovery (DAVID) provides analytic tools for gene ontology (GO) and pathway analyses. Bioinformatics analysis was based on the GO database (www.geneontology.org) and the Kyoto Encyclopedia of Genes and Genomes (KEGG) database.
Cell treatments
Ang II, G1, G15, MK2206 and rapamycin were dissolved in dimethyl sulfoxide (DMSO, Sigma-Aldrich). Five experiments were performed: (1) The cells were treated with different doses of Ang II (50, 100, and 250 nM) for 24 hours. (2) The cells were treated with 100 nM of Ang II and different doses of G1 (10, 100, and 1000 nM) for 24 hours. (3) After 12 hours of culture in serum-free medium, the cells were treated with vehicle, Ang II, Ang II + G1, and Ang II + G1 + G15. (4) The cells were treated with vehicle, Ang II, Ang II + G1, and Ang II + G1 + MK2206. (5) Cells were treated with vehicle, Ang II, Ang II + G1, Ang II + G1 + G15, Ang II + G1 + MK2206, and Ang II + G1 + rapamycin. In experiment 3-5, the following doses of reagents were used: 100 nM of Ang II, 1000 nM of G1, 100 nM of G15, 5 µM of MK2206, and 100 nM of rapamycin. After 24 hours of treatment, the cells were harvested for further analysis including real-time PCR, Western blot and immunofluorescence analysis.
Immunofluorescence analysis and cell surface area measurements
Following treatment, the cells cultured on chamber slides were fixed with ice-cold 100% methanol for 10 min and incubated with a primary antibody against GPER1 (1:1000, Bioss Antibodies, Woburn, MA, USA) overnight at 4℃. The cells were washed with PBS and then incubated with secondary IgG antibodies conjugated to Alexa 488 (1:500, Invitrogen, Carlsbad, CA, USA) for 45 min at room temperature. The nuclei were counterstained with 4',6-diamidino-2-phenylindole (DAPI). Excess antibody was removed by three washes with PBS, and cells were imaged with an Olympus BX51 microscope (Olympus, Tokyo, Japan). The cell surface area was determined using NIH ImageJ software (http://rsbweb.nih.gov/ij/).
Western blot analysis
The cells were harvested and washed with PBS, and protein was extracted using cell lysis buffer (Beyotime Institute of Biotechnology, China). Equal amounts of protein (50 µg) from each group were separated via 12% sodium dodecyl sulphate-polyacrylamide gel electrophoresis and transferred electrophoretically to polyvinylidene difluoride membranes (Millipore, Billerica, MA) using a wet transfer system (Bio-Rad, Hercules, CA). After being blocked with 5% non-fat milk for 2 h, the membranes were incubated overnight at 4°C with primary antibodies against GAPDH, Akt and p-Akt, mTOR and p-mTOR, S6K1 and p-S6K1, 4EBP and p-4EBP, LC3I and LC3II (1:1000 dilution), followed by three washes with TBST. The membranes were subsequently incubated with secondary antibodies labelled with horseradish peroxidase [8] and visualized via enhanced chemiluminescence (Millipore). Protein levels were detected using an ImageQuant LAS 4000 chemiluminescence reader (GE) and analysed with MCID software (Imaging Research, Inc., Ontario, Canada).
Real-time quantitative PCR (RT-qPCR)
RT-qPCR was used to measure the mRNA levels of atrial natriuretic factor (ANF) and brain natriuretic peptide (BNP), which are biomarkers of cardiac hypertrophy, as well as GPER1 in the cells using a SYBR Green PCR kit (Qiagen, Inc., Valencia, California, USA), according to the manufacturer's protocol. The following primers were used for real-time PCR: 5'-CGT ATA CAG TGC GGT GTC CA-3' and 5'-GGT TGA CTT CCC CAG TCC AG-3' for ANF; 5'-AGC TGC TGG AGC TGA TAA GAG-3' and 5'-CTG CCC AAA GCA GCT TGA AC-3' for BNP; 5'-CCA TCA TCG GCC TGT GCT AT-3', and 5'-GAA GAC AAG GAC CAC TGC GA-3' for GPER1; and 5'-AAG AAG GTG GTG AAG CAG GC-3' and 5'-TCC ACC ACC CTG TTG CTG TA-3' for GAPDH. Amplification and detection were performed with the ABI7500 Sequence Detection System (Applied Biosystems, Foster City, CA). The final real-time PCR analysis results are presented as the ratio of the mRNA of interest to that of GAPDH, which was used as an internal control. The relative mRNA levels were calculated using the 2-△△Ct method.
Statistical analysis
The statistical analysis was performed using SPSS version 16.0 (SPSS, Inc., Chicago, IL, USA). The results are expressed as the mean ± SEM. Statistical significance was determined by one-way ANOVA, followed by Tukey post hoc tests. A value of P<0.05 was considered statistically significant.
Results
Ang II-induced cardiomyocyte hypertrophy
Cardiomyocyte hypertrophy was determined by both the cell surface area and the mRNA expression levels of ANF and BNP, biomarkers for cardiomyocyte hypertrophy. As shown in Figure S1, the average cell surface area with the vehicle treatment was 1344±203 μm2, while Ang II treatment at a dose of 50 nmol/L, 100 nmol/L, and 250 nmol/L increased the cell surface area to 1657±169 μm2, 2603±382 μm2, and 3350±413 μm2, respectively, (P<0.05 vs vehicle). The real-time PCR results demonstrated that Ang II treatment significantly increased the mRNA expression of ANF and BNP in a concentration-dependent manner (Figure S1). An Ang II dose of 100 nmol/L was selected for the treatment condition in subsequent experiments.
GPER1 expression in cardiomyocytes
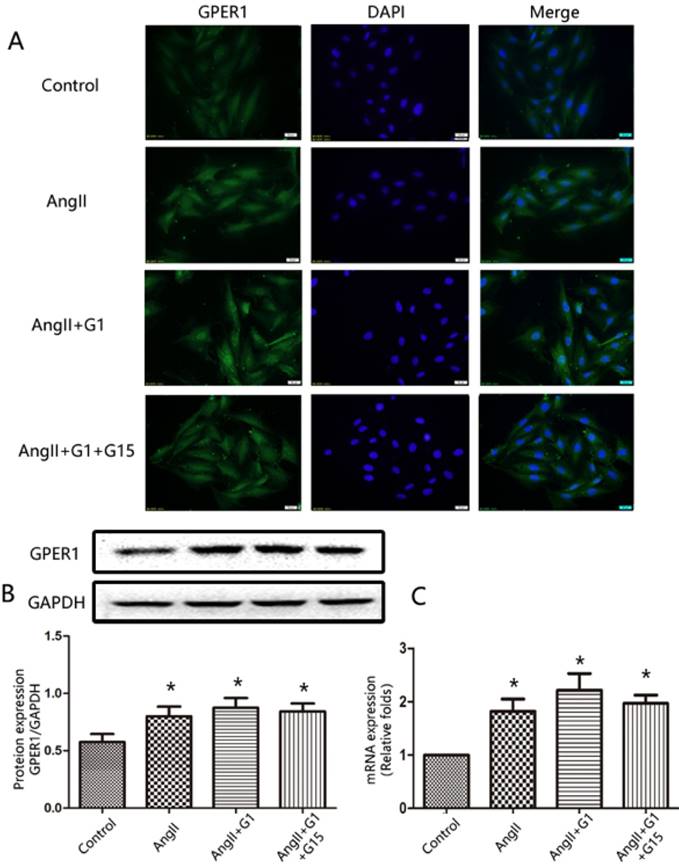
The expression of GPER1 in cardiomyocytes was detected by immunofluorescence staining, Western blot, and RT-qPCR. As shown in Figure 1, the immunofluorescence, Western blot and PCR analyses revealed that GPER1 was expressed in neonatal rat cardiomyocytes. Moreover, Ang II treatment increased the expression of GPER1, while treatment with G1 or G15 had no effect on the expression of GPER1 (Figure 1).
GPER1 expression in cardiomyocytes. (A) Immunofluorescence staining for GPER1, green (magnification×400). Scale bar 20 um. (B) Western blot and quantitative analysis of GPER1 expression. (C) GPER1 mRNA expression levels. Data are expressed as the mean±SEM (n=3). *P<0.05 versus control. G1: a GPER1 agonist, G15: GPR30 antagonist, Ang II: angiotensin II.
GPER1 activation attenuates Ang II-induced cardiomyocyte hypertrophy
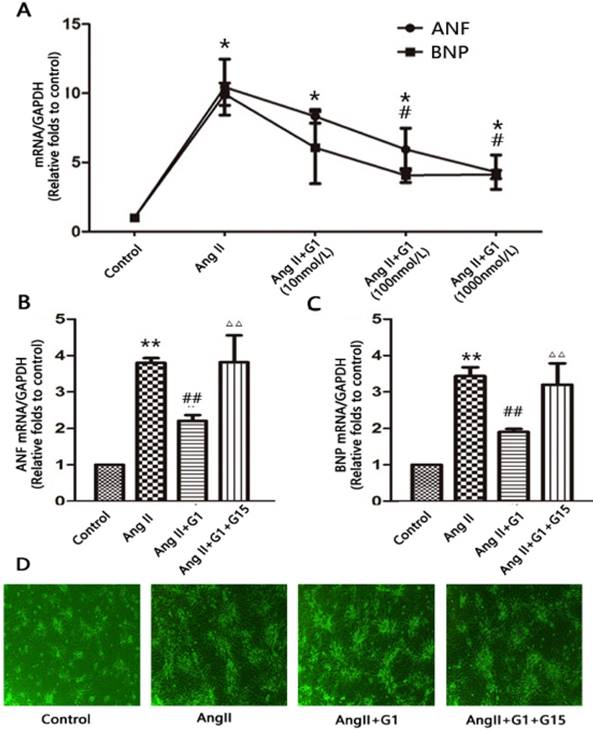
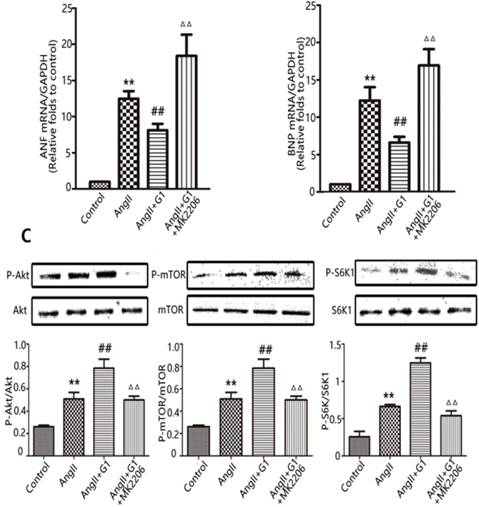
To determine whether GPER1 activation has an effect on Ang II-induced hypertrophy in neonatal cardiomyocytes, we treated cells with different concentrations of G1 (10 nmol/L, 100 nmol/L, and 1000 nmol/L). Compared with the vehicle, Ang II significantly increased the mRNA expression of ANF and BNP by more than three times (P<0.05), while G1 treatment attenuated these increases in a dose-dependent manner (Figure 2A). A total of 1000 nmol/L of G1 was used in the following experiments. The effects of G1 on the Ang II-induced increases in ANF and BNP were blocked by co-treatment with G15, a GPER1 antagonist (Figure 2B-C).
GPER1 activation attenuates Ang II-induced cardiomyocyte hypertrophy. (A) ANF and BNP mRNA expression levels in different concentrations of G1. (B-C) ANF and BNP mRNA expression levels in four groups. (D) Microscope picture of myocardial cells. Data are expressed as the mean±SEM (n=3). *P<0.05 versus control, **P<0.01 versus control, #P<0.05 versus Ang II, ##P<0.01 versus Ang II, △△P<0.01 versus Ang II+G1. ANF: atrial natriuretic factor, BNP: brain natriuretic peptide, G1: a GPER1 agonist, G15: GPR30 antagonist, Ang II: angiotensin II.
Protein mass spectrometry results from cardiomyocytes
In this study, 7330 proteins and 62155 peptides were detected in cardiomyocytes treated with vehicle, Ang II alone, and Ang II + G1. Compared to the vehicle, Ang II significantly increased the expression of 52 proteins and decreased the expression of 1 protein (Table 1). Compared with the Ang II group, there were 24 upregulated proteins and 12 downregulated proteins in the Ang II + G1 group (Table 2, Figure 3A-B). By analysing the annotation of protein function, we found that there were five key proteins that were regulated by Ang II and inhibited by G1. These five proteins were Fam120b, RGD1562310, Ctrb1, RAP1gap and Pag1 (Figure 3C and Figure S2).
Summary of Ang II vs. control differences analysis data
| Accession | Gene Name | Description | Ratio | P value |
|---|---|---|---|---|
| Q5RJS3 | Fam96a | Family with sequence similarity 96, member A OS=Rattus norvegicus GN=Fam96a PE=1 SV=1 | 2.043 | 0.043 |
| F1M6B3 | RGD1563365 | Protein RGD1563365 OS=Rattus norvegicus GN=RGD1563365 PE=4 SV=3 | 1.820 | 0.021 |
| Q6P6S5 | Wrb | Tail-anchored protein insertion receptor WRB OS=Rattus norvegicus GN=Wrb PE=2 SV=1 | 1.696 | 0.039 |
| F1M298 | Fbxo18 | F-box only protein 18 (Predicted) OS=Rattus norvegicus GN=Fbxo18 PE=4 SV=2 | 1.640 | 0.018 |
| D4AE88 | Fam120b | Protein Fam120b OS=Rattus norvegicus GN=Fam120b PE=1 SV=1 | 1.450 | 0.029 |
| D3ZTN6 | RGD1562310 | Protein RGD1562310 OS=Rattus norvegicus GN=RGD1562310 PE=4 SV=1 | 1.429 | 0.010 |
| Q6AYG7 | Nfatc2ip | NFATC2-interacting protein OS=Rattus norvegicus GN=Nfatc2ip PE=1 SV=1 | 1.399 | 0.017 |
| Q66H19 | Srfbp1 | Serum response factor-binding protein 1 OS=Rattus norvegicus GN=Srfbp1 PE=1 SV=1 | 1.390 | 0.018 |
| F1MA56 | Ctrb1 | Chymotrypsinogen B OS=Rattus norvegicus GN=Ctrb1 PE=1 SV=1 | 1.361 | 0.007 |
| A0A0G2K1E3 | Kmt2b | Protein Kmt2b OS=Rattus norvegicus GN=Kmt2b PE=1 SV=1 | 1.358 | 0.029 |
| Q5U2X1 | Fbxo9 | F-box only protein 9 OS=Rattus norvegicus GN=Fbxo9 PE=1 SV=1 | 1.354 | 0.034 |
| F1LV89 | Rap1gap | Protein Rap1gap OS=Rattus norvegicus GN=Rap1gap PE=1 SV=3 | 1.349 | 0.034 |
| A0A0G2JWM4 | Foxj3 | Protein Foxj3 OS=Rattus norvegicus GN=Foxj3 PE=1 SV=1 | 1.345 | 0.036 |
| B0BN78 | Taf7 | Protein Taf7 OS=Rattus norvegicus GN=Taf7 PE=1 SV=1 | 1.335 | 0.036 |
| D3Z8B0 | Cox16 | Protein Cox16 OS=Rattus norvegicus GN=Cox16 PE=1 SV=1 | 1.327 | 0.040 |
| Q06QA3 | ND4L | NADH-ubiquinone oxidoreductase chain 4L OS=Rattus norvegicus GN=ND4L PE=3 SV=1 | 1.321 | 0.020 |
| A0A096MJM7 | Neurl1 | Neuralized-like (Drosophila) (Predicted), isoform CRA_b OS=Rattus norvegicus GN=Neurl1 PE=4 SV=1 | 1.321 | 0.027 |
| D3ZLC6 | Mybl2 | Myeloblastosis oncogene-like 2 (Predicted) OS=Rattus norvegicus GN=Mybl2 PE=4 SV=2 | 1.308 | 0.041 |
| B5DEP4 | Mrpl42 | 28S ribosomal protein L42, mitochondrial OS=Rattus norvegicus GN=Mrpl42 PE=1 SV=1 | 1.308 | 0.007 |
| F1LWN1 | Ncoa7 | Protein Ncoa7 OS=Rattus norvegicus GN=Ncoa7 PE=1 SV=3 | 1.297 | 0.045 |
| D3ZH92 | Klhl26 | Kelch-like 26 (Drosophila) (Predicted), isoform CRA_d OS=Rattus norvegicus GN=Klhl26 PE=4 SV=1 | 1.293 | 0.027 |
| Q8CJ11 | Adgrg2 | Adhesion G-protein coupled receptor G2 OS=Rattus norvegicus GN=Adgrg2 PE=1 SV=1 | 1.288 | 0.001 |
| Q5U2T7 | Tfb2m | Dimethyladenosine transferase 2, mitochondrial OS=Rattus norvegicus GN=Tfb2m PE=2 SV=1 | 1.284 | 0.048 |
| Q498U1 | Abcg3l4 | Similar to ATP-binding cassette, sub-family G (WHITE), member 3 OS=Rattus norvegicus GN=Abcg3l4 PE=2 SV=1 | 1.282 | 0.045 |
| Q5XHX2 | Tprn | Taperin OS=Rattus norvegicus GN=Tprn PE=1 SV=2 | 1.279 | 0.031 |
| A0A0G2K6T4 | Inpp5e | 72 kDa inositol polyphosphate 5-phosphatase OS=Rattus norvegicus GN=Inpp5e PE=1 SV=1 | 1.273 | 0.038 |
| O88422 | Galnt5 | Polypeptide N-acetylgalactosaminyltransferase 5 OS=Rattus norvegicus GN=Galnt5 PE=2 SV=1 | 1.271 | 0.004 |
| Q63312 | Phldb1 | Pleckstrin homology-like domain family B member 1 (Fragment) OS=Rattus norvegicus GN=Phldb1 PE=1 SV=2 | 1.267 | 0.030 |
| A0A0G2K1R2 | Bcl7a | Protein Bcl7a OS=Rattus norvegicus GN=Bcl7a PE=1 SV=1 | 1.264 | 0.043 |
| F6Q5K7 | Mrps18b | Mitochondrial ribosomal protein S18B, isoform CRA_a OS=Rattus norvegicus GN=Mrps18b PE=1 SV=1 | 1.260 | 0.039 |
| F1LNC3 | Phlpp1 | PH domain leucine-rich repeat protein phosphatase 1 OS=Rattus norvegicus GN=Phlpp1 PE=1 SV=2 | 1.260 | 0.030 |
| D3ZA66 | Pstpip2 | Protein Pstpip2 OS=Rattus norvegicus GN=Pstpip2 PE=1 SV=3 | 1.260 | 0.011 |
| Q45QM2 | Gna12 | Guanine nucleotide binding protein alpha 12 OS=Rattus norvegicus GN=Gna12 PE=2 SV=1 | 1.260 | 0.049 |
| Q9R012 | Plk2 | Serine/threonine-protein kinase PLK2 OS=Rattus norvegicus GN=Plk2 PE=1 SV=1 | 1.260 | 0.003 |
| Q4KLM4 | Klhl25 | Kelch-like protein 25 OS=Rattus norvegicus GN=Klhl25 PE=2 SV=1 | 1.252 | 0.050 |
| M0R5B1 | Shisa8 | Protein Shisa8 OS=Rattus norvegicus GN=Shisa8 PE=4 SV=1 | 1.251 | 0.014 |
| A9UK92 | Siah1 | E3 ubiquitin-protein ligase OS=Rattus norvegicus GN=Siah1 PE=2 SV=1 | 1.246 | 0.020 |
| Q5PPG2 | Lgmn | Legumain OS=Rattus norvegicus GN=Lgmn PE=1 SV=1 | 1.235 | 0.049 |
| Q5U2W6 | Ptov1 | Prostate tumor-overexpressed gene 1 protein homolog OS=Rattus norvegicus GN=Ptov1 PE=2 SV=1 | 1.232 | 0.025 |
| G3V9M6 | Fbn1 | Fibrillin 1, isoform CRA_a OS=Rattus norvegicus GN=Fbn1 PE=1 SV=1 | 1.230 | 0.011 |
| Q5RJT0 | Ashwin OS=Rattus norvegicus PE=1 SV=1 | 1.226 | 0.027 | |
| F1M495 | Pla2r1 | Mannose receptor, C type 2 (Predicted) OS=Rattus norvegicus GN=Pla2r1 PE=4 SV=2 | 1.225 | 0.015 |
| B1H275 | Wbscr22 | Protein Wbscr22 OS=Rattus norvegicus GN=Wbscr22 PE=1 SV=1 | 1.223 | 0.030 |
| Q9JM80 | Pag1 | Phosphoprotein associated with glycosphingolipid-enriched microdomains 1 OS=Rattus norvegicus GN=Pag1 PE=1 SV=1 | 1.220 | 0.003 |
| F1LQ66 | Prdm2 | PR domain zinc finger protein 2 OS=Rattus norvegicus GN=Prdm2 PE=1 SV=1 | 1.220 | 0.032 |
| M0RDI3 | LOC100361475 | Protein LOC100361475 OS=Rattus norvegicus GN=LOC100361475 PE=4 SV=2 | 1.218 | 0.047 |
| Q5PQN5 | Trim55 | Tripartite motif-containing protein 55 OS=Rattus norvegicus GN=Trim55 PE=1 SV=1 | 1.217 | 0.037 |
| F1LZV1 | Kalrn | Kalirin OS=Rattus norvegicus GN=Kalrn PE=1 SV=3 | 1.215 | 0.001 |
| Q6S396 | Plec | Plectin OS=Rattus norvegicus GN=Plec PE=1 SV=1 | 1.213 | 0.010 |
| D3ZVF2 | Zfp295 | Protein Zfp295 OS=Rattus norvegicus GN=Zfp295 PE=1 SV=3 | 1.212 | 0.008 |
| G3V667 | Itga6 | Integrin, alpha 6, isoform CRA_a OS=Rattus norvegicus GN=Itga6 PE=1 SV=1 | 1.203 | 0.029 |
| A0A096P6M7 | LOC102554637 | Protein LOC102554637 OS=Rattus norvegicus GN=LOC102554637 PE=3 SV=1 | 0.803 | 0.008 |
Accession: Protein number in the protein sequence database (FASTA database); Description: Protein function described Uni Prot KB database; OS: Organism Name [GN=Gene Name]; PE: Protein Existence; SV: Sequence Version; Ratio: The ratio of the mean value of the relative expression of the protein in Ang II group and Control.
Summary of AngII+G1 vs. Ang II group differences analysis data
| Accession | Gene Name | Description | Ratio | P value |
|---|---|---|---|---|
| Q9WTM9 | Cyr61 | CYR61 OS=Rattus norvegicus GN=Cyr61 PE=2 SV=1 | 1.590 | 0.001 |
| Q8K3R4 | Adipoq | 30 kDa adipocyte complement-related protein OS=Rattus norvegicus GN=Adipoq PE=1 SV=1 | 1.420 | 0.001 |
| A0A096MJ68 | Slpi | Protein RGD1563818 OS=Rattus norvegicus GN=Slpi PE=4 SV=1 | 1.414 | 0.047 |
| M0RBS0 | Prelid3b | PRELI domain-containing protein 3B OS=Rattus norvegicus GN=Prelid3b PE=1 SV=2 | 1.394 | 0.003 |
| P08721 | Spp1 | Osteopontin OS=Rattus norvegicus GN=Spp1 PE=1 SV=2 | 1.364 | 0.001 |
| A0A0G2K1V7 | Sgcb | Protein Sgcb OS=Rattus norvegicus GN=Sgcb PE=4 SV=1 | 1.354 | 0.009 |
| Q66HT5 | Cyr61 | Cysteine rich protein 61 OS=Rattus norvegicus GN=Cyr61 PE=2 SV=1 | 1.337 | 0.001 |
| Q9QZK5 | Htra1 | Serine protease HTRA1 OS=Rattus norvegicus GN=Htra1 PE=2 SV=1 | 1.335 | 0.001 |
| P80431 | Cox7b | Cytochrome c oxidase subunit 7B, mitochondrial OS=Rattus norvegicus GN=Cox7b PE=1 SV=3 | 1.330 | 0.013 |
| P35572 | Igfbp6 | Insulin-like growth factor-binding protein 6 OS=Rattus norvegicus GN=Igfbp6 PE=1 SV=1 | 1.321 | 0.001 |
| Q9ERB4 | Vcan | Versican core protein (Fragments) OS=Rattus norvegicus GN=Vcan PE=2 SV=2 | 1.319 | 0.001 |
| Q71SA3 | Thbs1 | Thrombospondin 1 OS=Rattus norvegicus GN=Thbs1 PE=2 SV=1 | 1.290 | 0.014 |
| P34901 | Sdc4 | Syndecan-4 OS=Rattus norvegicus GN=Sdc4 PE=1 SV=1 | 1.254 | 0.035 |
| D3Z8N2 | Rnf187 | E3 ubiquitin-protein ligase RNF187 OS=Rattus norvegicus GN=Rnf187 PE=1 SV=2 | 1.252 | 0.020 |
| Q9R1E9 | Ctgf | Connective tissue growth factor OS=Rattus norvegicus GN=Ctgf PE=2 SV=1 | 1.248 | 0.001 |
| A0A0G2JW94 | Clint1 | Protein Clint1 OS=Rattus norvegicus GN=Clint1 PE=1 SV=1 | 1.238 | 0.038 |
| Q8R490 | Cdh13 | Cadherin 13 OS=Rattus norvegicus GN=Cdh13 PE=2 SV=1 | 1.237 | 0.004 |
| A0A096MIT4 | Il33 | Interleukin-33 OS=Rattus norvegicus GN=Il33 PE=1 SV=2 | 1.237 | 0.014 |
| Q9JM80 | Pag1 | Phosphoprotein associated with glycosphingolipid-enriched microdomains 1 OS=Rattus norvegicus GN=Pag1 PE=1 SV=1 | 1.236 | 0.006 |
| B0BN34 | Tnfaip6 | RCG37772 OS=Rattus norvegicus GN=Tnfaip6 PE=2 SV=1 | 1.227 | 0.001 |
| Q6P7D5 | Mid1ip1 | Mid1-interacting protein 1 OS=Rattus norvegicus GN=Mid1ip1 PE=1 SV=1 | 1.217 | 0.001 |
| Q6QI73 | LRRG00135 OS=Rattus norvegicus PE=2 SV=1 | 1.214 | 0.022 | |
| Q6XFR6 | Gypc | Glycophorin-C OS=Rattus norvegicus GN=Gypc PE=1 SV=1 | 1.205 | 0.008 |
| Q7TPL3 | Kctd10 | BTB/POZ domain-containing adapter for CUL3-mediated RhoA degradation protein 3 OS=Rattus norvegicus GN=Kctd10 PE=1 SV=1 | 1.203 | 0.004 |
| D4AE88 | Fam120b | Protein Fam120b OS=Rattus norvegicus GN=Fam120b PE=1 SV=1 | 0.827 | 0.044 |
| D3ZJ08 | Hist2h3c2 | Histone H3 OS=Rattus norvegicus GN=Hist2h3c2 PE=1 SV=1 | 0.822 | 0.040 |
| B5DFJ7 | Tmem9 | Protein Tmem9 OS=Rattus norvegicus GN=Tmem9 PE=2 SV=1 | 0.817 | 0.006 |
| Q63364 | Pja2 | E3 ubiquitin-protein ligase Praja-2 OS=Rattus norvegicus GN=Pja2 PE=2 SV=1 | 0.804 | 0.013 |
| Q62879 | PPAR | PPAR delta protein OS=Rattus norvegicus GN=PPAR delta PE=2 SV=1 | 0.785 | 0.009 |
| Q5M969 | Nanp | N-acylneuraminate-9-phosphatase OS=Rattus norvegicus GN=Nanp PE=1 SV=1 | 0.780 | 0.005 |
| D3ZWM8 | Elf4 | Protein Elf4 OS=Rattus norvegicus GN=Elf4 PE=1 SV=2 | 0.769 | 0.039 |
| D3ZTN6 | RGD1562310 | Protein RGD1562310 OS=Rattus norvegicus GN=RGD1562310 PE=4 SV=1 | 0.761 | 0.045 |
| F1LV89 | Rap1gap | Protein Rap1gap OS=Rattus norvegicus GN=Rap1gap PE=1 SV=3 | 0.744 | 0.017 |
| Q0D2L7 | Cchcr1 | Hcr protein OS=Rattus norvegicus GN=Cchcr1 PE=2 SV=1 | 0.738 | 0.007 |
| D3ZME3 | Uncharacterized protein OS=Rattus norvegicus PE=1 SV=1 | 0.675 | 0.011 | |
| F1MA56 | Ctrb1 | Chymotrypsinogen B OS=Rattus norvegicus GN=Ctrb1 PE=1 SV=1 | 0.624 | 0.001 |
Accession: Protein number in the protein sequence database (FASTA database); Description: Protein function described Uni Prot KB database; OS: OrganismName [GN=Gene Name]; PE: Protein Existence; SV: Sequence Version; Ratio: The ratio of the mean value of the relative expression of the protein in Ang II+G1 group and Ang II group
Protein mass spectrometry results from cardiomyocytes. (A) Cluster analysis result of Control and Ang II groups. (B) Cluster analysis result of Ang II+G1 group and Ang II groups. (C) Wayne diagram shows the difference analysis. Data are expressed as the mean±SEM (n=3). A1, A2, A3: protein expression in three repeated control groups. B1, B2, B3: protein expression in three repeated Ang II-treated cells. C1, C2, C3: protein expression levels in three repeated Ang II+G1 treated cells. Ang II: angiotensin II. Red indicates high expression level and green indicates low expression level. The darker color means the differences are more significant.
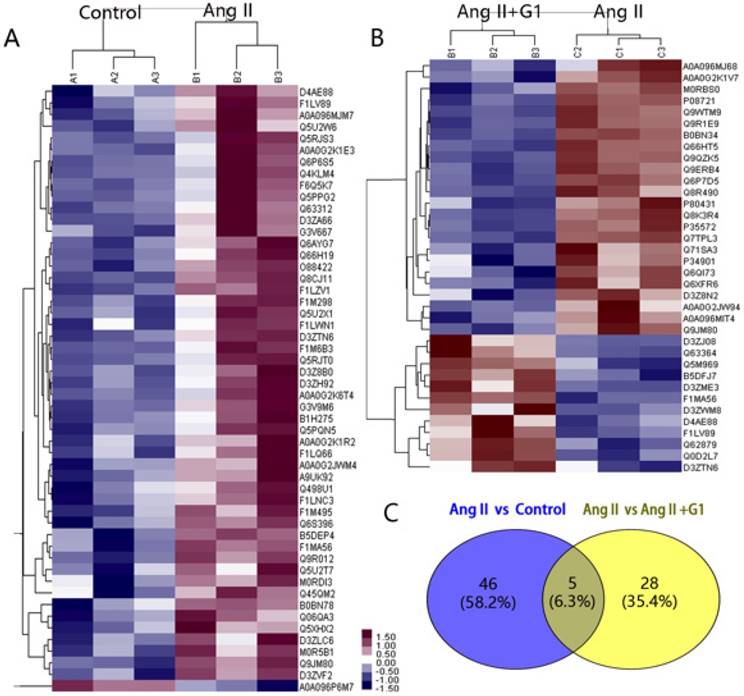
The expression of RAP1gap protein, a GTPase-activating protein (GAP) for Rap1, was more than nine times higher in the Ang II group than the control group, and this increase was inhibited by G1 treatment (P<0.05). We hypothesized that the effects of GPER1 on hypertrophic cardiomyocytes may be mediated by its downregulation of the RAP1gap gene. It has been reported that RAP1gap is involved in activation of the PI3K-Akt signalling pathway [9]. Therefore, the following experiments were performed to determine the role played by PI3K-Akt-mTOR signalling in the protective effects of GPER1 in cardiomyocytes with Ang II stimulation.
Gene ontology (GO) and Pathway analysis
GO analysis, including biology process, molecular function, and cellular component analysis, were performed in Ang II-stimulated cardiomyocytes treated with vehicle or G1. Results from Biology Process analysis showed that G1 treatment mainly affected genes related to cellular process, single-organism process, single-organism cellular process, biological regulation, and organic substance metabolic process. According to molecular function analysis, G1 mainly affected protein binding-related genes. Cellular component analysis showed that G1 decreased gene expressions that are related to intracellular part, organelle, and cytoplasm component (Table S1).
As shown in Table S2, we have also performed KEGG Pathway analysis and found that the main signal pathways that G1 affected in cardiomyocytes were the following: pathways in cancer pathogenesis, PI3K-Akt signaling pathway, Alzheimer's disease, Huntington's disease, focal adhesion, carbon metabolism, non-alcoholic fatty liver disease (NAFLD), oxidative phosphorylation, and necroptosis. All the related signal pathways were activated by G1 treatment.
G1 activates PI3K-Akt-mTOR signalling in cardiomyocytes
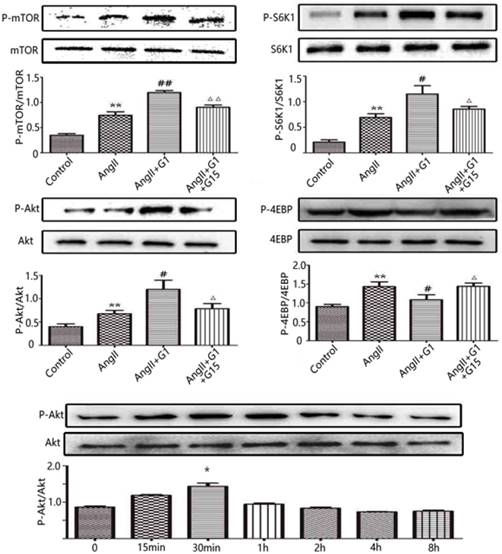
To further investigate the mechanisms by which the activation of GPER1 protects cardiomyocytes against stress caused by Ang II, Western blot was used to detect the potential signalling pathways involved. As shown in Figure 4, in cardiomyocytes, the protein expression levels of p-mTOR, p-Akt and p-S6K1 were significantly increased by Ang II, and these increases were further enhanced by G1 treatment. Ang II also increased p-4EBP, which was inhibited by G1. All of these effects of G1 were blocked by G15 treatment (Figure 4). To study the time course of Akt activation by G1, cells were treated with G1 for 0 min, 15 min, 30 min, 1 h, 2 h, 4 h, and 8 h. As shown in Figure 4E, G1 induced Akt phosphorylation at the highest level after 30 min of treatment.
G1 activates PI3K-Akt-mTOR signaling pathway in cardiomyocytes. (A-D) Western blot and quantitative analysis of cardiac mTOR, S6K1, Akt, 4EBP expression. (E) Expression of Akt protein in cardiomyocytes stimulated by G1 at different time. Data are expressed as the mean±SEM (n=3). **P<0.01 versus control, #P<0.05 versus Ang II, ##P<0.01 versus Ang II, △P<0.05 versus Ang II+G1, △△P<0.01 versus Ang II+G1. mTOR: mammalian target of rapamyein, S6K1: p-ribosomal protein S6 kinase, Akt: protein kinase B, 4EBP: p4E binding protein 1, G1: a GPER1 agonist, G15: GPR30 antagonist, Ang II: angiotensin II.
The Akt pathway is involved in GPER1-mediated anti-cardiomyocyte hypertrophy
The Akt-specific blocker MK2206 was used in this study to determine the involvement of the Akt pathway in the protective effects of GPER1 in cardiomyocytes with Ang II-induced stress. The PCR results show that MK2206 treatment inhibited the G1-induced decreases in ANF and BNP mRNA in hypertrophic cardiomyocytes stimulated by Ang II (Figure 5A-B). Moreover, Figure 5C shows that Akt inhibition by MK2206 blocked the G1-induced phosphorylation of Akt, mTOR, and S6K1 proteins.
Akt pathway is involved in GPER1-mediated anti-cardiomyocyte hypertrophy. (A-B) ANF and BNP mRNA expression levels in four groups. (C) Western blot and quantitative analysis of cardiac mTOR, p70S6K1, Akt expression. Data are expressed as the mean±SEM (n=3). **P<0.01 versus control, ##P<0.01 versus Ang II, △△P<0.01 versus Ang II+G1. mTOR: mammalian target of rapamyein, S6K1: p-ribosomal protein S6 kinase, Akt: protein kinase B, 4EBP: p4E binding protein 1, G1: a GPER1 agonist, MK2206: protein kinase B inhibitor, Ang II: angiotensin II.
Involvement of cell autophagy in GPER1-mediated anti-cardiomyocyte hypertrophy
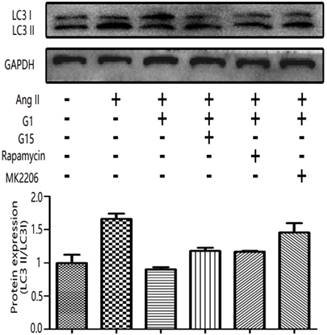
The LC3II/LC3I ratio was measured by Western blot to examine the autophagy activity in cardiomyocytes [10, 11]. As shown in Figure 6, LC3II/LC3I increased with Ang II stimulation, and this increase was inhibited by G1 treatment. However, the effect of G1 on LC3II/LC3I was attenuated by G15, MK2206, and an autophagy inducer, rapamycin (Figure 6).
GPER1-mediated anti-cardiomyocyte hypertrophy triggers autophagy. Western blot and quantitative analysis of cardiac LC3I and LC3II expression. Data are expressed as the mean±SEM (n=3). **P<0.01 versus control, ##P<0.01 versus Ang II, △△P<0.01 versus Ang II+G1. G1: a GPER1 agonist, G15: GPR30 antagonist, MK2206: protein kinase B inhibitor, Ang II: angiotensin II, microtubule-associated protein 1 light chain 3-II (LC3II), microtubule-associated protein 1 light chain 3-I (LC3I).
Discussion
Endogenous estrogen plays an important role in the regulation of cardiovascular homeostasis in premenopausal women [12, 13], delaying the development of hypertension, coronary artery disease, cardiac hypertrophy, and heart failure compared to age-matched men. However, large randomized controlled clinical trials (WHI and HERS estrogen replacement trials) have not shown clear evidence of the cardioprotection of estrogen replacement therapy in postmenopausal women [14-16]. Moreover, chronic estrogen therapy increases the risk of cancer in the female reproductive system [12]. Therefore, it is critical to further investigate the mechanism of action of estrogen in the heart, especially the roles played by estrogen receptors, to generate more specific therapies with fewer side effects. The discovery of GPER1, which is expressed in various tissues, including the cardiac tissue, has opened a new door in this field of research. Previous studies have shown that the activation of GPER1 by its specific agonist, G1, protects the heart in both rat and mouse models with different stressors [17]. G1 was developed as a selective agonist of GPER to distinguish the estrogen effects mediated by GPER from those mediated by classic nuclear estrogen receptors (ERα and ERβ). The original report showed that G1 was able to bind to GPER with high-affinity and did not bind to classic nuclear ERs and other 25 examined G-protein coupled receptors [18]. Since its first report in 2006, G1 has been wildly used to investigate the functions of GPER in various tissues and organs [19]. In the present study, we demonstrated that GPER1 activation by G1 protects cardiomyocytes against Ang II stimulation by regulating the Akt-mediated pathway and subsequently inhibiting autophagy.
By immunofluorescence staining, Western blot, and PCR, we demonstrated that GPER1 is expressed in neonatal rat cardiomyocytes. Moreover, Ang II increased GPER1 expression. While the mechanisms of increased GPER1 expression by Ang II are not clear, this result is consistent with the findings of De Francesco and colleagues showing that GPER1 expression is higher in the heart of spontaneously hypertensive rats (SHRs) versus control Wistar Kyoto (WKY) rats [20]. It has been demonstrated that GPER1 is located in the cell membrane and functions as an estrogen receptor [21, 22]. However, its subcellular locations, including the plasma membrane [23, 24], endoplasmic reticulum [25-27], and nuclei, remain controversial. Revankar's study showed that GPER1 on the endoplasmic reticulum may be involved in rapid intracellular non-genomic calcium mobilization by estrogen [25].
In vivo studies have demonstrated that the activation of GPER1 protects the heart from remodelling and heart failure against various stressors, such as Ang II stimulation, myocardial I/R injury, pressure overload, estrogen loss, and ageing [28]. However, the direct effects of GPER1 and the mechanisms of action in cardiomyocytes are still unclear. By measuring the cell surface area and biomarkers of hypertrophy, our study demonstrates that the activation of GPER1 has direct protective effects on cardiomyocytes against Ang II stimulation. In addition to cardiomyocytes, GPER1 has also been shown to have favourable effects on coronary artery smooth muscle cells (CASMCs) and endothelial cells against cardiac remodelling and heart failure [29-34]. It appears that GPER1 protects the heart against various stressors through different cell types in the heart.
To further investigate the mechanisms of the protective effect of GPER1 against Ang II-induced hypertrophy in cardiomyocytes, we performed TMT protein mass spectrometry to analyse the protein expression patterns in cells treated with the vehicle, Ang II, and Ang II + G1. Five key proteins, including RAP1gap, potentially related to GPER1's functions were found. RAP1gap is an important member of the small GTPase family in the Ras superfamily and is activated by different extracellular stimuli in various cell types. RAP1gap belongs to a family of proteins with gap function specific for RAP1/2, which also includes RAP1gap2, SPA and E6TP1 [35, 36]. GPER1 has also been reported to affect the Rap1 gene by regulating RAP1gap and subsequently activating the RhoA/Rho-kinase pathway, which is involved in protection against coronary artery disease [37]. Yu et al. [37] tested the effect of GPER activation on Rap1 activity in porcine CASMCs and observed that G1 markedly increased Rap1 activity; Rap1 siRNA transfection significantly inhibited G1-induced phosphorylation of RhoA at serine 188, further suggesting the role of Rap1 in GPER-mediated signaling. However, future studies are needed to determine the involvement of Rap1gap in the cardioprotective effects of GPER1 in animal models.
Cardiac hypertrophy is associated with activation of the Akt/mTOR signalling pathway. In our study, we found that G1 treatment activated the Akt-mediated signalling pathway, which is believed to be associated with cardiomyocyte growth, hypertrophy and survival. This finding regarding the regulation of Akt signaling pathway by GPER1 is consistent with other report in human periodontal ligament cells [38, 39]. mTOR is an important protein molecule downstream from Akt-mediated signalling. It is an atypical serine/threonine protein kinase that affects gene transcription and protein translation and participates in the regulation of cell growth, proliferation and other processes. mTOR is involved in protein synthesis, immunity, cell migration and metabolism, apoptosis and autophagy [40]. Many pathways that mediate protein turnover depend on mTOR. Specifically, Akt/mTOR signalling is essential for the regulation of autophagy [41-43]. In the cardiovascular system, mTOR is believed to be an important negative regulator of autophagy [44]. Cardiac autophagy plays an important role in maintaining cell homeostasis, which at the basal level protects cells against various stimuli. However, excessive autophagy can cause autophagic cell death and accelerate the progression of heart disease [45]. Despite controversial conclusions about the effect of autophagy on hypertrophy, autophagy serves dual functions, and whether it acts adaptively or maladaptively depends on the degree of autophagy activation and the stage and severity of different diseases [46]. As shown in Figures 4 and 5, compared to Ang II treatment, the protein expression levels of p-mTOR, p-Akt and p-S6K1 were significantly increased by Ang II + G1 treatment. However, as shown in Figure 6, a significantly higher LC3II/LC3I ratio was observed in the Ang II group, and this increase was attenuated by G1. Moreover, rapamycin, G15 and MK2206 induced autophagy in cardiomyocytes. Our findings are supported by previous studies showing that G15 down-regulated the expression of Akt, cell cycle-associated and mitogen-activated protein kinases, and increased LC3B-II and autophagosome accumulation in human oral squamous carcinoma cells [47]. In mouse osteoblasts, 17β-estradiol treatment also increases GPR30 expression and enhances mitochondrial autophagy through the GPR30 and ERK1/2 signaling pathways [48]. These findings suggest that excessive autophagy might mediate Ang II-induced cardiomyocyte hypertrophy, and G1-activated GPER1 attenuates Ang II-induced cardiomyocyte hypertrophy possibly by inhibiting autophagy via PI3K-Akt-mTOR signalling pathway up-regulation.
Limitations and future studies
Ang II-induced hypertrophy in neonatal cardiomyocyte has been commonly used as an in vitro model to study the mechanisms of cardiomyocyte hypertrophy [49-51]. However, the results from Ang II-induced hypertrophy in neonatal cardiomyocyte can be affected by the contamination of cardiac fibroblasts. Gray et al. [52] reported that Ang II stimulates myocyte hypertrophy might be due to the paracrine release of TGF-β1 and endothelin-1 from cardiac fibroblasts in a neonatal rat cell culture model. Future studies using adult cardiomyocytes are needed to confirm our findings in neonatal cardiomyocytes. We also realized another limitation of this study regarding the autophagy analysis. Cell autophagy was examined only by the method of Western blot, other methods, such as using electron microscopy, are planned in our future studies.
Conclusions
In summary, this study found that GPER1 activation attenuated Ang II-induced cardiomyocyte hypertrophy. This protective effect of GPER1 might be due to the upregulation of the PI3K-Akt-mTOR signalling pathway and the inhibition of autophagy in cardiomyocytes. Although numerous studies have demonstrated that GPER1 protects the heart from various stressors, the exact mechanism remains unclear. To our knowledge, there is no clinical study yet whether cardiac autophagy is involved in the development of postmenopausal heart diseases. The present study on the molecular mechanisms of GPER1 in cardiomyocytes improves our understanding of how estrogen protects the heart and provides potential pharmaceutical approaches targeting this new estrogen receptor-mediated pathway and cardiac autophagy.
Supplementary Material
Supplementary figures and tables.
Acknowledgements
This work was supported by grants from National Science Foundation of China (NO. 81670245).
Author contributions
H.P. and Z.Z. designed the experiments, H.P., W.W., D.Z., and H.S. performed the experiments. H.S., G.S., and Z.Z. analysed data and prepared the manuscript.
Competing Interests
The authors have declared that no competing interest exists.
References
1. Mendelsohn ME. Protective effects of estrogen on the cardiovascular system. The American journal of cardiology. 2002;89(E):12-17 discussion 7E-8E
2. Vitale C, Fini M, Speziale G, Chierchia S. Gender differences in the cardiovascular effects of sex hormones. Fundamental & clinical pharmacology. 2010;24:675-85
3. Filardo EJ, Quinn JA, Bland KI, Frackelton AR Jr. Estrogen-induced activation of Erk-1 and Erk-2 requires the G protein-coupled receptor homolog, GPR30, and occurs via trans-activation of the epidermal growth factor receptor through release of HB-EGF. Molecular endocrinology. 2000;14:1649-60
4. Knowlton AA, Lee AR. Estrogen and the cardiovascular system. Pharmacology & therapeutics. 2012;135:54-70
5. Meyer MR, Haas E, Prossnitz ER, Barton M. Non-genomic regulation of vascular cell function and growth by estrogen. Molecular and cellular endocrinology. 2009;308:9-16
6. Heldring N, Pike A, Andersson S, Matthews J, Cheng G, Hartman J. et al. Estrogen receptors: how do they signal and what are their targets. Physiological reviews. 2007;87:905-31
7. Prossnitz ER, Arterburn JB, Smith HO, Oprea TI, Sklar LA, Hathaway HJ. Estrogen signaling through the transmembrane G protein-coupled receptor GPR30. Annual review of physiology. 2008;70:165-90
8. Fang Z, Tang Y, Jiao W, Xing Z, Guo Z, Wang W. et al. Nitidine chloride induces apoptosis and inhibits tumor cell proliferation via suppressing ERK signaling pathway in renal cancer. Food and chemical toxicology: an international journal published for the British Industrial Biological Research Association. 2014;66:210-6
9. Li W, Jin B, Cornelius LA, Zhou B, Fu X, Shang D. et al. Inhibitory effects of Rap1GAP overexpression on proliferation and migration of endothelial cells via ERK and Akt pathways. Journal of Huazhong University of Science and Technology Medical sciences = Hua zhong ke ji da xue xue bao Yi xue Ying De wen ban = Huazhong keji daxue xuebao Yixue Yingdewen ban. 2011;31:721-7
10. Bjorkoy G, Lamark T, Brech A, Outzen H, Perander M, Overvatn A. et al. p62/SQSTM1 forms protein aggregates degraded by autophagy and has a protective effect on huntingtin-induced cell death. The Journal of cell biology. 2005;171:603-14
11. Su H, Li J, Menon S, Liu J, Kumarapeli AR, Wei N. et al. Perturbation of cullin deneddylation via conditional Csn8 ablation impairs the ubiquitin-proteasome system and causes cardiomyocyte necrosis and dilated cardiomyopathy in mice. Circulation research. 2011;108:40-50
12. Baber RJ, Panay N, Fenton A, Group IMSW. 2016 IMS Recommendations on women's midlife health and menopause hormone therapy. Climacteric: the journal of the International Menopause Society. 2016;19:109-50
13. Grady D, Rubin SM, Petitti DB, Fox CS, Black D, Ettinger B. et al. Hormone therapy to prevent disease and prolong life in postmenopausal women. Annals of internal medicine. 1992;117:1016-37
14. Rossouw JE, Anderson GL, Prentice RL, LaCroix AZ, Kooperberg C, Stefanick ML. et al. Risks and benefits of estrogen plus progestin in healthy postmenopausal women: principal results From the Women's Health Initiative randomized controlled trial. Jama. 2002;288:321-33
15. Padula AM, Pressman AR, Vittinghoff E, Grady D, Neuhaus J, Ackerson L. et al. Placebo adherence and mortality in the Heart and Estrogen/Progestin Replacement Study. The American journal of medicine. 2012;125:804-10
16. Pardini D. [Hormone replacement therapy in menopause]. Arquivos brasileiros de endocrinologia e metabologia. 2014;58:172-81
17. Lee TM, Lin SZ, Chang NC. Both GPER and membrane oestrogen receptor-alpha activation protect ventricular remodelling in 17beta oestradiol-treated ovariectomized infarcted rats. Journal of cellular and molecular medicine. 2014;18:2454-65
18. Bologa CG, Revankar CM, Young SM, Edwards BS, Arterburn JB, Kiselyov AS. et al. Virtual and biomolecular screening converge on a selective agonist for GPR30. Nature chemical biology. 2006;2:207-12
19. Prossnitz ER, Barton M. The G-protein-coupled estrogen receptor GPER in health and disease. Nature reviews Endocrinology. 2011;7:715-26
20. De Francesco EM, Angelone T, Pasqua T, Pupo M, Cerra MC, Maggiolini M. GPER mediates cardiotropic effects in spontaneously hypertensive rat hearts. PloS one. 2013;8:e69322
21. Filardo E, Quinn J, Pang Y, Graeber C, Shaw S, Dong J. et al. Activation of the novel estrogen receptor G protein-coupled receptor 30 (GPR30) at the plasma membrane. Endocrinology. 2007;148:3236-45
22. Funakoshi T, Yanai A, Shinoda K, Kawano MM, Mizukami Y. G protein-coupled receptor 30 is an estrogen receptor in the plasma membrane. Biochemical and biophysical research communications. 2006;346:904-10
23. Cheng SB, Graeber CT, Quinn JA, Filardo EJ. Retrograde transport of the transmembrane estrogen receptor, G-protein-coupled-receptor-30 (GPR30/GPER) from the plasma membrane towards the nucleus. Steroids. 2011;76:892-6
24. Sjostrom M, Hartman L, Grabau D, Fornander T, Malmstrom P, Nordenskjold B. et al. Lack of G protein-coupled estrogen receptor (GPER) in the plasma membrane is associated with excellent long-term prognosis in breast cancer. Breast cancer research and treatment. 2014;145:61-71
25. Revankar CM, Cimino DF, Sklar LA, Arterburn JB, Prossnitz ER. A transmembrane intracellular estrogen receptor mediates rapid cell signaling. Science. 2005;307:1625-30
26. Otto C, Rohde-Schulz B, Schwarz G, Fuchs I, Klewer M, Brittain D. et al. G protein-coupled receptor 30 localizes to the endoplasmic reticulum and is not activated by estradiol. Endocrinology. 2008;149:4846-56
27. Koganti S, Snyder R, Gumaste U, Karamyan VT, Thekkumkara T. 2-methoxyestradiol binding of GPR30 down-regulates angiotensin AT(1) receptor. European journal of pharmacology. 2014;723:131-40
28. Wang H, Jessup JA, Lin MS, Chagas C, Lindsey SH, Groban L. Activation of GPR30 attenuates diastolic dysfunction and left ventricle remodelling in oophorectomized mRen2.Lewis rats. Cardiovascular research. 2012;94:96-104
29. Han G, Li F, Yu X, White RE. GPER: a novel target for non-genomic estrogen action in the cardiovascular system. Pharmacological research. 2013;71:53-60
30. Deschamps AM, Murphy E. Activation of a novel estrogen receptor, GPER, is cardioprotective in male and female rats. American journal of physiology Heart and circulatory physiology. 2009;297:H1806-13
31. Lindsey SH, Cohen JA, Brosnihan KB, Gallagher PE, Chappell MC. Chronic treatment with the G protein-coupled receptor 30 agonist G-1 decreases blood pressure in ovariectomized mRen2.Lewis rats. Endocrinology. 2009;150:3753-8
32. Yu X, Ma H, Barman SA, Liu AT, Sellers M, Stallone JN. et al. Activation of G protein-coupled estrogen receptor induces endothelium-independent relaxation of coronary artery smooth muscle. American journal of physiology Endocrinology and metabolism. 2011;301:E882-8
33. Meyer MR, Baretella O, Prossnitz ER, Barton M. Dilation of epicardial coronary arteries by the G protein-coupled estrogen receptor agonists G-1 and ICI 182,780. Pharmacology. 2010;86:58-64
34. Han G, Ma H, Chintala R, Fulton DJ, Barman SA, White RE. Essential role of the 90-kilodalton heat shock protein in mediating nongenomic estrogen signaling in coronary artery smooth muscle. The Journal of pharmacology and experimental therapeutics. 2009;329:850-5
35. McLeod SJ, Shum AJ, Lee RL, Takei F, Gold MR. The Rap GTPases regulate integrin-mediated adhesion, cell spreading, actin polymerization, and Pyk2 tyrosine phosphorylation in B lymphocytes. The Journal of biological chemistry. 2004;279:12009-19
36. Singh L, Gao Q, Kumar A, Gotoh T, Wazer DE, Band H. et al. The high-risk human papillomavirus type 16 E6 counters the GAP function of E6TP1 toward small Rap G proteins. Journal of virology. 2003;77:1614-20
37. Yu X, Zhang Q, Zhao Y, Schwarz BJ, Stallone JN, Heaps CL. et al. Activation of G protein-coupled estrogen receptor 1 induces coronary artery relaxation via Epac/Rap1-mediated inhibition of RhoA/Rho kinase pathway in parallel with PKA. PloS one. 2017;12:e0173085
38. Fernandez-Campo L, Grande MT, Diego J, Fuentes-Calvo I, Macias-Nunez JF, Sanchez-Rodriguez A. et al. Effect of different antihypertensive treatments on Ras, MAPK and Akt activation in hypertension and diabetes. Clinical science. 2009;116:165-73
39. Han Y, Wang X, Ma D, Wu X, Yang P, Zhang J. Ipriflavone promotes proliferation and osteogenic differentiation of periodontal ligament cells by activating GPR30/PI3K/AKT signaling pathway. Drug design, development and therapy. 2018;12:137-48
40. Lee CH, Inoki K, Guan KL. mTOR pathway as a target in tissue hypertrophy. Annual review of pharmacology and toxicology. 2007;47:443-67
41. Saiki S, Sasazawa Y, Imamichi Y, Kawajiri S, Fujimaki T, Tanida I. et al. Caffeine induces apoptosis by enhancement of autophagy via PI3K/Akt/mTOR/p70S6K inhibition. Autophagy. 2011;7:176-87
42. van der Vos KE, Eliasson P, Proikas-Cezanne T, Vervoort SJ, van Boxtel R, Putker M. et al. Modulation of glutamine metabolism by the PI(3)K-PKB-FOXO network regulates autophagy. Nature cell biology. 2012;14:829-37
43. Li Y, Zhu H, Zeng X, Fan J, Qian X, Wang S. et al. Suppression of autophagy enhanced growth inhibition and apoptosis of interferon-beta in human glioma cells. Molecular neurobiology. 2013;47:1000-10
44. Nakai A, Yamaguchi O, Takeda T, Higuchi Y, Hikoso S, Taniike M. et al. The role of autophagy in cardiomyocytes in the basal state and in response to hemodynamic stress. Nature medicine. 2007;13:619-24
45. Rifki OF, Hill JA. Cardiac autophagy: good with the bad. Journal of cardiovascular pharmacology. 2012;60:248-52
46. Li J, Cai Y. The dual effects of autophagy in myocardial hypertrophy. Acta cardiologica. 2015;70:493-8
47. Bai LY, Weng JR, Hu JL, Wang D, Sargeant AM, Chiu CF. G15, a GPR30 antagonist, induces apoptosis and autophagy in human oral squamous carcinoma cells. Chemico-biological interactions. 2013;206:375-84
48. Sun X, Yang X, Zhao Y, Li Y, Guo L. Effects of 17beta-Estradiol on Mitophagy in the Murine MC3T3-E1 Osteoblast Cell Line is Mediated via G Protein-Coupled Estrogen Receptor and the ERK1/2 Signaling Pathway. Medical science monitor: international medical journal of experimental and clinical research. 2018;24:903-11
49. Miyata S, Haneda T. Hypertrophic growth of cultured neonatal rat heart cells mediated by type 1 angiotensin II receptor. The American journal of physiology. 1994;266:H2443-51
50. Watkins SJ, Borthwick GM, Oakenfull R, Robson A, Arthur HM. Angiotensin II-induced cardiomyocyte hypertrophy in vitro is TAK1-dependent and Smad2/3-independent. Hypertension research: official journal of the Japanese Society of Hypertension. 2012;35:393-8
51. Guo H, Liu B, Hou L, The E, Li G, Wang D. et al. The role of mAKAPbeta in the process of cardiomyocyte hypertrophy induced by angiotensin II. International journal of molecular medicine. 2015;35:1159-68
52. Gray MO, Long CS, Kalinyak JE, Li HT, Karliner JS. Angiotensin II stimulates cardiac myocyte hypertrophy via paracrine release of TGF-beta 1 and endothelin-1 from fibroblasts. Cardiovascular research. 1998;40:352-63
Author contact
![]() Corresponding author: Zhuo Zhao, MD, PhD, Department of Cardiology, Jinan Central Hospital, Affiliated with Shandong University, 105 Jiefang Rd, Jinan 250014, Shandong Province, China. Tel: (+86) 531-82965022; Fax: (+86) 531-82506006; E-mail: zhaozhuo1230com
Corresponding author: Zhuo Zhao, MD, PhD, Department of Cardiology, Jinan Central Hospital, Affiliated with Shandong University, 105 Jiefang Rd, Jinan 250014, Shandong Province, China. Tel: (+86) 531-82965022; Fax: (+86) 531-82506006; E-mail: zhaozhuo1230com