Impact Factor ISSN: 1449-2288
- Issue 12; 2026
- Issue 11; 2026
- Issue 10; 2026
- Issue 9; 2026
- Issue 8; 2026
- Volume 22; 2026
- Past Issues
- Advance Articles
- Editorial Board
- Cover Images
- Index & Coverage
- Cover Suggestion
- Special Issues
Introduction
Materials and methods
Results
Discussion
Conclusions
Abbreviations
Supplementary Material
Acknowledgements
References

 Global reach, higher impact
Int J Biol Sci 2019; 15(1):208-220. doi:10.7150/ijbs.27537 This issue Cite
Research Paper
Establishing a prediction model for prostate cancer bone metastasis
Song Chen1,2*, Lu Wang1,2*, Kaiyu Qian3,4, Wei Jiang4,5, Haiqing Deng6, Qiang Zhou1, Gang Wang3,4, Xuefeng Liu7, Chin-Lee Wu8, Yu Xiao1,2,3,4 ![]() , Xinghuan Wang1,2,4,5
, Xinghuan Wang1,2,4,5 ![]()
1. Department of Urology, Zhongnan Hospital of Wuhan University, Wuhan, China
2. Wuhan Clinical Cancer Research Center of Urology and Male Reproduction, Wuhan, China
3. Department of Biological Repositories, Zhongnan Hospital of Wuhan University, Wuhan, China
4. Human Genetics Resource Preservation Center of Wuhan University, Wuhan, China
5. Medical Research Institute, Wuhan University, Wuhan, China
6. Department of Urology, Renmin Hospital of Wuhan University, Wuhan, China
7. Department of Pathology, Lombardi Comprehensive Cancer Center, Georgetown University Medical School, Washington DC, USA
8. Department of Urology, Massachusetts General Hospital, Harvard Medical School, Boston, Massachusetts, USA
*these authors have contributed equally to this work.
Received 2018-10-10; Accepted 2018-11-11; Published 2019-1-1
Abstract

We collected clinical data from 308 prostate cancer (PCa) patients to investigate the clinical characteristics and independent risk factors of bone metastasis (BM) and to establish a prediction model for BM of PCa and determine the necessity of bone scans. Univariate and multivariate analyses were performed based on age, biopsy Gleason score (BGS), clinical tumor stage (cTx), total prostate specific antigen (tPSA), free prostate specific antigen (fPSA), fPSA/tPSA, prostate volume, alkaline phosphatase (ALP), serum calcium and serum phosphorus. Moreover, 80 of the 308 PCa patients had a PI-RADS v2 score and were analysed retrospectively. The univariate analysis showed that the BGS, cTx, tPSA, fPSA, prostate volume and ALP were significant. The multivariate logistic regression analysis showed significant differences among the BGS, cTx, tPSA and ALP. Four cases should be highly suspected with BM: (i) cTl-cT2, BGS ≤7, ALP >120 U/L and tPSA >90.64 ng/ml; (ii) cTl-cT2, BGS ≥8, and ALP >120 U/L; (iii) cT3-cT4, BGS ≤7, and ALP >120 U/L; and (iv) cT3-cT4 and BGS ≥8. After the PI-RADS v2 score was included in the model, the AUC of the prediction model rose from 0.884 (95% CI: 0.813-0.996) to 0.934 (95% CI: 0.883-0.986). This model may help determine the necessity of bone scans to diagnose BM for PCa patients.
Keywords: Prediction analysis model, prostate cancer, bone metastasis, PI-RADS v2, BGS, cTx, tPSA, ALP
Introduction
Prostate cancer (PCa) is the second most common malignant tumour in males worldwide, with approximately 1,111,700 new cases and 307,500 deaths in 2012 [1]. Emerging evidence indicates remarkable disparities in PCa epidemiology among different ethnic groups [2, 3]. Currently, the incidence and mortality rates in China are rapidly increasing [4]. Ren et al. revealed different genetic characteristics of PCa between Chinese and Caucasian men. Novel genetic alterations in PCDH9 and PLXNA1 were associated with disease progression [5]. PCa frequently metastasizes to bone, and studies have shown that bone metastases (BMs) have occurred in 13.3%-26% of PCa patients at the first diagnosis in China, which is far more than the rates of 3%-10% in European countries and 3%-5% in the United States [6-8]. Once BM occurs in a PCa patient, treatment is very limited and the survival rate is greatly reduced [9]. Currently, the technetium Tc 99m methylene diphosphonate (Tc 99m MDP) bone scan method is accepted as the standard and is the most frequently used examination to diagnosis bone metastasis in PCa [10]. Due to the wide screening for tPSA in Europe and the United States, the lesions of newly diagnosed patients are often confined to the prostate tissue without other organ invasion, and the incidence of BM is less than 10% [8]. However, new evidence shows that the rate of PCa bone metastases has also increased in the US in recent years [11]. Briganti et al. used a regression model to predict the risk of bone metastasis in newly diagnosed PCa patients for the first time [12]. This model showed that some patients might not have to undergo a bone scan to reduce the medical burden, especially when the predicted value was less than 8.3%. Consequently, European and American urological guidelines indicate that the conventional bone scan examination is only suitable for patients with suspected lesions but not for all newly diagnosed PCa patients [10]. However, the Chinese Urology Association Guidelines specify that a bone scan is recommended once PCa is diagnosed [13], especially for those with a tPSA ≥20 ng/ml and a BGS >7, which is different from the European and American urological guidelines. Therefore, many Chinese patients undergo expensive bone scan examinations, although only approximately half are actually diagnosed with BM. In addition, most small hospitals are not equipped with Tc 99m MDP equipment. Moreover, because the specificity of the Tc 99m MDP is as low as 57%, further judgement based on computed tomography (CT) or magnetic resonance imaging (MRI) is often required [14]. Numerous studies have demonstrated that age, BGS, clinical tumour stage (cTx), PSA, ALP, prostate volume, serum calcium, and serum phosphorus may be factors that influence PCa bone metastasis and thus can be used to predict whether patients require a bone scan [12, 15-17]. However, few studies have provided a recommendation criterion suitable for Chinese PCa patients [6, 13, 18], and these studies have lacked external data validation. The Prostate Imaging Reporting and Data System Version 1 (PI-RADS v1) was published by the European Society of Urogenital Radiology (ESUR) in 2012 and developed into the PI-RADS v2 in 2015 by members of the PI-RADS Steering Committee, several working groups with international representation, and administrative support from the American College of Radiology (ACR) using the best available evidence and expert consensus opinion [19]. The PI-RADS v2 was designed to improve detection, localization, characterization, and risk stratification in patients with suspected cancer for treatment of naive prostate glands, with an overall objective of improving patient outcomes [19]. These guidelines can improve the early diagnosis and treatment of PCa and reduce unnecessary biopsies and treatment. Some studies have shown that the PI-RADS v2 has great value for the diagnosis of clinically significant prostate cancer (CS PCa) [20-22]. However, no evidence for its role in the diagnosis of PCa bone metastasis has been reported. Thus, we conducted a retrospective study to determine the diagnostic correlations among age, BGS, cTx, PSA, ALP, prostate volume, serum calcium, serum phosphorus and BM in newly diagnosed PCa patients in a local population in central China and analysed the value of the PI-RADS v2 score in predicting PCa bone metastasis.
Materials and methods
Study patients
This retrospective study collected three clinical datasets from two centres. Dataset 1 included 308 consecutive PCa patients who were newly diagnosed between January 2014 and November 2017 at the Department of Urology, Zhongnan Hospital of Wuhan University. Dataset 2 included 51 consecutive PCa patients who were newly diagnosed between January 2013 and December 2013 in the same centre. Dataset 3 included 43 consecutive PCa patients who were newly diagnosed between September 2016 and February 2017 in the Department of Urology, Renmin Hospital of Wuhan University. All patients were diagnosed with PCa by biopsy guided with transrectal ultrasound (TRUS). They had a complete clinical data record, including age, BGS, cTx, PSA, ALP, prostate volume, serum calcium, serum phosphorus and bone scan results. Additionally, 80 of the 308 PCa patients (2016.8-2017.11) had a PI-RADS v2 score. The study used clinical information from the patients and was approved by the Ethics Committee at Zhongnan Hospital of Wuhan University (approval number: 2015029). Informed consent was obtained from all subjects. All methods used for analysis of the clinical information were performed in accordance with the approved guidelines and regulations of the Department of Biological Repositories at Zhongnan Hospital of Wuhan University.
Inclusion criteria
Diagnosed with PCa by prostate biopsy guided with TRUS. (ii) Underwent a Tc 99m MDP bone scan, and the result was judged by two nuclear medical physicians with extensive experience. (iii) Had a complete clinical data record.
Exclusion criteria
Prior 5-alpha reductase inhibitor medication before the prostate biopsy. (ii) Bone injury or bone metabolic disease history (i.e., bone tumour). (iii) Acute or chronic urinary tract infections or urinary retention. (iv) Prostate massage, TRUS, digital rectal examination or urethral catheterization was performed one week prior to admission. (v) Could not determine whether the patient had a merger of bone metastases or had no Tc 99m MDP result.
Outcomes and study design
BM was the primary outcome. The Tc 99m MDP result was judged by two nuclear medicine physicians with extensive experience. BM on the Tc 99m MDP was defined as either orphaned or diverse asymmetric areas of increased tracer uptake presence after excluding patients with a bone injury or bone metabolic disease history [23]. If the bone scan findings were ambiguous, we used CT and/or MRI to confirm the scintigraphy results. We sought a consult from a senior physician when necessary. According to the bone scan results, all patients were categorized into the BM-positive and BM-negative groups. Clinical dataset 1 was used to establish and evaluate the prediction analysis model for PCa bone metastasis, dataset 2 was used for cross-validation, and dataset 3 was used for external data validation. Additionally, 80 of the 308 patients (dataset 1) were used to appraise the value of the PI-RADS v2 score in predicting PCa bone metastasis.
Study variables
The TNM 2002 staging system was the guideline for assigning the cTx [24]. The BGS referenced the International Society of Urological Pathology (ISUP) consensus conference on Gleason grading of prostatic carcinoma [25]. The PI-RADS score referenced the PI-RADS v2 [19], which was formulated by the ACR in 2015 and published in European Urology in 2016. The prostate volume was measured by transabdominal prostate ultrasound prior to the prostate biopsy. The PSA, ALP, serum calcium, and serum phosphorus levels were determined when diagnosed.
Statistical analysis
For dataset 1, the age, BGS, cTx, prostate volume, and the PSA, ALP, serum calcium, and serum phosphorus levels were compared between the two patient groups with a two-sample t test or Mann-Whitney test. tPSA was employed with a natural logarithm due to dispersion of the tPSA levels. Continuous variables were described as averages, medians and ranges. The proportions of variables between two groups were calculated with the Chi-square test. Then, we compared the association between the independent variables and the bone scan results by univariate and multivariate logistic regression analyses to determine the independent risk factors of PCa bone metastasis. Considering the differences in the guidelines concerning the BGS and cTx, the BGS was divided into ≤3+4 and ≥4+3 or ≤7 and ≥8 and the cTx was divided into cT1-cT2 and cT3-cT4 or cT1-cT3 and cT4. We established five multivariate logistic regression prediction analysis models (models A, B, C, D, and E). ROC curves were generated for the univariate and multivariate logistic regression analyses, and the areas under the curves were calculated and compared. The largest AUC model was the best multivariate logistic regression prediction analysis model. The Net Reclassification Index (NRI) was used to evaluate the accuracy of the prediction ability. A nomogram was generated for the best model. A calibration curve was generated to assess the degree of fit of the nomogram-predicted probability with the actual probability. The cut-off was set based on the value of the maximum sum of the sensitivity and specificity on the best model curve. A discriminative PSA level was calculated when this cut-off together with other independent risk factors was substituted into the regression model to summarize a discriminant equation for the prediction analysis model. According to the comparison between the discriminant equation and bone scan results, some high-risk PCa bone metastases could be analysed. The analysis model was cross-validated using the leave-one-out method with dataset 2. External data validation was performed using dataset 3. The PI-RADS v2 scores of 80 PCa patients were compared with the Mann-Whitney test and Chi-square test to analyse the averages and proportions between two groups, respectively. Taking the best model as the reference, we established model F (excluded the PI-RADS v2 score) and model G (included the PI-RADS v2 score divided into ≤4 and 5) with the clinical data from these 80 PCa patients to compare changes in the ROC curves. All statistical analyses were performed with SPSS 16.0 and GraphPad Prism 5, and a p value <0.05 was considered statistically significant.
Results
Patient characteristics
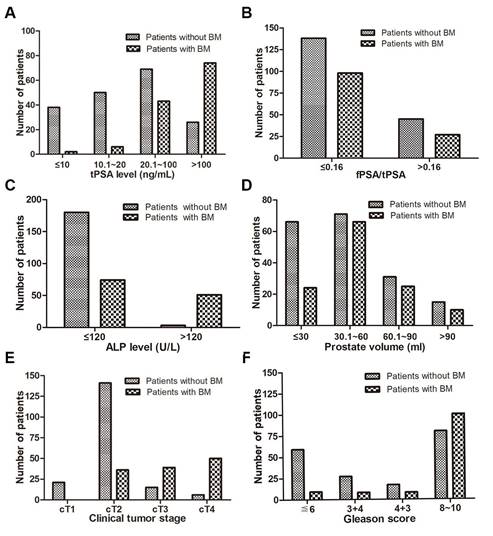
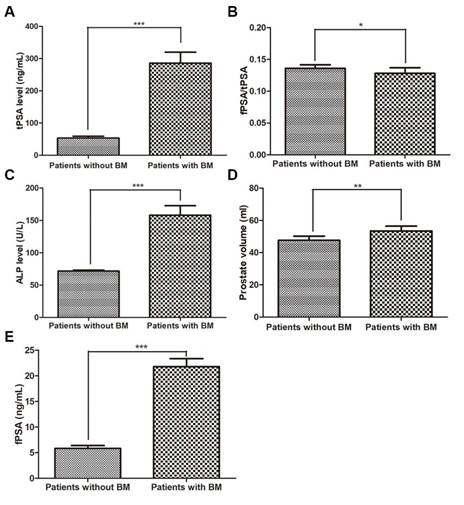
Of the 308 PCa patients, 183 were diagnosed without BM and 125 with BM (40.6%). The two-sample t test results showed that age, serum calcium, and serum phosphorus were not influencing factors of BM (p>0.05), whereas tPSA, fPSA, fPSA/tPSA, prostate volume and ALP were significantly different between the patients in the two groups (p<0.05). The Mann-Whitney test showed that the BGS and cTx were significant (p<0.05) influencing factors of BM. The BM-positive group patients had higher average PSA and ALP levels and prostate volumes than the BM-negative group patients (p<0.05 for all comparisons). Furthermore, the BM-positive group patients had a significantly higher BGS and cTx than the BM-negative group patients (Table 1 and Fig. 1-2). The Chi-square test also showed that the cTx, BGS and tPSA were significant influencing factors in the composition ratio (p<0.05). However, fPSA/tPSA and the prostate volume did not show significant differences (p>0.05, Table 2).
Univariate analysis for BM-negative and BM-positive patients.
| Variables | All patients (n=308) | BM-negative group (n=183) | BM-positive group (n=125) | p value |
|---|---|---|---|---|
| Age/years, n (%) | 0.903 | |||
| Average/Median (Range) | 73.1±8.9/74 | 73.0±8.7/75 | 73.1±9.2/73 | |
| 45-96 | 45-90 | 48-96 | ||
| <60 | 21 (6.8) | 11 (6.0) | 10 (8.0) | |
| 60-69 | 79 (25.6) | 52 (28.4) | 27 (21.6) | |
| 70-79 | 125 (40.6) | 73 (39.9) | 52 (41.6) | |
| ≥80 | 83 (26.9) | 47 (25.7) | 36 (28.8) | |
| BGS, n (%) | <0.001 | |||
| ≤6 | 68 (22.1) | 59 (32.2) | 9 (7.2) | |
| 3+4 | 35 (11.4) | 27 (14.8) | 8 (6.4) | |
| 4+3 | 25 (8.1) | 17 (9.3) | 8 (6.4) | |
| 8-10 | 180 (58.4) | 80 (43.7) | 100 (80.0) | |
| cTx, n (%) | <0.001 | |||
| T1 | 21 (6.8) | 21 (11.5) | 0 (0) | |
| T2 | 177 (57.5) | 141 (77.0) | 36 (28.8) | |
| T3 | 54 (17.5) | 15 (8.2) | 39 (31.2) | |
| T4 | 56 (18.2) | 6 (3.3) | 50 (40.0) | |
| tPSA(ng/ml), n (%) | <0.001 | |||
| Average/Median (Range) | 147.72±275.39/49.24 | 53.51±76.11/21.18 | 285.64±383.38/132.67 | |
| 1.28-1921.22 | 1.91-477.13 | 1.28-1921.22 | ||
| ≤10.0 | 40 (13.0) | 38 (20.8) | 2 (1.6) | |
| 10.1-20.0 | 56 (18.2) | 50 (27.3) | 6 (4.8) | |
| 20.1-100.0 | 112 (36.4) | 69 (37.7) | 43 (34.4) | |
| >100.0 | 100 (32.5) | 26 (14.2) | 74 (59.2) | |
| Ln (tPSA) (ng/ml) | <0.001 | |||
| Average/Median (Range) | 3.94±1.46/3.90 | 3.29±1.15/3.05 | 4.90±1.33/4.89 | |
| 0.25-7.56 | 0.65-6.17 | 0.25-7.56 | ||
| fPSA (ng/ml) | <0.001 | |||
| Average/Median (Range) | 12.32±14.74/4.84 | 5.85±7.79/3.17 | 21.79±17.21/18.00 | |
| 0.07-73.21 | 0.18-46.71 | 0.07-73.21 | ||
| fPSA/tPSA, n (%) | 0.045 | |||
| Average/Median (Range) | 0.13±0.09/0.11 | 0.14±0.08/0.11 | 0.13±0.10/0.10 | |
| 0.02-0.61 | 0.04-0.48 | 0.02-0.61 | ||
| ≤0.16 | 236 (76.6) | 138 (75.4) | 98 (78.4) | |
| >0.16 | 72 (23.4) | 45 (24.6) | 27 (21.6) | |
| Prostate volume (ml), n (%) | 0.015 | |||
| Average/Median (Range) | 49.97±34.02/41.35 | 47.63±34.38/38.71 | 53.40±33.32/46.91 | |
| 10.71-307.32 | 11.96-307.32 | 10.71-253.34 | ||
| ≤30 | 90 (29.2) | 66 (36.1) | 24 (19.2) | |
| 30.1-60 | 137 (44.5) | 71 (38.8) | 66 (52.8) | |
| 60.1-90 | 56 (18.2) | 31 (16.9) | 25 (20.0) | |
| >90 | 25 (8.1) | 15 (8.2) | 10 (8.0) | |
| ALP (U/L), n (%) | <0.001 | |||
| Average/Median (Range) | 106.67±115.15/74 | 71.62±22.24/69 | 157.99±166.23/99 | |
| 18-857 | 18-204 | 30-857 | ||
| ≤120 | 254 (82.5) | 180 (98.4) | 74 (59.2) | |
| >120 | 54 (17.5) | 3 (1.6) | 51 (40.8) | |
| Serum calcium (mmol/l), n | 0.064 | |||
| Average/Median (Range) | 2.17±0.17/2.18 | 2.18±0.18/2.20 | 2.15±0.15/2.15 | |
| 1.07-2.63 | 1.07-2.63 | 1.80-2.58 | ||
| <2.11 | 99 | 51 | 48 | |
| 2.11-2.52 | 204 | 128 | 76 | |
| >2.52 | 5 | 4 | 1 | |
| Serum phosphorus (mmol/l), n | 0.064 | |||
| Average/Median (Range) | 1.08±0.22/1.06 | 1.07±0.24/1.05 | 1.10±0.17/1.09 | |
| 0.45-2.97 | 0.45-2.97 | 0.17-1.68 | ||
| <0.85 | 26 | 18 | 8 | |
| 0.85-1.51 | 276 | 161 | 115 | |
| >1.51 | 6 | 4 | 2 |
The distribution ratio of each variable for patients with and without BM. (A) tPSA level, (B) fPSA/tPSA, (C) ALP level, (D) prostate volume, (E) clinical tumour stage, (F) Gleason score.
The level of each variable for patients with and without BM. (A) tPSA level, (B) fPSA/tPSA, (C) ALP level, (D) prostate volume, (E) fPSA (* p<0.05, ** p<0.01, *** p<0.001).
Chi-square test for BM factors (n=308).
| ALP (U/L) | Gleason score | Clinical T stage | tPSA (ng/ml) | fPSA/tPSA | Prostate volume/ml | |||||||
|---|---|---|---|---|---|---|---|---|---|---|---|---|
| ≤120 | >120 | ≤7 | ≥8 | T1-T2 | T3-T4 | ≤20.0 | >20.0 | ≤0.16 | >0.16 | ≤60 | >60 | |
| BM-negative group | 180 | 3 | 103 | 80 | 162 | 21 | 88 | 95 | 138 | 45 | 137 | 46 |
| BM-positive group | 74 | 51 | 25 | 100 | 36 | 89 | 8 | 117 | 98 | 27 | 90 | 35 |
| χ2 | 78.774 | 40.250 | 115.388 | 60.161 | 0.371 | 0.314 | ||||||
| p value | <0.001 | <0.001 | <0.001 | <0.001 | 0.543 | 0.575 | ||||||
As examples, Fig. 6A (i) shows the Tc 99m MDP imaging of an 84-year-old BM-negative PCa patient (no obvious Tc 99m aggregated to bone tissue), and Fig. 6A (ii) shows the imaging of a 61-year-old BM-positive PCa patient (extensive Tc 99m aggregated to bone tissue, e.g., the pelvis, humerus and skull). The white arrows in Fig. 6B (i, ii) indicate the clear prostate tumour lesion but no obvious bone tissue destruction in the 84-year-old BM-negative PCa patient. The white arrows in Fig. 6B (iii, iv) show the unambiguous prostate tumour lesion and obvious bone tissue destruction in the 61-year-old BM-positive PCa patient.
Appraisal of the value of the PI-RADS v2 score in predicting PCa BM. (A) i. Tc 99m MDP imaging of an 84-year-old BM-negative PCa patient. ii. Tc 99m MDP imaging of a 61-year-old BM-positive PCa patient. (B) i. The white arrows indicate a clear prostate tumour lesion in the 84-year-old BM-negative PCa patient. ii. The white arrows indicate no obvious bone tissue destruction in the 84-year-old BM-negative PCa patient. iii. The white arrows show an unambiguous prostate tumour lesion in the 61-year-old BM-positive PCa patient. iv. The white arrows show obvious bone tissue destruction in the 61-year-old BM-positive PCa patient. (C) i. The distribution ratio of the PI-RADS v2 score. ii. The average PI-RADS v2 score. (D) i. Comparison of ROC curves for models F and G, ii. Model F, AUC: 0.884 (0.813-0.996), iii. Model G, AUC: 0.934 (0.883-0.986).
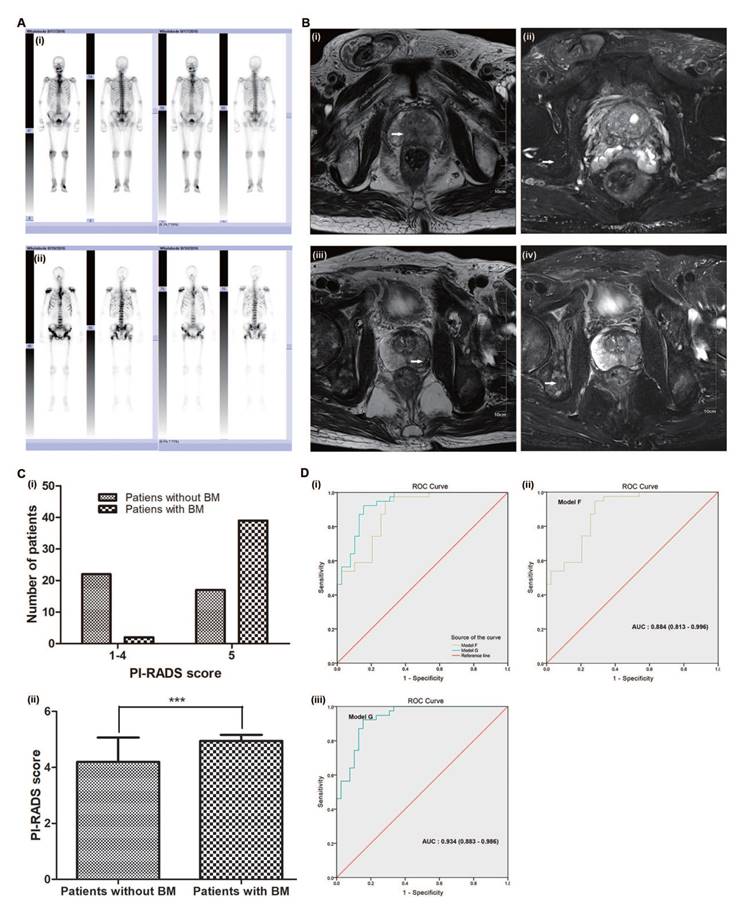
Of the 80 PCa patients, 39 were diagnosed without BM and 41 with BM (51.3%). The Mann-Whitney and Chi-square tests showed that the PI-RADS v2 scores were significantly different (both p<0.05, Fig. 6C and Supplementary Table S1) between the two groups. The average PI-RADS v2 score of the BM-negative group patients was 4.21 (close to 4), whereas the average score of the BM-positive group patients was 4.95 (almost 5) (Fig. 6C).
Univariate regression logistic analysis
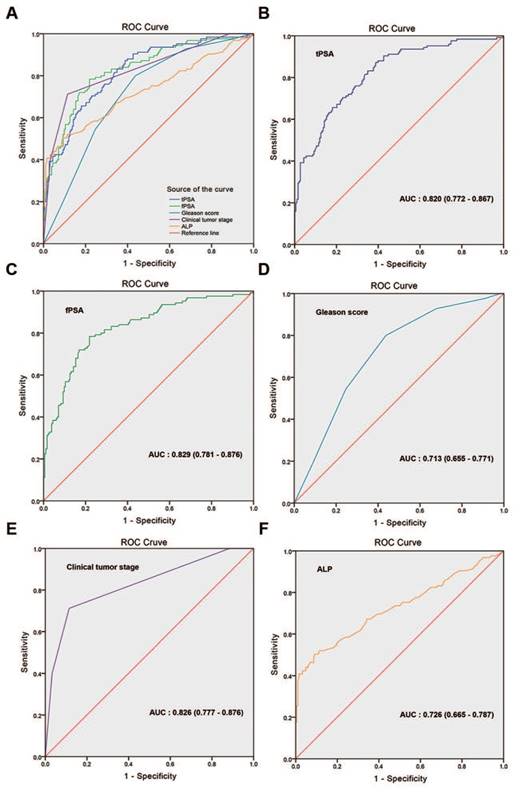
The univariate regression logistic analysis showed that the BGS, cTx, tPSA, ALP, and fPSA were significant predictors of BM (p<0.001 for all comparisons, Supplementary Table S2). ROC curves were generated for these significant predictors. Fig. 3 shows that the AUCs were 0.820 (95% CI: 0.772-0.867, p<0.001) for tPSA, 0.829 (95% CI: 0.781-0.876, p<0.001) for fPSA, 0.713 (95% CI: 0.655-0.771, p<0.001) for BGS, 0.826 (95% CI: 0.777-0.876, p<0.001) for cTx, and 0.726 (95% CI: 0.665-0.787, p<0.001) for ALP. Considering that a collinearity relationship existed between tPSA and fPSA, we did not include fPSA in the multivariate regression logistic analysis.
ROC curves of variables for the prediction of bone metastasis in patients with prostate cancer. (A) Comparison of the ROC curve for each single variable, (B) tPSA, AUC: 0.820 (0.772-0.867), (C) fPSA, AUC: 0.829 (0.781-0.876), (D) Gleason score, AUC: 0.713 (0.655-0.771), (E) clinical tumour stage, AUC: 0.826 (0.777-0.876), (F) ALP, AUC: 0.726 (0.665-0.787).
Multivariate regression logistic analysis
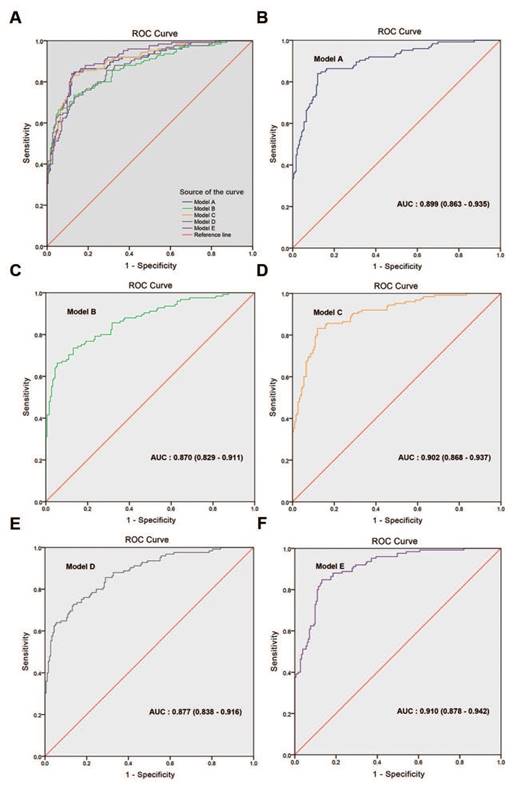
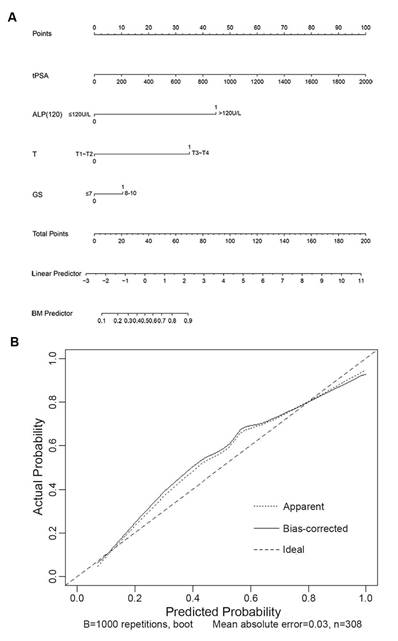
In the multivariate analyses, the BGS, cTx, tPSA, and ALP were the only independent predictors of BM (p<0.05 for all comparisons, Table 3). Model A combined the BGS (≤3+4; ≥4+3), cTx (cT1-cT2; cT3-cT4), tPSA, and ALP and presented an AUC of 0.899 (95% CI: 0.863-0.935). Model B combined the BGS (≤3+4; ≥4+3), cTx (cT1-cT3; cT4), tPSA, and ALP and presented an AUC of 0.870 (95% CI: 0.829-0.911). Model C combined the BGS (≤7; 8-10), cTx (cT1-cT2; cT3-cT4), tPSA, and ALP and presented an AUC of 0.902 (95% CI: 0.868-0.937). Model D combined the BGS (≤7; 8-10), cTx (cT1-cT3; cT4), tPSA, and ALP and presented an AUC of 0.877 (95% CI: 0.838-0.916). The AUC of model C was larger than that of models A, B and D. Based on model C, the optimized model (named model E) combined the BGS (≤7; 8-10), cTx (cT1-cT2; cT3-cT4), tPSA, and ALP (≤120 U/L; >120 U/L) and presented an AUC of 0.910 (95% CI: 0.878-0.942), which was the largest AUC obtained from the five models (Tables 3-4 and Fig. 4). The NRI was 9.64% compared with model C (Z=2.014, p=0.044, Supplementary Table S3). In the logistic regression prediction analysis, model E remained independently associated with a significantly increased risk of BGS (OR: 2.060; 95% CI: 0.996-4.262, p=0.051), cTx (OR: 11.220; 95% CI: 5.520-22.804, p<0.001), tPSA (OR: 1.003; 95% CI: 1.001-1.006, p=0.015), and ALP (OR: 22.033; 95% CI: 5.753-84.387, p<0.001). A nomogram was generated to directly calculate the probability of bone metastasis (Fig. 5A), and the calibration curve showed the degree of height fitting of the nomogram-predicted probability with the actual probability (Fig. 5B).
Multivariate regression logistic analysis for BM-negative and BM-positive patients (n=308).
| Variables | B | S.E | p value | OR (95% CI) |
|---|---|---|---|---|
| Model A | ||||
| BGS (≤3+4; ≥4+3) | 0.816 | 0.395 | 0.039 | 2.261 (1.043-4.902) |
| cTx (T1-T2; T3-T4) | 2.459 | 0.353 | 0.000 | 11.693 (5.856-23.345) |
| tPSA | 0.003 | 0.001 | 0.015 | 1.003 (1.001-1.006) |
| ALP | 0.020 | 0.006 | 0.000 | 1.021 (1.010-1.032) |
| Model B | ||||
| BGS (≤3+4; ≥4+3) | 1.066 | 0.367 | 0.004 | 2.905 (1.414-5.968) |
| cTx (T1-T3; T4) | 2.473 | 0.502 | 0.000 | 11.864 (4.432-31.758) |
| tPSA | 0.004 | 0.001 | 0.005 | 1.004 (1.001-1.007) |
| ALP | 0.020 | 0.005 | 0.000 | 1.021 (1.010-1.031) |
| Model C | ||||
| BGS (≤7; 8-10) | 0.791 | 0.365 | 0.030 | 2.205 (1.079-4.506) |
| cTx (T1-T2; T3-T4) | 2.431 | 0.355 | 0.000 | 11.368 (5.672-22.784) |
| tPSA | 0.003 | 0.001 | 0.015 | 1.003 (1.001-1.006) |
| ALP | 0.021 | 0.005 | 0.000 | 1.021 (1.010-1.032) |
| Model D | ||||
| BGS (≤7; 8-10) | 1.068 | 0.338 | 0.002 | 2.909 (1.499-5.643) |
| cTx (T1-T3; T4) | 2.437 | 0.503 | 0.000 | 11.441 (4.269-30.664) |
| tPSA | 0.004 | 0.001 | 0.007 | 1.004 (1.001-1.007) |
| ALP | 0.021 | 0.005 | 0.000 | 1.022 (1.011-1.032) |
| Model E | ||||
| BGS (≤7; 8-10) | 0.723 | 0.371 | 0.051 | 2.060 (0.996-4.262) |
| cTx (T1-T2; T3-T4) | 2.418 | 0.362 | 0.000 | 11.220 (5.520-22.804) |
| tPSA | 0.003 | 0.001 | 0.015 | 1.003 (1.001-1.006) |
| ALP (≤120 U/L; >120 U/L) | 3.093 | 0.685 | 0.000 | 22.033 (5.753-84.387) |
Model A: BGS is for ≥4+3 compared to ≤3+4.
cTx is for T3-T4 compared to T1-T2.
Model B: BGS is for ≥4+3 compared to ≤3+4.
cTx is for T4 compared to T1-T3.
Model C: BGS is for 8-10 compared to ≤7.
cTx is for T3-T4 compared to T1-T2.
Model D: BGS is for 8-10 compared to ≤7.
cTx is for T4 compared to T1-T3.
Model E: BGS is for 8-10 compared to ≤7.
cTx is for T3-T4 compared to T1-T2.
ALP is for >120 U/L compared to ≤120 U/L.
Compare with models A, B, C, D and E (n=308).
| Model | Sensitivity | Specificity | AUC (95% CI) |
|---|---|---|---|
| Model A | 0.840 | 0.880 | 0.899 (0.863-0.935) |
| Model B | 0.664 | 0.945 | 0.870 (0.829-0.911) |
| Model C | 0.832 | 0.880 | 0.902 (0.868-0.937) |
| Model D | 0.728 | 0.863 | 0.877 (0.838-0.916) |
| Model E | 0.848 | 0.869 | 0.910 (0.878-0.942) |
ROC curves of the multivariate regression logistic analysis models. (A) Comparison of ROC curves for models A-E. (B) Model A, AUC: 0.899 (0.863-0.935), (C) model B, AUC: 0.870 (0.829-0.911), (D) model C, AUC: 0.902 (0.868-0.937), (E) model D, AUC: 0.877 (0.838-0.916), (F) model E, AUC: 0.910 (0.878-0.942).
The nomogram and calibration curve developed for model E. (A) Nomogram. To estimate the risk of BM, the points for each variable were calculated by drawing a straight line from a patient's variable value to the axis labelled “Points”. The score sum is converted to a probability in the lowest axis. (B) Calibration curve. The nomogram-predicted probability is plotted on the x-axis, and the actual probability is plotted on the y-axis. Mean absolute error=0.03.
The multivariate logistic regression analysis results were summarized using the following equation:
Logit (P) = -2.572 + 0.723GS + 2.418T + 0.003tPSA + 3.093ALP (120)
If the BGS is ≤7, then the GS=0; if the BGS is ≥8, then the GS=1. If the cTx is cT1-cT2, then T=0; if the cTx is cT3-cT4, then T=1. If the ALP is ≤120 U/L, then the ALP (120)=0; if the ALP is >120 U/L, then the ALP (120)=1. Each point on the ROC curve of model E had a Logit(P) value. The cut-off value was selected with the value of the maximum sum of sensitivity and specificity on the curve, which was calculated as Logit(P)=0.834, with a sensitivity of 84.8% and specificity of 86.9%.
Then, the multivariate logistic regression prediction analysis model was transformed to the following discriminant equation:
D = -3.406 + 0.723GS + 2.418T + 0.003tPSA + 3.093ALP (120)
If D>0, then we judge that BM has occurred. If D≤0, then we judge that BM has not occurred.
Analysis of the prediction model discriminant equation
A discriminative PSA level was calculated when this cut-off together with other independent risk factors was substituted into the regression model. Table 5 shows the comparison between the discriminant equation and the bone scan results. The following four cases should be highly suspected of BM: (i) cTl-cT2, BGS ≤7, ALP >120 U/L and tPSA >90.64 ng/ml; (ii) cTl-cT2, BGS ≥8, and ALP >120 U/L; (iii) cT3-cT4, BGS ≤7, and ALP >120 U/L; and (iv) cT3-cT4 and BGS ≥8.
Comparison between the discriminant equation results and bone scan results (n=308).
| cTx | BGS | ALP | tPSA | D | Bone scan | |
|---|---|---|---|---|---|---|
| Positive (%) | Negative (%) | |||||
| 1-2 | ≤7 | ≤120 | ≤987.03 | ≤0 | 7 | 98 (93.3) |
| >987.03 | >0 | 0 (0) | 0 | |||
| >120 | ≤90.64 | ≤0 | 1 | 0 (0) | ||
| >90.64 | >0 | 5 (100) | 0 | |||
| 8-10 | ≤120 | ≤777.50 | ≤0 | 15 | 61 (80.3) | |
| >777.50 | >0 | 0 | 0 | |||
| >120 | N | >0 | 8 (72.7) | 3 | ||
| 3-4 | ≤7 | ≤120 | ≤286.24 | ≤0 | 4 | 6 (60.0) |
| >286.24 | >0 | 2 (100) | 0 | |||
| >120 | N | >0 | 5 (100) | 0 | ||
| 8-10 | ≤120 | ≤76.71 | ≤0 | 18 | 4 (18.2) | |
| >76.71 | >0 | 28 (71.8) | 11 | |||
| >120 | N | >0 | 32 (100) | 0 | ||
Evaluation of the prediction model
Dataset 2, which was collected over a different time period, was used for cross validation of our established prediction model. The results showed that the sensitivity was 78.9% and the specificity was 84.4% (Supplementary Table S4). To validate the stability of the model, external data validation was performed with dataset 3, which was independently collected in another hospital. The results showed that the sensitivity was 78.6% and the specificity was 82.8% (Supplementary Table S5). We compared our prediction model with other published prediction models [6, 12, 26] and found that the AUC from our model was the largest (Supplementary Table S6). Taken together, the results show that our established model exhibits high accuracy and stability and is well generalized for other independent datasets.
Appraisal of the value of the PI-RADS v2 score in predicting PCa bone metastases
Of the 80 PCa patients, the multivariate analyses showed that the BGS, cTx, tPSA, ALP and PI-RADS v2 score were independent predictors of BM (p<0.05 for all comparisons). Model F combined the BGS (≤7; 8-10), cTx (cT1-cT2; cT3-cT4), tPSA, and ALP (≤120 U/L; >120 U/L) and presented an AUC of 0.884 (95% CI: 0.813-0.996). Model G combined the BGS (≤7; 8-10), cTx (cT1-cT2; cT3-cT4), tPSA, ALP (≤120 U/L; >120 U/L), and PI-RADS v2 score (≤4; 5) and presented an AUC of 0.934 (95% CI: 0.883-0.986). The AUC of model G was larger than that of model F (Fig. 6D).
Discussion
Several epidemiological studies have shown that PSA screening programmes can assist with early detection of PCa [27, 28]. Due to incomplete early detection of PSA in China, the incidence of PCa is significantly lower than that of Europe and the United States, but the rate of BM at first diagnosis is higher. BM significantly affects patients' treatments and prognoses. Currently, Tc 99m MDP remains the most sensitive diagnostic bone scan method and is the accepted standard and most frequent examination for detection of PCa bone metastasis. Despite its high accuracy in detecting bone lesions, not all PCa patients have an equal risk of bone metastasis when diagnosed. More than half of PCa patients do not show BM at the bone scan diagnosis. Numerous guidelines have been devoted to identifying subgroups of patients who can safely omit bone scans (Supplementary Table S7); however, multicentre large sample studies of bone metastasis in Chinese PCa patients are rare [6, 12-13, 15-18]. The Chinese Urology Association (CUA) guidelines specify that a bone scan is recommended once PCa is diagnosed [13], especially for those with a tPSA ≥20 ng/ml and a BGS >7. However, a bone scan may be omitted for an asymptomatic patient with a tPSA <20 ng/ml and a BGS ≤3+4, as indicated in the European Association of Urology (EAU) guideline [10].
The National Comprehensive Cancer Network (NCCN) indicates that cT1 PCa patients with a tPSA >20 ng/ml, cT2 PCa patients with a tPSA >10 ng/ml, cT3-cT4 patients or patients with a BGS ≥8 are appropriate for a bone scan [29]. The American Urological Association (AUA) indicates that clinically localized PCa patients, those with a tPSA >20 ng/ml, locally advanced PCa patients or patients with a BGS ≥8 should take a bone scan [30]. The European Society for Medical Oncology (ESMO) stated that a bone scan was unnecessary for cT1-cT2a patients and those with a BGS <7 and tPSA <10 ng/ml [31]. Briganti et al. suggested that performing a bone scan was more important for intermediate-risk (cT2-cT3, BGS >7, and tPSA >10 ng/ml) and high-risk PCa patients (BGS ≥8) [12]. McArthur et al. stated that a bone scan could be safely omitted for newly diagnosed PCa patients with a BGS <8 and a tPSA <20 ng/ml [32]. These studies were based on studies of Western populations. However, the clinical characteristics of PCa bone metastases in Asian populations, including Chinese patients, showed an obvious disparity with those of Western patients. Tanaka et al. demonstrated that PCa patients should be strongly suspected of having BM if they had a BGS ≥4+3 and tPSA >50 ng/ml [17] in a retrospective study with 857 Japanese patients. Wang et al. [6] studied 501 Chinese patients and suggested that a bone scan was needed for all cT4 PCa patients, cT1-cT3 PCa patients with a BGS ≤3+4 and a tPSA >132.1 ng/ml, and cT1-T3 patients with a BGS ≥4+3 and tPSA >44.5 ng/ml. These findings are closely similar to those of this study. Lin et al. [18] stated that bone scintigraphy was recommended for patients who had a higher risk of BM, as indicated by a tPSA ≥20 ng/ml or BGS ≥8. The value of a bone scan is limited for PCa patients with a tPSA ≤20 ng/ml and BGS ≤7. However, these studies made no further distinction between the cTx, BGS, tPSA and serum ALP and lacked external data validation. Considering the differences in the guidelines and studies of the BGS and cTx, we divided the BGS into ≤3+4 and ≥4+3 or ≤7 and ≥8 and the cTx into cT1-cT2 and cT3-cT4 or cT1-cT3 and T4. We established four multivariate logistic regression prediction analysis models (models A-D). The areas under the curves were calculated and compared. The results showed that the AUC of model C was larger than that of models A, B, and D. In other words, patients with a BGS of 8-10 had a significantly higher risk than those with a BGS ≤7, and the risk of patients with a cTx of cT3-cT4 was far higher than that of patients with cT1-cT2. To facilitate the discriminant analysis, we converted ALP into stratified variables according to the Chi-square test results and the guidelines. Based on model C, we established an optimized model named model E. The AUC of model E was 0.910, which was the largest of the five models. The NRI of model E was 9.64% compared with model C, which indicated that the prediction ability of the model had improved and that the proportion of correct classification had increased by 9.64%. The difference between models C and E was not significant, possibly because the sample size was not sufficient. A nomogram was generated to directly calculate the probability of BM, which is a convenient method for patients and doctors to judge BM. In the nomogram calibration curve, the predicted probability compared with the actual probability showed a degree of height fitting. Based on comparison of the discriminant equation results with the bone scan results, the following four cases should be highly suspected of having BM: (i) cTl-cT2, BGS ≤7, ALP >120 U/L and tPSA >90.64 ng/ml; (ii) cTl-cT2, BGS ≥8, and ALP >120 U/L; (iii) cT3-cT4, BGS ≤7, and ALP >120 U/L; and (iv) cT3-cT4 and BGS ≥8. The cross-validation and external data validation proved that our established model had high accuracy and stability and was well generalized for other independent datasets. Therefore, we concluded that the BGS, tPSA, cTx, and ALP were independent risk factors for PCa bone metastasis in Chinese patients. Prediction model E can help determine whether a bone scan is needed when diagnosing BM for Chinese PCa patients.
The PI-RADS v2 is a new imaging system formulated by the ACR in 2015 that has been popularized in many countries for the diagnosis of prostate by MRI. The system is designed to improve the detection of CS PCa. The PI-RADS v2 defines clinically significant cancer based on pathology/histology as a BGS ≥7 (including 3+4 with a prominent but not predominant Gleason 4 component) and/or a volume ≥0.5 cc and/or extra-prostatic extension (EPE) [19]. The assessment is based on the probability that combined mpMRI findings on T2W, DWI, and DCE correlate with the presence of a clinically significant cancer for each lesion in the prostate gland [20]. The system uses five categories as follows: PI-RADS 1: very low (clinically significant cancer is highly unlikely to be present); PI-RADS 2: low (clinically significant cancer is unlikely to be present); PI-RADS 3: intermediate (the presence of clinically significant cancer is equivocal); PI-RADS 4: high (clinically significant cancer is likely to be present); and PI-RADS 5: very high (clinically significant cancer is highly likely to be present) [19]. The PI-RADS v2 recommends that a biopsy should be considered for PI-RADS 4 or 5 but not for PI-RADS 1 or 2 [19]. Clearly, the PI-RADS v2 provides some proposals for prostate biopsies no clear advice on whether a bone scan is needed. The great value of the PI-RADS v2 for the diagnosis of CS PCa has been confirmed by some studies [13, 21-22], but it is somewhat disappointing in terms of its ability to predict clinically significant disease. No evidence of its role in the diagnosis of PCa bone metastases has been reported, even though these clinically significant cancers, such as PI-RADS 4 or 5, are more prone to BMs. In this study, the average PI-RADS v2 score significantly differed between the BM-negative group (4.21) and the BM-positive group (4.95). A higher PI-RADS v2 score indicated a greater probability that the patient would be diagnosed with CS PCa, which induced a higher risk of BMs. After the PI-RADS v2 score was included in the model, the AUC of the prediction model rose from 0.884 (95% CI: 0.813-0.996) to 0.934 (95% CI: 0.883-0.986). Thus, the PI-RADS v2 score may have great value for improving the prediction of BM.
The BGS, cTx, tPSA, ALP and PI-RADS v2 score may represent the parameters of prostate pathology, urinary surgery, tumour biomarkers, bone metabolism biomarker and prostatic imaging. For urologists, when judging whether or not BM has occurred, multiple factors should be referenced rather than relying only on the Tc 99m MDP. Of course, due to the small amount of data, more cases are needed for further study. In addition, because of the limitation of inclusion criteria, this study is only applicable to the majority not all PCa patients at the first diagnosis.
Conclusions
The BGS, tPSA, cTx, and ALP are independent risk factors of PCa bone metastasis in Chinese patients. This prediction model can help determine whether a bone scan is needed when diagnosing BM for a Chinese PCa patient. The PI-RADS v2 score may be a new factor to predict bone metastasis in human PCa.
Abbreviations
ACR: American College of Radiology; ALP: Alkaline Phosphatase; AUA: American Urological Association; AUC: Area Under Curve; BGS: Biopsy Gleason Score; BM: Bone Metastasis; CS PCa: clinical significance prostate cancer; CT: Computerized Tomography; cTx: Clinical Tumor Stage; CUA: Chinese Urological Association; EAU: European Association of Urology; ESMO: European Society for Medical Oncology; ESUR: European Society of Urogenital Radiology; fPSA: Free Prostate Specific Antigen; ISUP: International Society of Urological Pathology; MRI: Magnetic Resonance Imaging; NCCN: National Comprehensive Cancer Network; NRI: Net Reclassification Index; PCa: Prostate Cancer; PI-RADS: Prostate Imaging Reporting and Data System; ROC: Receiver Operating Characteristic; Tc 99m MDP: Technetium Tc 99m Methylene Diphosphonate; tPSA: Total Prostate Specific Antigen; TRUS: Transrectal Ultrasound.
Supplementary Material
Supplementary figures and tables.
Acknowledgements
The excellent technical assistance of Shanshan Zhang and Danni Shan is gratefully acknowledged. This study was supported by the National Natural Science Foundation of China (grant number 81772730), the Central Government Guides Local Science and Technology Development Special Fund (grant number 2018ZYYD023), and Natural Science Foundation of Hubei Province of China (grant number 2016CFB113). The funders had no role in study design, data collection and analysis, decision to publish, or preparation of the manuscript.
Competing Interests
The authors have declared that no competing interest exists.
References
1. Torre LA, Bray F, Siegel RL, Ferlay J, Lortet-Tieulent J, Jemal A. Global cancer statistics, 2012. CA Cancer J Clin. 2015;65:87-108
2. Mao X, Yu Y, Boyd LK, Ren G, Lin D, Chaplin T. et al. Distinct genomic alterations in prostate cancers in Chinese and western populations suggest alternative pathways of prostate carcinogenesis. Cancer Res. 2010;70:5207-12
3. Zhau HE, Li Q, Chung LW. Interracial differences in PCa progression among patients from the united states, China and Japan. Asian J Androl. 2013;15:705-7
4. Chen W, Zheng R, Baade PD, Zhang S, Zeng H, Bray F. et al. Cancer statistics in China, 2015. CA Cancer J Clin. 2016;66:115-32
5. Ren S, Wei G, Liu D, Wang L, Hou Y, Zhu S. et al. Whole-genome and Transcriptome Sequencing of Prostate Cancer Identify New Genetic Alterations Driving Disease Progression. Eur Urol. 2018;73:322-39
6. Wang Y, Wan F, Xu L, Zhao N, Xu Z, Wang H. et al. Is it safe to omit baseline bone scan for newly diagnosed prostate cancer patients? Urol Int. 2015;94:342-6
7. Aus G, Bergdahl S, Lodding P, Lilja H, Hugosson J. Prostate cancer screening decreases the absolute risk of being diagnosed with advanced prostate cancer-results from a prospective, population-based randomized controlled trial. Eur Urol. 2007;51:659-64
8. Norgaard M, Jensen AO, Jacobsen JB, Cetin K, Fryzek JP, Sorensen HT. Skeletal related events, bone metastasis and survival of prostate cancer: a population based cohort study in Denmark (1999 to 2007). J Urol. 2010;184:162-7
9. Yang C, Qi GS, Rong RM, He J. Clinical features and treatment strategies for older prostate cancer patients with bone metastasis. Asian J Androl. 2013;15:759-63
10. Mottet N, Bellmunt J, Bolla M, Briers E, Cumberbatch MG, De Santis M. et al. EAU-ESTRO-SIOG Guidelines on Prostate Cancer. Part 1: Screening, Diagnosis, and Local Treatment with Curative Intent. Eur Urol. 2017;71:618-29
11. Rohini KH, Sally WW, Adam R, Melissa P, Alexander L, Gary HL. et al. Incidence of bone metastases in patients with solid tumors: analysis of oncology electronic medical records in the United States. BMC cancer. 2018;18:44-54
12. Briganti A, Passoni N, Ferrari M, Capitanio U, Suardi N, Gallina A. et al. When to perform bone scan in patients with newly diagnosed prostate cancer: external validation of the currently available guidelines and proposal of a novel risk stratification tool. Eur Urol. 2010;57:551-8
13. Lin Y, Mao Q, Chen B, Wang L, Liu B, Zheng X. et al. When to perform bone scintigraphy in patients with newly diagnosed prostate cancer? a retrospective study. BMC Urol. 2017;17:41-5
14. Even-Sapir E, Metser U, Mishani E, Lievshitz G, Lerman H, Leibovitch I. The detection of bone metastases in patients with high-risk prostate cancer: 99mTc-MDP Planar bone scintigraphy, single- and multi-field-of-view SPECT, 18F-fluoride PET, and 18F-fluoride PET/CT. J Nucl Med. 2006;47:287-97
15. Lai MH, Luk WH, Chan JC. Predicting bone scan findings using sPSA in patients newly diagnosed of prostate cancer: feasibility in Asian population. Urol Oncol. 2011;29:275-9
16. Lee SH, Chung MS, Park KK, Yom CD, Lee DH, Chung BH. Is it suitable to eliminate bone scan for prostate cancer patients with PSA </= 20 ng/mL? World J Urol. 2012;30:265-9
17. Tanaka N, Fujimoto K, Shinkai T, Nakai Y, Kuwada M, Anai S. et al. Bone scan can be spared in asymptomatic prostate cancer patients with PSA of <=20 ng/ml and Gleason score of <=6 at the initial stage of diagnosis. Jpn J Clin Oncol. 2011;41:1209-13
18. Chen Y, Lin Y, Nie P, Jiang W, Liu Y, Yuan R. et al. Associations of Prostate-Specific Antigen, Prostate Carcinoma Tissue Gleason Score, and Androgen Receptor Expression with Bone Metastasis in Patients with Prostate Carcinoma. Med Sci Monit. 2017;23:1768-74
19. Weinreb JC, Barentsz JQ, Choyke PL, Cornud F, Haider MA, Macura KJ. et al. PI-RADS Prostate Imaging - Reporting and Data System: 2015, Version 2. Eur Urol. 2016;69:16-40
20. Park SY, Jung DC, Oh YT, Cho NH, Choi YD, Rha KH. et al. Prostate Cancer: PI-RADS Version 2 Helps Preoperatively Predict Clinically Significant Cancers. Radiology. 2016;280:108-16
21. Mehralivand S, Bednarova S, Shih JH, Mertan FV, Gaur S, Merino MJ. et al. Prospective Evaluation of PI-RADSTM Version 2 Using the International Society of Urological Pathology Prostate Cancer Grade Group System. J Urol. 2017;198:583-90
22. Seo JW, Shin SJ, Taik Oh Y, Jung DC, Cho NH, Choi YD. et al. PI-RADS Version 2: Detection of Clinically Significant Cancer in Patients With Biopsy Gleason Score 6 Prostate Cancer. AJR Am J Roentgenol. 2017;209:W1-W9
23. Hricak H, Choyke PL, Eberhardt SC, Leibel SA, Scardino PT. Imaging prostate cancer: a multidisciplinary perspective. Radiology. 2007;243:28-53
24. Greene FL, Page DL, Fleming ID. et al. American Joint Committee on Cancer staging manual. 6th ed. Philadelphia, PA: Springer. 2002
25. Epstein JI, Allsbrook WC Jr, Amin MB, Egevad LL, ISUP Grading Committee. The 2005 International Society of Urological Pathology (ISUP) Consensus Conference on Gleason Grading of Prostatic Carcinoma. Am J Surg Pathol. 2005;29:1228-42
26. Zhou JQ, Zhu Y, Yao XD, Zhang SL, Dai B, Zhang HL. et al. Necessity analysis of bone scan in patients with newly diagnosed prostate cancer. Zhonghua Yi Xue Za Zhi. 2013;93:248-51
27. Gallina A, Chun FK, Suardi N, Eastham JA, Perrotte P, Graefen M. et al. Comparison of stage migration patterns between Europe and the USA: an analysis of 11 350 men treated with radical prostatectomy for prostate cancer. BJU Int. 2008;101:1513-8
28. Ryan CJ, Elkin EP, Small EJ, Duchane J, Carroll P. Reduced incidence of bony metastasis at initial prostate cancer diagnosis: data from CaPSURE. Urol Oncol. 2006;24:396-402
29. Kawachi MH, Bahnson RR, Barry M, Busby JE, Carroll PR, Carter HB. et al. NCCN clinical practice guidelines in oncology: prostate cancer early detection. J Natl Compr Canc Netw. 2010;8:240-62
30. Greene KL, Albertsen PC, Babaian RJ, Carter HB, Gann PH, Han M. et al. Prostate specific antigen best practice statement: 2009 update. J Urol. 2013;189:S2-S11
31. Parker C, Gillessen S, Heidenreich A, Horwich A, ESMO Guidelines Committee. Cancer of the prostate: ESMO Clinical Practice Guidelines for diagnosis, treatment and follow-up. Ann Oncol. 2015;26(Suppl 5):v69-77
32. McArthur C, McLaughlin G, Meddings RN. Changing the referral criteria for bone scan in newly diagnosed prostate cancer patients. Br J Radiol. 2012;85:390-4
Author contact
![]() Corresponding author: Dr. Yu Xiao, Email: yu.xiaoedu.cn, Tel. +86-27-6781-2689, Fax: +86-27-6781-2892; and Dr. Xinghuan Wang, Email: wangxinghuanedu.cn, Tel. +86-27-6781-3104, Fax: +86-27-6781-2892.
Corresponding author: Dr. Yu Xiao, Email: yu.xiaoedu.cn, Tel. +86-27-6781-2689, Fax: +86-27-6781-2892; and Dr. Xinghuan Wang, Email: wangxinghuanedu.cn, Tel. +86-27-6781-3104, Fax: +86-27-6781-2892.