10
Impact Factor
ISSN: 1449-2288
Int J Biol Sci 2019; 15(2):351-368. doi:10.7150/ijbs.28522 This issue Cite
Research Paper
Exosomal transfer of obesity adipose tissue for decreased miR-141-3p mediate insulin resistance of hepatocytes
1. Institute of Biomedicine, Department of Cellular Biology, Jinan University
2. National engineering research center of genetic Medicine, Key laboratory of Bioengineering Medicine of Guangdong Province, Jinan University
3. Department of Biotechnology, Jinan University
# These authors contributed equally to this work
Received 2018-7-14; Accepted 2018-11-12; Published 2019-1-1
Abstract

Exosomes, the nano-vesicles released from living cells, were the important mediator for cell-to-cell communication. In order to clarify whether the exosomes derived from obesity adipose tissue mediate insulin resistance of hepatocytes, we extract the exosomes from the adipose tissue of different mice models. Exosomes derived from ob/ob mice (Ob-exosomes), B6 mice fed with a high-fat diet (HFD-exosomes) and normal B6 mice (WT-exosomes) displayed similar size and molecular makers, but their effect on the insulin sensitivity of hepatocytes were obviously different or opposite. Abundant exosomal miRNAs in Ob-, HFD- and WT-exosomes were detected by the Next Generation Sequencing. The levels of miR-141-3p in Ob- and HFD-exosomes were significantly lower than WT-exosomes. MiR-141-3p can be effectively delivered into AML12 cells accompanied by the absorption of exosomes, but the absorption of miR-141-3p into AML12 cells could be blocked by GW4869, an inhibitor of exosome biogenesis and release. Importantly, the Ob-exosomes or miR-141-3p knockdown in WT--exosomes obviously inhibited the insulin response and glucose uptake of AML12 cells, however, the inhibitory effects on insulin function disappeared after the overexpression of miR-141-3p in Ob-exosomes or AML12 cells. The effects of miR-141-3p on insulin function could be achieved by improving the level of phosphorylation of AKT and enhancing insulin signal transduction. Therefore, the absorption of hepatocytes for exosomes released from obesity adipose tissue containing less miR-141-3p than healthy adipose tissue can significantly inhibit the insulin sensitivity and glucose uptake. Our study may certify a novel mechanism that the secretion of “harmful” exosomes from obesity adipose tissues cause insulin resistance.
Keywords: obesity, insulin resistance, exosomes, miR-141-3p, hepatocytes
Introduction
Obesity often causes insulin resistance and type 2 diabetes, which substantially increases the risk of cardiovascular disease (1). Studies have shown that insulin resistance is a critical process in obesity-induced cardiovascular disease (2). In the condition of insulin resistance, some tissues such as the liver, fat, and muscles show a diminished respond to the insulin.
Adipose tissue dysfunction is known to be an important factor in the pathogenesis of type 2 diabetes and other metabolic diseases (3). In obesity, the adipose tissue that accumulates at different sites may induce diverse metabolic disease risk. Compared to subcutaneous adipose tissue, visceral adipose tissue is more closely associated with insulin resistance and cardiovascular disease (4, 5). Now adipose tissue is seen as a dynamic endocrine organization that communicates with other metabolic tissues to regulate nutrient and energy balance. Previous studies showed that adipose tissue releases secreting mediators such as tumor necrosis factor alpha (TNF-α), interleukin-6 (IL-6), leptin and adiponectin to affect insulin function in target tissues (6-8). Besides these mediators, adipose tissue of obese mice also secretes extracellular vesicles associated with systemic insulin resistance (9).
Recently, exosomes have been paid more attention as an important mediator for cell-to-cell communication. Exosomes are 50-200 nm vesicles that are released from multivesicular bodies (10). Exosomes carry some cargos including genetic material such as mRNA, microRNA (miRNA), or even small amounts of DNA, and proteins such as transcription factors, cytokines, and growth factors (11). When exosomes contact with target cells, the exosomes and their cargos can be absorbed into cells through endocytosis (12, 13). Therefore, exosomes can alter the fate or state of the target cells, which may become differentiated (14), repressed (15), activated (16) according to the delivered proteins, or miRNAs. Exosomes are considered to be the most promising therapeutic tool for multiple diseases because of the characteristics of information delivery (12).
Many miRNAs exist in the circulation as well as in tissue, and a large fraction of these are found in exosomes (8). MiRNAs are 19-22 nucleotides non-coding RNAs that function as negative regulators of gene expression. MiRNAs are able to influence many biological processes, so miRNA deregulation become a distinguishing feature of several pathological conditions, such as cancer, obesity and diabetes (17-19). Furthermore, previous studies have demonstrated that miRNAs signature in response to insulin in insulin-sensitive tissue of obese type 2 diabetic patients suggesting a potential role of these miRNAs in insulin resistance (20, 21).
In the present study, we showed that miRNAs are present in the exosomes by the Next Generation Sequencing and qRT-PCR analyses. The sequencing data of miRNA showed that compared to wild type visceral adipocyte, several downregulated miRNAs derived from obese visceral adipose tissue were closely related to insulin resistance. The goal of this study was to characterize the function of exosomes derived from obese mice adipose tissue and their ability to transfer miRNAs to modulate insulin resistance of the hepatocytes.
Results
Characterizations of exosomes extracted from adipose tissue
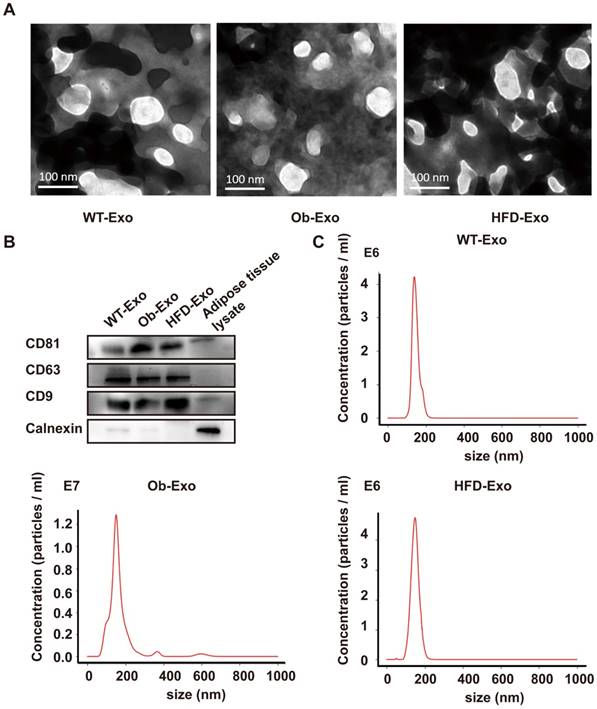
Different Exosomes (WT-, Ob- and HFD-exosomes) respectively derived from adipose tissues of normal B6 mice, ob/ob obese mice and high-fat diet obese mice were prepared according to the procedure described in methods. Transmission electron microscopy was used to detect the negatively stained exosomes, and the results revealed that they were closed lipid-bilayered vesicular form (Figure 1A). Additionally, the purified WT-, Ob- and HFD-exosomes contained CD81, CD63, and CD9, three molecular markers of exosomes. CD81, CD63, and CD9 were enriched in exosomes at higher levels than those present in adipose tissue lysate. Small amounts of Calnexin was detectable in exosomes, indicating that exosomes preparations were free of contaminating nonexosome proteins (Figure 1B). Furthermore, the physical properties of the exosomes were assessed, and it was determined that the WT-, Ob- and HFD-exosomes exhibited similar physical characters. The size of exosomes secreted from Ob adipose (155+/-1.2nm) or HFD adipose (149+/-2.8nm) was similar to that of WT adipose (147+/-3.3nm), which was measured with Nanoparticle Tracking Analysis (NTA) (Figure 1C). Collectively, these data indicated that obese conditions do not alter exosomes size and molecular markers.
Adipose exosomes can be absorbed into AML12 cells
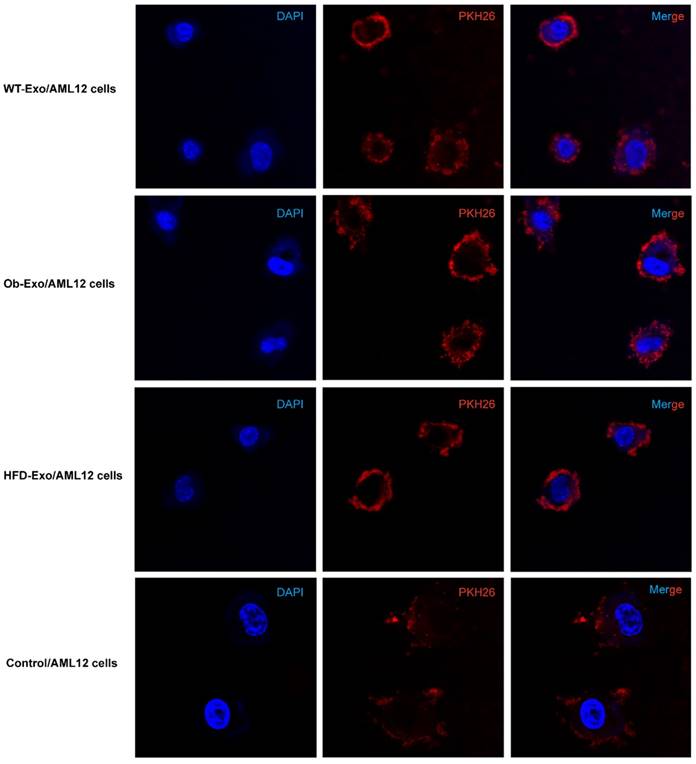
In order to prove that adipocyte-derived exosomes can influence gene expression in AML12 cells, we first showed the exosomes can be absorbed into AML12 cells in vitro. WT-, Ob- and HFD-exosomes were labeled with the red fluorescent membrane dye PKH26 and added to AML12 cells culture fluid, respectively. Six hours later, most of AML12 cells obtained the PKH26-labeled exosomes, and WT-, Ob- and HFD-exosomes were distributed similarly in the cytoplasm of AML12 cells (Figure 2).
Adipose exosomes affect the insulin sensitivity and glucose uptake of AML12 cells
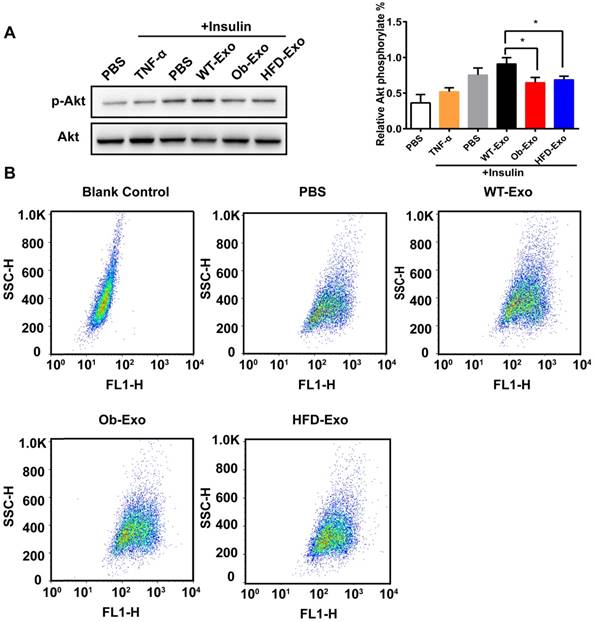
To detect the effect of exosomes on insulin sensitivity and glucose uptake in AML12 cells, AML12 cells were treated with WT-, Ob- or HFD-exosomes, and PBS was used as a negative control, TNF-α was used as a positive control. After insulin stimulation, phosphorylation of AKT (Ser473), a central player in the insulin signaling pathway, was detected by Western blot analyses. The phosphorylation levels of AKT were lower in the AML12 cells cultured with Ob- or HFD-exosomes than in the AML12 cells cultured with WT-exosomes, suggesting that the insulin responses was inhibited in the AML12 cells absorbing Ob- or HFD-exosomes (Figure 3A). 2-NBDG, a fluorescent glucose analog was used to detect glucose uptake in AML12 cells by flow cytometry. The results showed the spontaneous fluorescence intensity of AML12 cells was 30.80±1.61, the fluorescence intensity of PBS-, WT-exosomes-, Ob-exosomes- and HFD-exosomes- treated group were respectively 245.67±2.08, 273.67±5.51, 214.00±4.58 and 239.67±3.79. Compared with WT exosomes-treated group, the fluorescence intensity of Ob-exosomes- and HFD-exosomes-treated group were respectively decreased 21.8% and 10.2% (Figure 3B). These results showed that insulin-stimulated transport of glucose was inhibited in AML12 cells treated with Ob- or HFD-exosomes, indicating that insulin signal transduction in Ob- or HFD-exosomes-treated AML12 cells was impaired. We also found the insulin responses and insulin-stimulated transport of glucose was inhibited in HepG2 cells treated with Ob- exosomes (Supplementary Figure 1).
Characterization of exosomes released from WT-, Ob-, and HFD-adipose tissue. (A) WT- (WT-Exo), Ob- (Ob-Exo) and HFD-exosomes (HFD-Exo) were examined under electron microscopy. (B) WT-, Ob- and HFD-exosomes were analyzed by immunoblotting for the presence of the exosomal protein markers CD81, CD63 and CD9, and for the absence of the cellular protein Calnexin, adipose tissue lysate was used as control (20 μg of exosomal/ adipose tissue lysate protein was loaded for Western-blotting). (C) The exosome size was measured using A Nanoparticle Tracking Analysis. n=3 independent experiments. All values were expressed as means ± SD.
Adipose exosomes can be absorbed into AML12 cells. WT-, Ob- and HFD-exosomal membranes were labeled with PKH26 (red) and coincubated with AML12 cells (nuclei stained blue with DAPI) for 6h. AML12 cells were treated with PKH26 without exosomes as control (nucleid stained blue with DAPI). Intracellular PKH26 demonstrates exosomal uptake into AML12 cells.
Expression of miRNAs in WT-, Ob- or HFD-exosomes
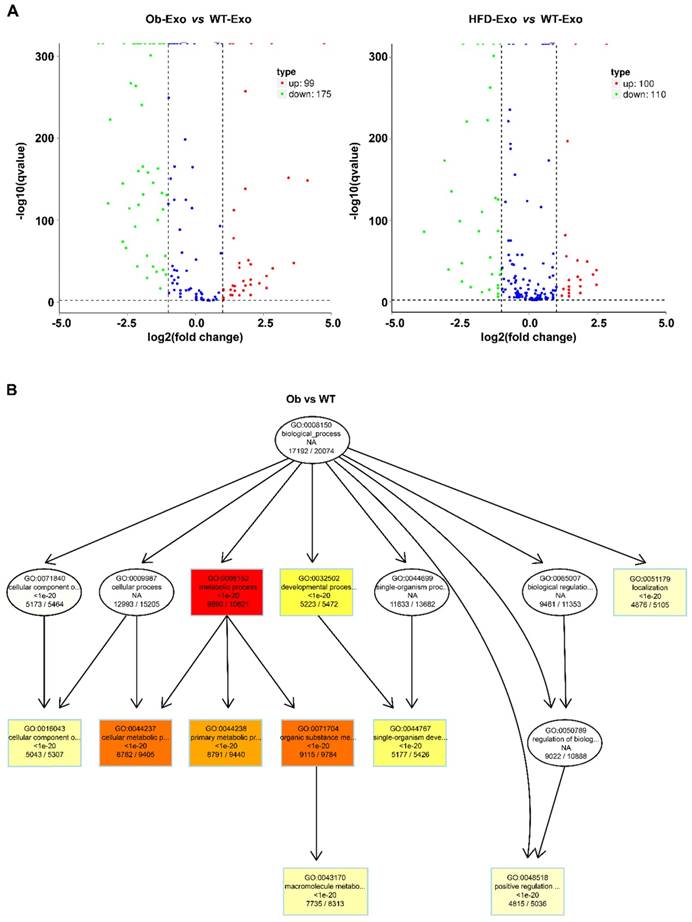
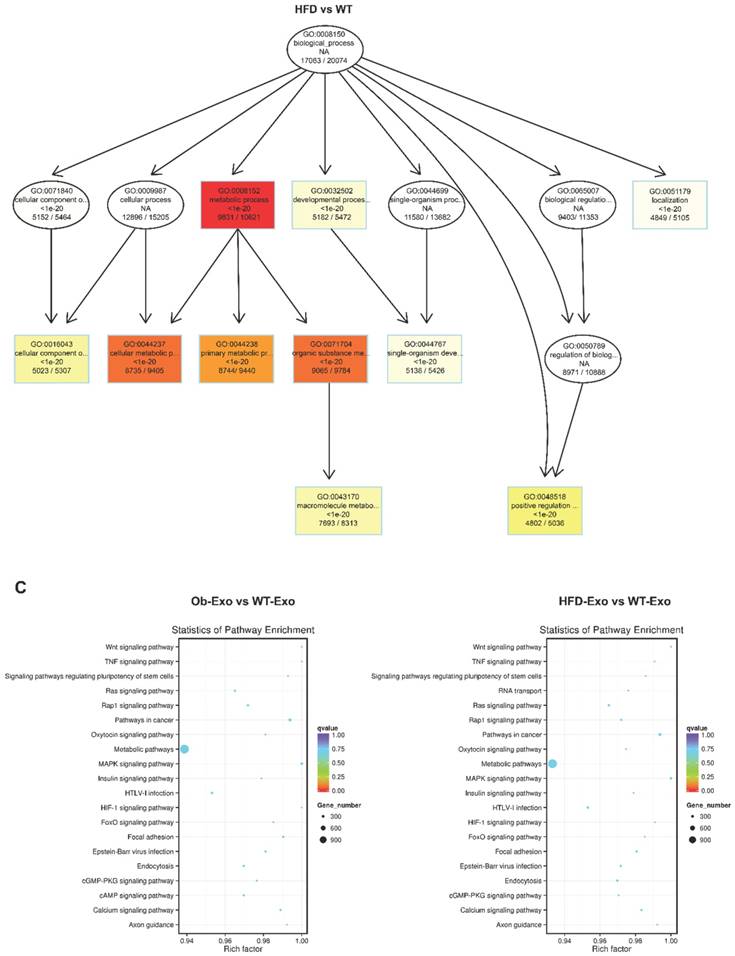
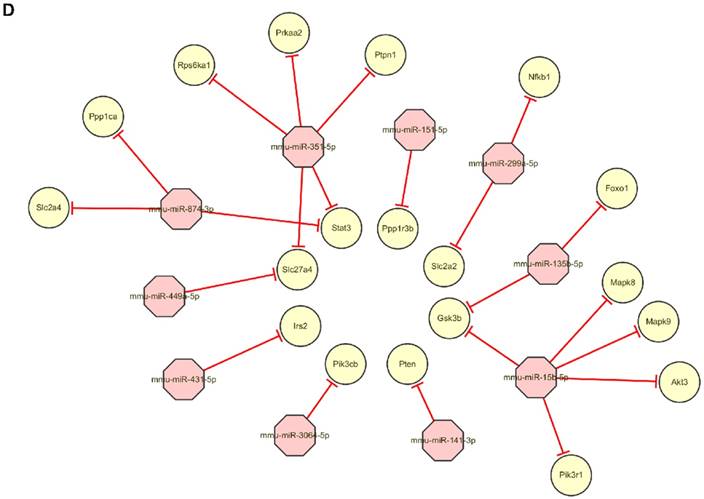
After the exosomes were isolated from normal B6 mice, ob/ob obese mice, or HFD obese mice, the exosomal miRNAs expression profiles were analyzed by the Next Generation Sequencing (illumina HiSeqTM2500/MiSeq). The results revealed that Ob-exosomes had 99 miRNAs were upregulated and 175 miRNAs were downregulated, HFD exosomes had 100 miRNAs were upregulated and 110 miRNAs were downregulated, compared with WT exosomes miRNAs (Figure 4A). Predicted targets for miRNAs were searched from the miRNA-mRNA target databases TargetScan and miRanda. The potential functions of miRNA targets were estimated by the Gene Ontology (GO) terms (Figure 4B). The most significant biological function was the “metabolic process”. GO analysis indicates that Ob- and HFD-exosomes miRNAs could affect metabolic process. It was interesting given the fact that metabolic disorder is a characteristic feature of obesity. We analyzed the pathways in which the putative target genes were involved by KEGG database (Figure 4C). As illustrated in Figure 4B, there were 20 pathways were significant enrichment. It is well known that Insulin signaling pathway plays important roles in regulating hepatic insulin sensitivity and glucose uptake. Based on the significantly regulated GOs and pathways, we selected the top ten fold change miRNAs that had significantly different expression in insulin signaling pathway (Table 1). After that we constructed miRNAs-gene-networks to screen the connection of the selected miRNAs and their target genes (Figure 4D). Because there are minor differences in the miRNAs of exosomes released from HFD mice in comparison with ob/ob mice. We focused on the Ob-exosomes in the later study.
Ob- or HFD-exosomes impair activation of the insulin signaling pathway in vitro. (A) Effect of WT-, Ob- and HFD-exosomes on AKT phosphorylation of insulin-induced AML12 cells. TNF-α was used as a positive control and PBS was used as a negative control. *p <0.05, Ob-Exo vs WT-Exo, HFD-Exo vs WT-Exo. (B) Flow cytometry dot plots of 10000 AML12 cells. The 2D plots indicating the relative FL1 fluorescence intensity (2-NBDG) of AML12 cells. The Blank Control was AML12 cells without 2-NBDG, showed the spontaneous fluorescence intensity of AML12 cells. n=3 independent experiments. All values were expressed as means ± SD.
Adipose exosomes can deliver miR-141-3p into AML12 cells
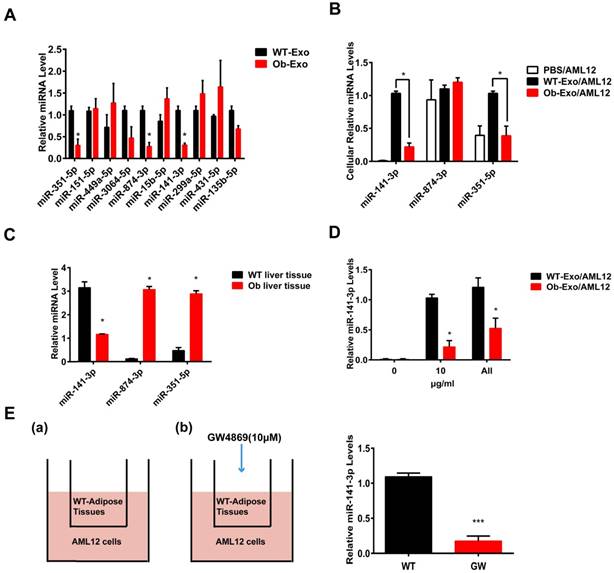
The expression levels of the ten miRNAs identified in the sequencing analysis were validated using quantitative RT-PCR assay (Figure 5A). The three down regulated miRNAs (miR-351-5p, miR-874-3p, and miR-141-3p) showed significantly different expression in Ob exosomes compared to the control WT-exosomes, but the five down regulated miRNAs (miR-151-5p, miR-449a-5p, miR-3064-5p, miR-15b-5p, miR-431-5p) and two up regulated miRNA (miR-299a-5p, miR-135b-5p) failed to replicate.
To investigate whether the three down regulated miRNAs can be delivered into AML12 cells by exosomes, AML12 cells were treated with PBS, WT- or Ob-exosomes (10 μg/ml). 24 hours later, the results of qRT-PCR revealed that the miR-141-3p levels were respectively increased by 103- and 39-fold in AML12 cells treated with WT- and Ob-exosomes, compared to the AML12 cells treated with PBS. Besides, compared to AML12 cells treated with WT-exosomes, the miR-141-3p levels were decreased by 4.6-fold and the miR-351-5p levels were decreased by 2.6-fold in AML12 cells treated with Ob-exosomes. However, the level of miR-874-3p had no significant difference between WT-exosome- and Ob-exosome-treated AML12 cells (Figure 5B). The reason maybe that the level of endogenous miR-874-3p in AML12 cells are too high to distinguish its slight increase caused by exosomes. These results indicate that exosomes from WT adipose tissue and Ob adipose tissue can effectively deliver the three miRNAs into AML12 cells. MiRNAs delivered into the recipient cells may affect the behavior of the recipient cells. For further detecting the expression change of the three miRNA in vivo, we isolated miRNA from the liver of ob/ob mice or WT mice, and the three miRNA levels were analyzed by qRT-PCR method. The results showed that the miR-141-3p levels were decreased by 2.7-fold in ob/ob mice liver, compared to WT mice, but the expression of miR-351-5p and miR-874-3p were significant higher in Ob mice liver (figure 5C). Consistent with the decrease in the expression of miR-141-3p in Ob mice liver, miR-141-3p also decreased in AML12 cells treated with Ob-exosomes compared to WT-exosomes. So we focused on miR-141-3p in the later study.
miRNA expression in WT-, Ob- or HFD-exosomes. (A) Volcano plot based on the Next Generation Sequencing demonstrates differences expression levels of miRNAs between Ob/HFD-exosomes and WT-exosomes. The abscissa represents the fold change of miRNA in different experimental groups, the ordinate represents the statistically significant change in miRNA expression levels, the scattered points in the figure represent individual miRNAs, blue dots indicate miRNAs without significant differences, red dots indicate significantly up-regulated differential miRNAs, and green dots indicate significantly down-regulated differential miRNAs. (B) Biological process of predicted target genes. Each box represents a GO term, the content from top to bottom represents the order of GO term's id, the description of GO, the P value of GO enrichment, the number of candidate target genes under the GO/the number of background genes under the GO. The depth of color represents the degree of enrichment. The darker the color is, the higher the degree of enrichment is. (C) Significantly changed pathways of predicted target genes. The Rich factor refers to the ratio of the number of differential genes located in the pathway to the total number of genes that are located in the pathway. The greater the Rich factor is, the higher the degree of enrichment is. We selected the top 20 of the enrichment pathways to be shown in the figure. (D) A network of miRNAs mmu-miR-151-5p, mmu-miR-449a-5p, mmu-miR-351-5p, mmu-miR-3064-5p, mmu-miR-874-3p, mmu-miR-15b-5p, mmu-miR-141-3p, mmu-miR-299a-5p, mmu-miR-431-5p, mmu-miR-135b-5p, and their predicted target genes.
Differential expression of the ten miRNAs. Ob-exosomes (Ob-Exo) or HFD-exosomes (HFD-Exo) vs WT-exosomes (WT-Exo).
| Ob-Exo vs WT-Exo | HFD-Exo vs WT-Exo | ||||||||||
|---|---|---|---|---|---|---|---|---|---|---|---|
| sRNA | Ob | WT | log2.Fold_change | p.value | q.value | HFD | WT | log2.Fold_change | p.value | q.value | |
| miR-351-5p | 0 | 25.53 | -5.67 | 7.12E-09 | 1.35E-10 | 0 | 28.65 | -5.84 | 8.59E-09 | 1.37E-10 | |
| miR-151-5p | 0 | 25.53 | -5.67 | 7.12E-09 | 1.35E-10 | 0 | 28.65 | -5.84 | 8.59E-09 | 1.37E-10 | |
| miR-449a-5p | 0 | 25.53 | -5.67 | 7.12E-09 | 1.35E-10 | 0 | 28.65 | -5.84 | 8.59E-09 | 1.37E-10 | |
| miR-3064-5p | 0 | 51.06 | -6.67 | 1.31E-15 | 3.74E-17 | 0 | 57.30 | -6.84 | 1.45E-15 | 3.91E-17 | |
| miR-874-3p | 52.15 | 76.59 | -0.55 | 2.33E-05 | 4.20E-07 | 0 | 85.95 | -7.42 | 1.10E-21 | 3.70E-23 | |
| miR-15b-5p | 0 | 102.1 | -7.67 | 2.55E-27 | 1.03E-28 | 0 | 114.6 | -7.84 | 2.20E-27 | 9.31E-29 | |
| miR-141-3p | 0 | 153.1 | -8.25 | 1.01E-37 | 4.91E-39 | 0 | 171.9 | -8.42 | 6.52E-38 | 3.40E-39 | |
| miR-299a-5p | 208.6 | 0 | 8.70 | 3.41E-38 | 1.74E-39 | 26.25 | 0 | 5.71 | 2.47E-07 | 3.14E-09 | |
| miR-431-5p | 0 | 25.53 | -5.67 | 7.12E-09 | 1.35E-10 | 0 | 28.65 | -5.84 | 8.59E-09 | 1.37E-10 | |
| miR-135b-5p | 0 | 52.15 | 6.70 | 5.08E-12 | 1.25E-13 | 26.25 | 0 | 5.71 | 2.47E-07 | 3.14E-09 |
sRNA: miRNA id. Ob: Read count value of Ob-exosomes miRNAs after calibration (sample1). WT: Read count value of WT-exosomes miRNAs after calibration (sample 2). HFD: Read count value of HFD-exosomes miRNAs after calibration (sample 3). log2.Fold_change: log2 (Sample1/Sample2 or Sample3).
To determine the concentration effects of Ob or WT-exosomes, AML12 cells were treated with elevated doses of Ob- or WT-exosomes from 0 to all exosomes isolated from the adipose tissue of one mouse (figure 5D). The expression of miR-141-3p were quantified.
We next tested whether transportation of miR-141-3p from adipose tissue to AML12 cells relies on exosomes. Co-cultures of B6 mice adipose tissue/AML12 cells were treated with GW-4869 (10μM), a neutral sphingomyelinase inhibitor that can inhibit exosome formation and release (22). We found that the WT-exosomes-mediated increase of miR-141-3p in AML12 cells was significantly reduced upon addition of GW-4869 (Figure 5E). These results indicate that the transport of miR-141-3p from adipose tissue to AML12 cells is dependent on exosomes.
Adipose exosomes deliver miR-141-3p into AML12 cells. (A) The expression levels of the ten Ob- or WT-exosomal miRNA, C. elegans miR-39 was used as a spike-in control for qRT-PCR of exosomal RNA analysis.*p <0.05, Ob-Exo vs WT-Exo. (B) The levels of miR-141-3p, miR-874-3p and miR-351-5p were examined in AML12 cells treated with PBS, WT exosomes or Ob exosomes. U6 RNA was used as an internal control for qRT-PCR of cellular RNA analysis. *p <0.05, Ob-Exo/AML12 vs WT-Exo/AML12. (C) The levels of miR-141-3p, miR-874-3p and miR-351-5p were examined in wide type B6 mice liver tissue and ob/ob obese mice liver tissue. U6 RNA was used as an internal control. *p <0.05, Ob liver tissues vs WT liver tissues. (D) AML12 cells were treated with elevated doses of Ob- or WT-exosomes from 0 to all exosomes isolated from the adipose tissue of one mouse, we examined the expression of miR-141-3p in AML12 cells. U6 RNA was used as an internal control. *p <0.05, Ob-Exo/AML12 vs WT-Exo/AML12. (E) Transportation of miR-141-3p from adipose tissue into AML12 cells is blocked by the exosome inhibitor GW4869. Schemes of AML12 cells co-cultured with: (a) WT-adipose tissue and (b) GW4869-treated WT-adipose tissue. 48h later, AML12 cells were collected for the determination of miR-141-3p levels by qRT-PCR. Addition of GW4869 prevented the increase of miR-320 in AML12 cells co-cultured with WT-adipose tissue. ***p<0.001, GW vs WT. n=3 independent experiments. All values were expressed as means ± SD.
Overexpression of miR-141-3p significantly promoted insulin sensitivity and glucose uptake of AML12 cells
The miR-141-3p target gene was predicted to be PTEN by TargetScan and miRanda software. In order to verify the direct binding effect of miR-141-3p on PTEN expression, the putative seed-binding sequence of PTEN or a mutant sequence were cloned into the luciferase reporter vector pGL3 (Figure 6A). As shown in Fig. 6B, compared with the control group, pGL3-Pten luciferase activity was significantly down-regulated after overexpression of miR-141-3p, while pGL3-Pten-mut luciferase activity was not significantly changed. The above results demonstrated that the potential binding sites of miR-141-3p and PTEN are truly present. To examine the effect of overexpression of miR-141-3p on insulin resistance and glucose uptake in AML12 cells, we infected AML12 cells with 5-carboxyfluorescein labeled miRNA negative control (miR-NC-FAM), miR-141-3p mimic or miRNA Negative Control (NC). MiRNA mimics are small, chemically modified double-stranded RNAs that mimic endogenous miRNAs and enable miRNA functional analysis by up-regulation of miRNA activity. MiR-141-3p was overexpressed via transfection of miR-141-3p mimic. Transfection efficiency was evaluated by miR-NC-FAM and qRT-PCR. Fluorescent imaging demonstrated that the miRNA became abundant within the cells (Figure 6C). QRT-PCR results revealed that miR-141-3p levels were elevated significantly in miR-141-3p mimic infected AML12 cells, compared with NC infected AML12 cells (Figure 6D). Western-blotting analysis showed that levels of PTEN, a negative regulator of PI3K/AKT signaling pathway and a predicted target gene of miR-141-3p by miRNA-mRNA target databases TargetScan and miRanda, were significantly reduced by 1.9-fold in AML12 cells infected with miR-141-3p mimic, compared with AML12 cells infected with NC (Figure 6E). It was proved that overexpression of miR-141-3p inhibited the expression of PTEN successfully. Then we detected whether overexpression of miR-141-3p could affect AML12 cells' insulin sensitivity and glucose uptake.
Overexpression of miR-141-3p increased AML12 cells insulin sensitivity and glucose uptake. (A)Wild-type and mutant 3'-UTR seeding region of PTEN binding to miR-141-3p. (B) Luciferase activity assessment following different miR-141-3p treatments showed luciferase activity was significantly decreased with wild-type PTEN 3'-UTR reporter, whereas no change was observed in the mutation reporter following miR-141-3p mimic co-transfection. (C) AML12 cells were infected with Negative control FAM. (D) AML12 cells were infected with miR-141-3p mimic or Negative Control and the miR-141-3p levels were measured with qRT-PCR. U6 RNA was used as an internal control. (E) The protein levels of PTEN was significantly reduced in AML12 cells infected with mimic-miR-141-3p, compared with AML12 cells infective with Negative Control. (F) Overexpression of miR-141-3p greatly promoted the levels of phosphorylation of AKT in AML12 cells. (G)Overexpression of miR-141-3p greatly promoted glucose uptake in AML12 cells. n=3,*p<0.05, **p<0.01, ****p<0.0001, miR-141-3p mimic vs NC. n=3 independent experiments. All values were expressed as means ± SD.
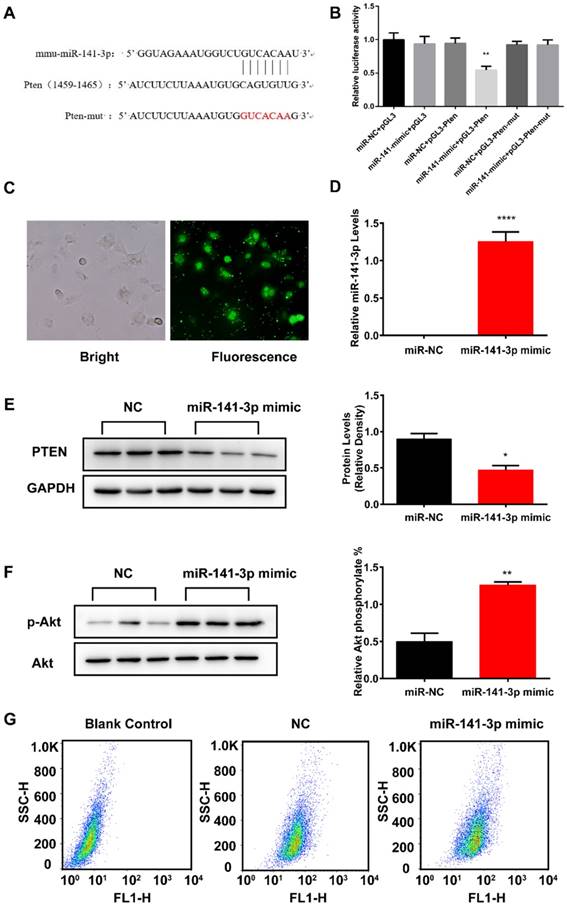
After insulin stimulation, we observed that overexpression of miR-141-3p significantly improved the levels of phosphorylation of AKT by 2.5-fold, compared with NC treated group (Figure 6F). Furthermore, insulin-stimulated transport of glucose was improved in AML12 treated with miR-141-3p mimic. The spontaneous fluorescence intensity of AML12 cells was 6.98±0.34, the fluorescence intensity of NC- and miR-141-3p mimic-treated group was respectively 47.40±0.40 and 53.93±1.21. Compared with NC treated group, the fluorescence intensity of miR-141-3p mimic treated group was increased 13.9% (Figure 7G). These results verify that the increase of miR-141-3p could enhance insulin sensitivity and glucose uptake of AML12 cells.
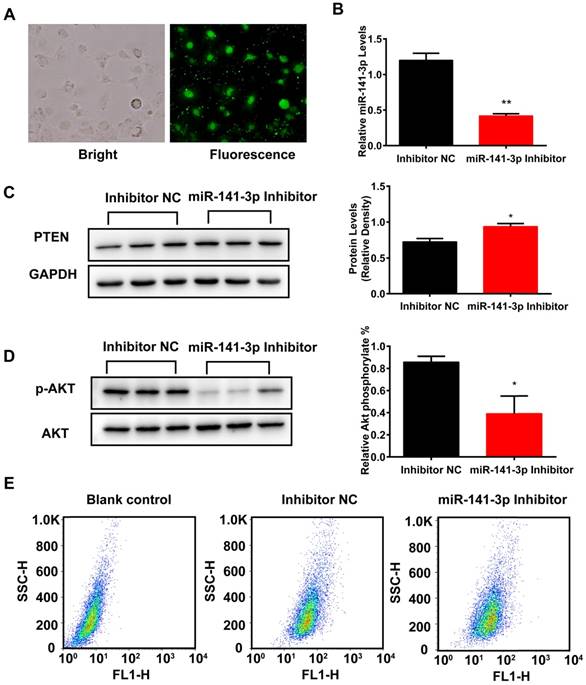
Inhibition of miR-141-3p decreased AML12 cells insulin sensitivity and glucose uptake. (A) AML12 cells were infected with Inhibitor N.C FAM. (B) AML12 cells were infected with miR-141-3p inhibitor or Inhibitor N.C and the miR-141-3p levels were measured with qRT-PCR. U6 RNA was used as an internal control. (C) The protein levels of PTEN was significantly increased in AML12 cells infected with miR-141-3p inhibitor, compared with AML12 cells infective with Inhibitor N.C. (D) Inhibition of miR-141-3p greatly inhibited the levels of phosphorylation of AKT in AML12 cells. (E) Inhibition of miR-141-3p greatly inhibited glucose uptake in AML12 cells. *p<0.05, **p<0.01, miR-141-3p Inhibitor vs NC. n=3 independent experiments. All values were expressed as means ± SD.
Inhibition of miR-141-3p decreased insulin sensitivity and glucose uptake of AML12 cells
To examine the effect of inhibition of miR-141-3p on insulin resistance and glucose uptake in AML12 cells, we infected AML12 cells with microRNA Inhibitor negative control-FAM (miR-Inhibitor-NC-FAM), miR-141-3p Inhibitor or microRNA Inhibitor negative control (Inhibitor NC). MiRNA inhibitors are small, chemically modified single-stranded RNA molecules designed to specifically bind to and inhibit endogenous miRNA molecules and enable miRNA functional analysis by down-regulation of miRNA activity. Transfection efficiency was evaluated by miR-Inhibitor-NC-FAM and qRT-PCR. Fluorescent imaging demonstrated that the miR-141-3p inhibitor became abundant within the cells (Figure 7A). QRT-PCR results revealed that miR-141-3p levels were decreased by 2.9-fold in AML12 cells treated with miR-141-3p Inhibitor, compared with AML12 cells treated with Inhibitor NC (Figure 7B). Western-blotting analysis showed that inhibition of miR-141-3p increased protein levels of PTEN by 1.3-fold, compared with Inhibitor NC-treated group (Figure 7C). Then we detected whether inhibition of miR-141-3p could affect AML12 cells insulin sensitivity and glucose uptake. After insulin stimulation, we observed that the levels of phosphorylation of AKT were decreased by 2.1-fold in the AML12 cells treated with miR-141-3p Inhibitor, compared with AML12 cells treated with Inhibitor NC (Figure 7D). Furthermore, insulin-stimulated transport of glucose was inhibited in AML12 treated with miR-141-3p Inhibitor. The spontaneous fluorescence intensity of AML12 cells was 6.98±0.34, the fluorescence intensity of inhibitor NC- and miR-141-3p Inhibitor-treated group was respectively 48.87±2.20 and 42.30±4.09. The fluorescence intensity of miR-141-3p Inhibitor treated groups was decreased 13.4%, compared with Inhibitor NC-treated group (Figure 7E). These results validate that inhibition of miR-141-3p could decrease insulin sensitivity and glucose uptake of AML12 cells.
Ob-exosomes-mediated inhibitory effects on insulin sensitivity and glucose uptake of AML12 cells are removed by overexpression of miR-141-3p
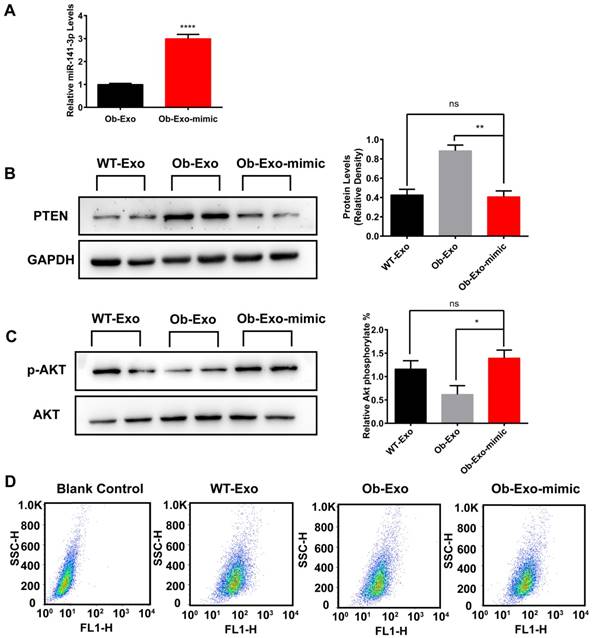
To determine whether the effect of Ob-adipose-derived exosomes on insulin sensitivity and glucose uptake in AML12 cells are associated with miR-141-3p, we overexpressed miR-141-3p in Ob-exosomes by infection with miR-141-3p mimic, and miRNA negative control (NC) was used as a control. QRT-PCR results revealed that miR-141-3p levels were increased 3.0-fold in Ob exosomes infected with miR-141-3p mimic (Ob-Exo-mimic), compared with Ob-exosomes infected with NC (Figure 8A). We treated AML12 cells with WT-exosomes, Ob-Exo-mimic or Ob-exosomes and detected the expression of PTEN, insulin sensitivity and glucose uptake in AML12 cells. We observed that the expression of PTEN was significantly decreased by 2.2-fold in AML12 cells treated with Ob-Exo-mimic, compared with AML12 cells treated with Ob-exosomes (Figure 8B). After insulin stimulation, we observed that the levels of phosphorylation of AKT increased by 2.3-fold in AML12 cells treated with Ob-Exo-mimic, compared with AML12 cells treated with Ob-exosomes (Figure 8C). The spontaneous fluorescence intensity of AML12 cells was 6.69±0.18, the fluorescence intensity of WT-Exosomes-, Ob-Exosomes- and Ob-Exo-mimic-treated group was respectively 55.87±0.58, 40.37±1.20 and 51.70±0.52. The fluorescence intensity of Ob-mimic-Exo-treated group was increased by 28.1%, compared with Ob-exosomes-treated group (Figure 8D). Our results showed that Ob-Exo-mimic actually promoted insulin sensitivity and glucose uptake in AML12 cells, compared with Ob-exosomes-treated group. Hence, these results indicate that exosomes and exosomal miR-141-3p may play important roles in mediating insulin sensitivity and glucose uptake in AML12 cells.
WT-exosome-mediated promoting effects on insulin sensitivity and glucose uptake of AML12 cells are impaired by the knockdown of miR-141-3p
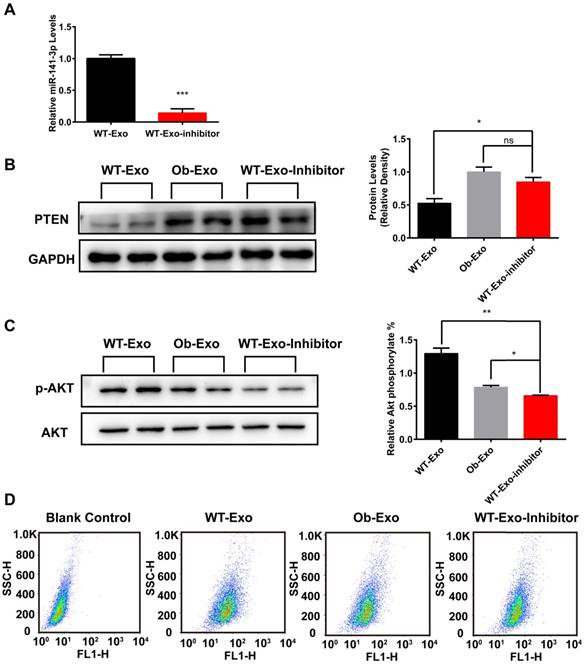
To further demonstrate that exosomes may play important roles in mediating insulin sensitivity and glucose uptake in AML12 cells through exosomal miR-141-3p, we knocked down miR-141-3p levels in WT-exosomes by infection with miR-141-3p inhibitor, and microRNA inhibitor negative control (Inhibitor NC) was used as a control. QRT-PCR results showed that miR-141-3p levels were reduced 6.9-fold in WT exosomes infected with miR-141-3p Inhibitor (WT-Exo-Inhibitor), compared with WT exosomes infected with Inhibitor NC (Figure 9A). Then AML12 cells were treated with WT-Exo-Inhibitor, WT- or Ob-exosomes and the expression of PTEN, insulin sensitivity and glucose uptake in different experimental groups were detected. The results showed that the expression of PTEN was markedly increased by 1.6-fold in the AML12 cells treated with WT-Exo-Inhibitor, compared with AML12 cells treated with WT-exosomes (Figure 9B). After insulin stimulation, the levels of phosphorylation of AKT decreased by 1.9-fold in the AML12 cells treated with WT-Exo-Inhibitor, compared with AML12 cells treated with WT-exosomes (Figure 9C) .The spontaneous fluorescence intensity of AML12 cells was 6.69±0.18, the fluorescence intensity of WT-exosomes-, Ob-exosomes- and WT-inhibitor-Exo-treated group were respectively 55.87±0.58, 40.37±1.20 and 49.03±2.86. The fluorescence intensity of WT-inhibitor-Exo treated group was decreased by 12.2%, compared with WT exosomes treated group (Figure 9D). The results showed compared to WT-exosomes-treated group, miR-141-3p-knocked down WT-exosomes actually impaired insulin sensitivity and glucose uptake of AML12 cells. These data further proved that exosomes and exosomal miR-141-3p may play important roles in mediating insulin sensitivity and glucose uptake.
Ob-exosomes-mediated inhibitory effects on AML12 cells insulin sensitivity and glucose uptake are removed by overexpression of miR-141-3p. (A) Ob-exosomes were infected with miR-141-3p mimic, and the miR-141-3p levels were measured with qRT-PCR. (B) AML12 cells were infected with WT-exosomes, Ob-exosomes and Ob-Exo-mimic. The Ob-Exo-mimic treated group significant inhibited the expression of PTEN, but promoted phosphorylation of AKT (C) and glucose uptake (D), compared to Ob exosomes treated group. *p<0.05, **p<0.01, ****p < 0.0001, Ob-Exo vs Ob-Exo-mimic; ns: not significant, WT-Exo vs Ob-Exo-mimic. n=3 independent experiments. All values were expressed as means ± SD.
Materials and Methods
Animals and AML12 cells
Some C57BL/6j (B6) male mice were fed high-fat diets (HFD) and others were fed standard diets for 3 months. One-month male C57BL/6j (B6) mice and male B6 ob/ob mice (B6.VLepob/J) were purchased from BEIJING HFK BIOSCIENCE CO., LTD. All animal experiments are based on the agreement approved by Jinan University. The normal mouse hepatocyte cell line AML12 were purchased from the Type Culture Collection of the Chinese Academy of Sciences, Shanghai, China. AML12 were cultured in Complete Growth Medium (DMEM/F12 with 0.005 mg/ml transferrin, 0.005 mg/ml insulin, 40 ng/ml dexamethasone, 5 ng/ml selenium, and 10% fetal bovine serum).
Isolation and characterization of exosomes
In order to separate the exosomes, visceral adipose tissue of 4-month-old mice was washed by PBS three times and cut into small pieces, the pieces was less than 3mm, then transferred the pieces to six-well plates containing 3ml/well DMEM/F12 (Gibco) supplemented with Penicillin-Streptomycin (Gibco) and 10% fetal bovine serum with exosomes depleted for 12 hours in a 37℃ cell incubator. The cultured supernatants were collected on ice, then centrifuged at 500g for 10min to remove floating cells. Collecting supernatants and centrifuged at 2000g for 10min to remove dead cells and then at 10000g for 40min to remove cell debris. Supernatants were filtered through 0.22 μm membrane and concentrated by using a protein concentrator with a 100-kDa cutoff (Amicon). Finally, ExoQuick kit (System Biosciences) was used to extract exosomes from the concentrated supernatants.
WT-exosomes mediated positive impact on AML12 cells insulin sensitivity and glucose uptake are impaired by knockdown of miR-141-3p. (A) WT-exosomes were infected with miR-141-3p inhibitor, and the miR-141-3p levels were measured with qRT-PCR. ***p < 0.001, WT-Exo-Inhibitor vs WT-exosomes. (B) AML12 cells were infected with WT-exosomes, Ob-exosomes, and WT-Exo-inhibitor. The expression of PTEN in WT-Exo-Inhibitor treated group was significant increased compared with WT-exosomes-treated group. *p<0.05, WT-Exo-Inhibitor vs WT-Exo; ns: not significant, WT-Exo-Inhibitor vs Ob-Exo. (C) The Phosphorylation of AKT was reduced in WT-Exo-Inhibitor-treated group compared with WT-exosomes treated group. **p<0.01, WT-Exo-Inhibitor vs WT-Exo; *p<0.05, WT-Exo-Inhibitor vs Ob-Exo. (D)The glucose uptake in WT-Exo-Inhibitor-treated group was reduced compared with WT-exosomes-treated group. n=3 independent experiments. All values were expressed as means ± SD.
Exosomes were evaluated through quality the total protein by BCA assay (invitrogen). The size distribution of exosomes was measured with Nanosight instrument.
According to the approach of Tanaka et al (23), electron microscopy was done. The exosomes were dissolved in PBS buffer, and placed a drop of suspension on a layer of parafilm, then floated a carbon-coated copper grid on the drop for 10 seconds. The grid was moved to a drop of phosphotungstic acid for 5 seconds. Drying the grid for 5 minutes and then examined by using a Transmission Electron Microscopy (Philips) at 80 kiloelectron volts.
Western blot analysis
Exosomes and cells lysed with RIPA buffer (Beyotime Biotechnology). Lysate was centrifuged at 14,000g for 30 min. Supernatant fraction was used for western blot. 2ug/ml protein were subject to SDS-PAGE. Antibodies: rabbit anti-CD9 (abcam, 1:1000 dilution), rabbit anti-CD63 (abcam, 1:1000 dilution), rabbit anti-CD81 (abcam, 1:1000 dilution), rabbit anti-AKT (CST, 1:1000 dilution), rabbit anti-P-AKT (CST, 1:1000 dilution), and rabbit anti-PTEN (CST, 1:1000 dilution). Rabbit anti-GAPDH (CST, 1:1000 dilution) used as an internal control.
Exosome labeling
Exosomes were labeled using the PKH26 Red Fluorescent Cell Linker Kit (Sigma-Aldrich). Exosomes were added to 75ul Diluent C. In parallel, 1ul PKH26 dye was added to 75ul Diluent C and incubated with the exosome solution for 5 minutes. To bind excess dye, 150ul 1% BSA was added. Exosome Spin Columns (Invitrogen) were used for fast removal of unincorporated dye from labeled exosome preparations. AML12 cells were cultured in media containing PKH26 exosomes. Cells were fixed and stained for nuclei (DAPI, blue) and images were taken under a confocal microscope (Zeiss LSM 700, Jena, Germany).
Stimulation of cells with exosomes and insulin
AML12 cells were cultured into 6-well plates at an initial density of 105 cells/well containing 2ml/well Complete Growth Medium. Once 60% confluency was attained, the AML12 cells culture medium was replaced with complete growth medium without serum supplemented with exosomes, or PBS buffer. The amount of exosomes used to stimulate AML12 cells was 10ug/ml. After 48 hour incubation, the cells were stimulated with insulin (100 nM) for 20 min at 37°C. The cell lysate (20 μg/lane) was used for western blot analysis of AKT activation.
Glucose uptake assay
AML12 cells were cultured into 6-well plates at an initial density of 105 cells/well containing 2ml/well Complete Growth Medium. Once 60% confluency was attained, the AML12 cells culture medium was replaced with Complete Growth Medium without serum supplemented with exosomes or PBS buffer. The amount of exosomes used to stimulate AML12 cells was 10ug/ml. After 48 hour incubation, the cells were washed in Krebs-Ringer phosphate (KRP) buffer (Leagene), and incubated at 37 °C for 30 min in 2ml KRP with 100nM insulin and 100ug/ml 2-NBDG. Then washing the cells thrice with KRP. 2-NBDG has not been used in blank control. Fluorescence intensity of each group of 10000 cells was detected by FACS calibur (BD Biosciences).
MiRNAs sequencing data analysis
Total RNA was isolated from Ob-exosomes, HFD exosomes and WT exosomes. The amount and section distribution of the RNA was detected by Agilent 2100 pic600. The amount of total RNA per sample was 3ug as the input material for the small RNA library. Library quality was assessed on the Agilent Bioanalyzer 2100 system. The library were sequenced using an Illumina Hiseq 2500/2000 platform. Differential expression analysis of two samples was performed using the DEGseq (2010) R package. P-value was adjusted using qvalue(24). Qvalue <0.01 and |log2 (fold change)|>1 was set as the threshold for significantly differential expression by default. Using TargetScan and miRanda to predict the target gene of miRNA. Gene Ontology (GO) analysis was carried out to classify the target genes' function using GOseq (25). Using KOBAS (26) software to examine the candidate target genes' statistical enrichment in KEGG pathways. We constructed miRNAs-gene-networks to screen the connection between the selected miRNAs and their target genes using Cytoscape (27).
Verification of miRNA levels by quantitative real-time PCR
According to the manufacturer's protocol, total RNA was extracted from exosomes, mice liver tissue and exosome-treated AML12 cells as well as their respective controls, using the RNAiso Plus (TaKaRa). RNA concentration was determined by the NanoDrop. The reverse-transcription was implemented using the Mir-X miRNA First-Strand Synthesis (TaKaRa). Quantitative real-time PCR (qRT-PCR) was performed using SYBR® Premix Ex Taq™ II (TaKaRa) in the CFX96 Real-Time PCR Detection System (Bio-Rad). Samples were run in triplicate. MiRNA expression levels on AML12 cells were using U6 as an internal control. Using the Caenorhabditis elegans (C. elegans) miR-39 miRNA mimic (RIBOBIO) as a spike-in control for miRNA extracted from exosomes because U6 RNA may not be stabilized within exosomes. 10-3pmol cel-miR-39 was directly added in per μg exosomal RNA when total RNA was extracted from exosomes and quantified by Nanodrop. The cDNA synthesis reaction parameters was at 37°C for 1 hour, then terminate 5 min at 85°C to inactivate the enzymes. The Real time PCR condition was 30 second at 95 °C, followed by 40 cycles of 95°C for 5 second and 60 °C for 30 second. MiRNA relative expression was calculated using the Bio-Rad CFX Manager 3.0. The PCR forward primer for mmu-miR-431-5p: TGTCTTGCAGGCCGTCATG, mmu-miR-351-5p: GAGGAGCCCTTTGAGCCTG, mmu-miR-449a-5p: GGCAGTGTATTGTTAGCTGGT, mmu-miR-3064-5p: TGGCTGTTGTGGTGTGCAAA, mmu-miR-874-3p: CTGGCCCGAGGGACCGAA, mmu-miR-15b-5p: TAGCAGCACATCATGGTTTACA, mmu-miR-141-3p: TAACACTGTCTGGTAAAGATGG, mmu-miR-299a-5p: GGTTTACCGTCCCACATACAT, mmu-miR-151-5p: CGAGGAGCTCACAGTCTAGT, mmu-miR-135b-5p: TATGGAGCTTTTCATTCCTATGTGA, cel-miR-39-3p: CGGGTGTAAATCAGCTTGAAA. The stem-loop RT primer for these miRNA was mRQ 3' Primer (TaKaRa). U6 reverse primer: 5′-GTGCAGGGTCCGAGGT-3′; U6 forward primer: 5′-CTCGCTTCGGCAGCACA-3′.
AML12 cells /Adipose tissue co-culture
Using a double-chamber co-culture system to performed AML12 cells/Adipose tissue co-culture. Cutting adipose tissue into small pieces which was cultured in the upper chamber with a 0.4 μm pore size membrane (6-well insert, Corning), AML12 cells were cultured in the lower chamber. After 48 h co-culture, the lower chamber AML12 cells were collected to measure miR-141-3p levels. The tissue was treated with GW-4869 (10μM, Sigma-Aldrich) for 48 h to block exosomes released from adipose tissue (22).
Luciferase assay
The single purification wild-type or mutant 3'-UTR seeding region sequence of PTEN was transfected into pGL3 reporter (Transgen Biotech). Then the 50 nM miR-141-3p inhibitor or mimic were co-transfected into AML12 cells by lipofectamine 3000 (Invitrogen). TransDetect Double-Luciferase Reporter Assay Kit (Transgen Biotech) was used to detect luciferase activity following transfection for 24 h.
Overexpression/inhibition of miR-141-3p in AML12 cells
For overexpression or inhibition of miR-141-3p in AML12 cells. Seeded cells to be 60% confluent at transfection in 6-well, diluted 4ul Lipofectamine RNAiMAX Reagent (Invitrogen) in 500ul Opti-MEM Medium (Gibco) and diluted 4ul (80 pmol) miR-141-3p mimic/miR-141-3p inhibitor (Gene Pharma) in 500ul Opti-MEM Medium, microRNA Negative Control/ microRNA inhibitor N.C (Gene Pharma) was used as a control. Add diluted miR-141-3p mimic/miR-141-3p inhibitor to diluted Lipofectamine RNAiMAX Reagent (1:1 ration) and incubated for 20 min. Then add the siRNA-lipid complex to the cells. After incubated for 48h, cells were collected for insulin sensitivity assay and glucose uptake assay, as described above.
Overexpression/inhibition of miR-141-3p in exosomes
Diluted 4ul Lipofectamine RNAiMAX Reagent (invitrogen) in 500ul Opti-MEM Medium (Gibco) and diluted 4ul (80 pmol) miR-141-3p mimic/miR-141-3p inhibitor (Gene Pharma) in 500ul Opti-MEM Medium, microRNA Negative Control/ microRNA inhibitor N.C (Gene Pharma) was used as a control. Add diluted miR-141-3p mimic/miR-141-3p inhibitor to diluted Lipofectamine RNAiMAX Reagent (1:1 ration) and incubated for 20 min. Then add the siRNA-lipid complex to the Ob-exosomes/WT-exosomes. After incubated for 6h at 37℃, ExoQuick kit (System Biosciences) was used to extract exosomes. The transfected exosomes were used for insulin sensitivity assay and glucose uptake assay, as described above.
Statistical analysis
Quantitative results are presented as mean ± SD of at least 3 independent experiments. Statistical analysis was performed using SPSS19.0 and GraphPad Prism 6 software. When only two parameters were evaluated, we used Student's t test for comparisons. Statistical differences among groups were determined by multiple t tests. P values < 0.05 were considered significant.
Ethics statement
The animal experiments were performed after getting approval from the Laboratory Animal Ethics Committee of JiNan University. Animal welfare and experimental procedures were carried out in accordance with the Guide for the Care and Use of Laboratory Animals (Ministry of Science and Technology of China, 2006) and related ethical regulations of JiNan University.
Discussion
In this study, we have observed that exosomes released from adipose tissue of ob/ob mice can directly interfere with insulin signal transduction in hepatic cells. Furthermore, we have detected our exosomal miRNAs through the Next Generation Sequencing. Compared with WT-exosomes miRNA, Ob-exosomes have 99 miRNAs were upregulated and 175 miRNAs were downregulated, HFD-exosomes have 100 miRNAs were upregulated and 110 miRNAs were downregulated. We used the GO terms and KEGG enrichment to find potential functions to the miRNA targets. The most significant biological function was the “metabolic process” and there were 20 pathways were significant enrichment including Insulin signaling pathway. Ten of these miRNAs were confirmed by qRT-PCR. The exposure of AML12 cells to Ob exosomes resulted in a decreased fold change in miR-141-3p and miR-351-5p, compared to WT exosomes. Indeed, our data indicated that decreased miR-141-3p inhibited the phosphorylation of AKT by increasing negative regulation of PTEN expression. Our findings may provide a novel molecular mechanism of the obese-caused hepatic cells insulin resistance.
The main pathophysiological abnormality of type 2 diabetes is due to the insulin resistance in target tissue and pancreatic β-cell dysfunction (28). β-cell hyperplasia and hyperinsulinemia in response to insulin resistance occur in the preclinical stage of the disease (29). Relative insulin deficiency as a consequence of failure of β-cells to compensate for insulin resistance, progresses into overt type 2 diabetes (29). At present the etiology of type 2 diabetes is not clear, but it is related to some factors such as obesity, an unreasonable diet, lack of exercise, a family history of diabetes. Despite a number of factors (i.e. tumor necrosis factor alpha (TNF-α), interleukin-6 (IL-6), leptin and adiponectin and others) that may be involved in insulin resistance, the local microenvironment of each insulin sensitive organ also plays a pivotal role in the insulin sensitivity. Indeed, our data indicate that obesity ob/ob mice's adipose tissue secrete miR-141-3p deficiency exosomes, which can be taken up by hepatocytes and inhibit insulin function (Figure 10). Significantly, the transport of miR-141-3p from adipose tissue to hepatocytes relies on exosomes, indicating their crucial role in cell to cell communication. MiR-141-3p has been predicted to target insulin resistance related gene Pten. The present study showed that miR-141-3p delivered from adipose tissue exosomes possessed important functions in hepatocytes, mainly, Pten acting as miR-141-3p target gene was upregulated when AML12 cells were treated with Ob-exosomes, which resulted in the decrease of phosphorylation of AKT and glucose uptake. Therefore, miR-141-3p transferred from adipose tissue into hepatocytes should be one of the important extracellular signaling molecules that regulated insulin resistance and function in liver.
Proposed scheme for the absorption of exosomes released from obesity adipose tissue containing lower level of miR-141-3p than healthy adipose tissue into hepatocytes can significantly inhibit the insulin sensitivity and glucose uptake.
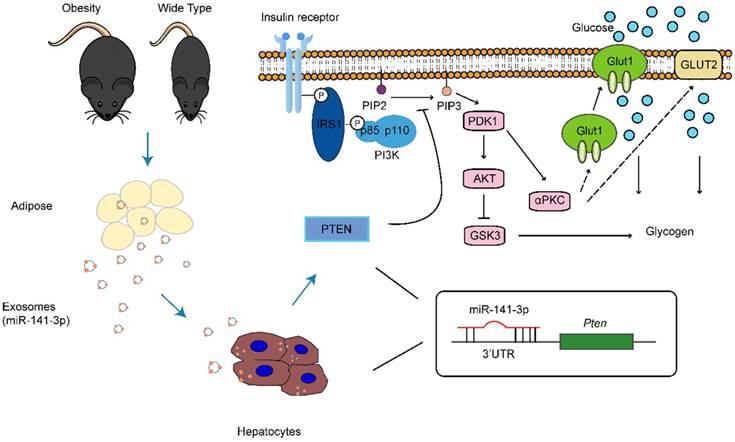
Unlike insulin resistance effects of Ob-exosomes, healthy adipose tissue-derived exosomes (WT-exosomes) promote the phosphorylation of AKT and glucose uptake. Thus, healthy adipose tissue maybe can maintain normal liver insulin sensitivity and function through transferring exosomal miRNAs/proteins. Obesity conditions may cause adipose tissue to dispense a specific set of miRNAs/proteins into exosomes, which can communicate with hepatocytes and result in insulin resistance. Of course, the miRNAs and proteins in exosomes may be dynamic and dependent on physiological conditions of cells/tissue. Furthermore, previous research has shown that the injection of exosomes released from the adipose tissue of ob/ob mice into wide-type mice led to the development of glucose intolerance and insulin resistance, whereas this didn't happen in the injection of exosomes released from the adipose tissue of wide-type mice (9). Therefore, exosomal contents derived from adipose tissue may serve as useful biomarkers for diagnosis of human metabolism disease.
Given that adipose tissue in obese mice releases “noxious” exosomes, altering the secretion of exosomes from adipose should be a potential method of treating diabetes. Hence, the ideal strategy for improving insulin sensitivity in obese liver may use bioengineering techniques to construct exosomes that contain miRNAs or proteins that can improve insulin sensitivity, which needs further investigation in future studies.
In summary, our findings demonstrate a mechanism underlying insulin resistance in obesity that has never been discovered before. Exosomes released from obesity adipose tissue inhibit hepatocytes insulin sensitivity and glucose uptake through the transfer of less miR-141-3p than normal into hepatocytes. Our research may provide a new way of thinking about the treatment of obesity causing insulin resistance.
Supplementary Material
Supplementary figure.
Acknowledgements
This work was supported by grants from the National Natural Science Foundation of China (No 81373314, 81741130), the Natural Science Foundation of Guangdong Province, China (No 2015A030313333), Guangzhou Municipal Science and Technology Program (No 201707010245, 201704020117).
Author contributions
Conception and design: Yi Ma, An Hong, Shi-Ying Dang.
Development of methodology: Shi-Ying Dang, Yang Leng, Xin Zhang.
Acquisition of data: Shi-Ying Dang, Yang Leng, Tao Wen, Hui-Zhen Gong, Zi-Xian Wang.
Analysis and interpretation of data (e.g, statistical analysis, biostatistics, computational analysis): Shi-Ying Dang, Yang Leng, Xing Xiao.
Writing, review, and/or revision of the manuscript: Shi-Ying Dang, Yang Leng, Yi Ma, An Hong.
Study supervision: An Hong, Yi Ma, Xin Zhang.
Competing Interests
The authors have declared that no competing interest exists.
References
1. Kahn BB FJ. Obesity and insulin resistance. The Journal of Clinical Investigation. 2000;106(4):473-481
2. Juhan-Vague I AM, Vague P. Increased plasma plasminogen activator inhibitor 1 levels. A possible link between insulin resistance and atherothrombosis. Diabetologia. 1991;34(7):457-462
3. Yu-chengWang. Circulating miR-130b mediates metabolic crosstalk between fat and muscle in overweight/obesity. Diabetologia. 2013;56(10):2275-2285
4. Fox CS, Massaro JM, Hoffmann U, Pou KM, Maurovich-Horvat P, Liu CY, Vasan RS, Murabito JM, Meigs JB, Cupples LA, D'Agostino RB Sr, O'Donnell CJ. Abdominal visceral and subcutaneous adipose tissue compartments: association with metabolic risk factors in the Framingham Heart Study. Circulation. 2007;116(1):39-48
5. Kanhai DA, Kappelle LJ, van der Graaf Y, Uiterwaal CS, Visseren FL, Group SS. The risk of general and abdominal adiposity in the occurrence of new vascular events and mortality in patients with various manifestations of vascular disease. Int J Obes (Lond). 2012;36(5):695-702
6. Senn JJ KP, Nowak IA, Mooney RA. Interleukin-6 Induces Cellular Insulin Resistance in Hepatocytes. Diabetes. 2002;51(12):3391-3399
7. Angulo P, Alba LM, Petrovic LM, Adams LA, Lindor KD, Jensen MD. Leptin, insulin resistance, and liver fibrosis in human nonalcoholic fatty liver disease. J Hepatol. 2004;41(6):943-949
8. Hotamisligil GS SN, Spiegelman BM. Adipose expression of tumor necrosis factor-alpha: direct role in obesity-linked insulin resistance. Science. 1993;259:87-91
9. Deng ZB, Poliakov A, Hardy RW, Clements R, Liu C, Liu Y, Wang J, Xiang X, Zhang S, Zhuang X, Shah SV, Sun D, Michalek S, Grizzle WE, Garvey T. et al. Adipose tissue exosome-like vesicles mediate activation of macrophage-induced insulin resistance. Diabetes. 2009;58(11):2498-2505
10. Thomou T, Mori MA, Dreyfuss JM, Konishi M, Sakaguchi M, Wolfrum C, Rao TN, Winnay JN, Garcia-Martin R, Grinspoon SK, Gorden P, Kahn CR. Adipose-derived circulating miRNAs regulate gene expression in other tissues. Nature. 2017;542(7642):450-455
11. Lawson C, Vicencio JM, Yellon DM, Davidson SM. Microvesicles and exosomes: new players in metabolic and cardiovascular disease. J Endocrinol. 2016;228(2):R57-71
12. Rana S, Zoller M. Exosome target cell selection and the importance of exosomal tetraspanins: a hypothesis. Biochem Soc Trans. 2011;39(2):559-562
13. Vlassov AV, Magdaleno S, Setterquist R, Conrad R. Exosomes: current knowledge of their composition, biological functions, and diagnostic and therapeutic potentials. Biochim Biophys Acta. 2012;1820(7):940-948
14. Oh K KS, Kim DK. et al. In Vivo Differentiation of Therapeutic Insulin-Producing Cells from Bone Marrow Cells via Extracellular Vesicle-Mimetic Nanovesicles. acsnano. 2015;9(12):11718-11727
15. Wang X, Huang W, Liu G, Cai W, Millard RW, Wang Y, Chang J, Peng T, Fan GC. Cardiomyocytes mediate anti-angiogenesis in type 2 diabetic rats through the exosomal transfer of miR-320 into endothelial cells. J Mol Cell Cardiol. 2014;74:139-150
16. Wu L, Zhang X, Zhang B, Shi H, Yuan X, Sun Y, Pan Z, Qian H, Xu W. Exosomes derived from gastric cancer cells activate NF-kappaB pathway in macrophages to promote cancer progression. Tumour Biol. 2016;37(9):12169-12180
17. Lages E IH, Guttin A, Nesr H, Berger F, Issartel JP. MicroRNAs: molecular features and role in cancer. Front Biosci. 2013;17:2508-2540
18. Dehwah MA, Xu A, Huang Q. MicroRNAs and type 2 diabetes/obesity. J Genet Genomics. 2012;39(1):11-18
19. Banerjee J, Nema V, Dhas Y, Mishra N. Role of MicroRNAs in Type 2 Diabetes and Associated Vascular Complications. Biochimie. 2017;139:9-19
20. Granjon A, Gustin MP, Rieusset J, Lefai E, Meugnier E, Guller I, Cerutti C, Paultre C, Disse E, Rabasa-Lhoret R, Laville M, Vidal H, Rome S. The microRNA signature in response to insulin reveals its implication in the transcriptional action of insulin in human skeletal muscle and the role of a sterol regulatory element-binding protein-1c/myocyte enhancer factor 2C pathway. Diabetes. 2009;58(11):2555-2564
21. Herrera BM LH, Taylor JM, Ria M, Barrett A, Collins S. et al. Global microRNA expression profiles in insulin target tissues in a spontaneous rat model of type 2 diabetes. Diabetologia. 2010;53(6):1099-1109
22. Kosaka N, Iguchi H, Yoshioka Y, Takeshita F, Matsuki Y, Ochiya T. Secretory mechanisms and intercellular transfer of microRNAs in living cells. J Biol Chem. 2010;285(23):17442-17452
23. Tanaka Y, Kamohara H, Kinoshita K, Kurashige J, Ishimoto T, Iwatsuki M, Watanabe M, Baba H. Clinical impact of serum exosomal microRNA-21 as a clinical biomarker in human esophageal squamous cell carcinoma. Cancer. 2013;119(6):1159-1167
24. Storey JD. The positive false discovery rate: A Bayesian interpretation and the q-value. Annals of Statistics. 2003;31(6):2013-2035
25. Young MD, Wakefield MJ, Smyth GK, Oshlack A. Gene ontology analysis for RNA-seq: accounting for selection bias. Genome Biol. 2010;11(2):R14
26. Mao X, Cai T, Olyarchuk JG, Wei L. Automated genome annotation and pathway identification using the KEGG orthology (KO) as a controlled vocabulary. Bioinformatics. 2005;21(19):3787-3793
27. Doerks T, Copley RR, Schultz J, Ponting CP, Bork P. Systematic identification of novel protein domain families associated with nuclear functions. Genome Res. 2002;12(1):47-56
28. Halban PA, Polonsky KS, Bowden DW, Hawkins MA, Ling C, Mather KJ, Powers AC, Rhodes CJ, Sussel L, Weir GC. beta-cell failure in type 2 diabetes: postulated mechanisms and prospects for prevention and treatment. J Clin Endocrinol Metab. 2014;99(6):1983-1992
29. Hameed I, Masoodi SR, Mir SA, Nabi M, Ghazanfar K, Ganai BA. Type 2 diabetes mellitus: From a metabolic disorder to an inflammatory condition. World J Diabetes. 2015;6(4):598-612
Author contact
![]() Corresponding authors: An Hong; Yi Ma: Institute of Biomedicine, Department of Cellular Biology, Jinan University, 601 Huangpu Ave West, Guangzhou 510632, Guangdong, People's Republic of China; tmayiedu.cn; thaedu.cn; Tel.+86 20 8522 1983; Fax.+86 20 8522 1983.
Corresponding authors: An Hong; Yi Ma: Institute of Biomedicine, Department of Cellular Biology, Jinan University, 601 Huangpu Ave West, Guangzhou 510632, Guangdong, People's Republic of China; tmayiedu.cn; thaedu.cn; Tel.+86 20 8522 1983; Fax.+86 20 8522 1983.

 Global reach, higher impact