Impact Factor ISSN: 1449-2288

 Global reach, higher impact
Int J Biol Sci 2019; 15(6):1310-1324. doi:10.7150/ijbs.32987 This issue Cite
Research Paper
CSN6 Promotes the Migration and Invasion of Cervical Cancer Cells by Inhibiting Autophagic Degradation of Cathepsin L
Zun Mao1*, Miao-Miao Sang2*, Cheng Chen1*, Wen-Tao Zhu1, Yu-Sen Gong1 ![]() , Dong‑Sheng Pei1
, Dong‑Sheng Pei1 ![]()
1. Laboratory of Clinical and Experimental Pathology, Xuzhou Medical University, Xuzhou 221004, Jiangsu, China
2. Department of Rehabilitation, The Affiliated Hospital of Xuzhou Medical University, Xuzhou 221002, China
*These authors contributed equally.
Received 2019-1-10; Accepted 2019-3-13; Published 2019-5-12
Abstract

CSN6 is one subunit of the highly conserved constitutive photomorphogenesis 9 (COP9) signalosome (CSN), which is overexpressed in many types of cancers, and has received great attention as a regulator of the degradation of cancer-related proteins, suggesting its importance in oncogenic activity. CSN6 has been shown to be overexpressed in cervical cancer (CC) and associated with CC development. CC remains to be one of the most aggressive cancers affecting women. Cathepsin L (CTSL), significantly associated with the autophagy, plays a critical role in degradation of extracellular matrix for metastasis. However, the detailed biological functions of CSN6 on CTSL in CC metastasis have not been well clarified. Our data has shown that CSN6 and CTSL are positively correlated. The overexpression of CSN6 and CTSL might be a strong indicator for CC enhanced aggressiveness. CSN6 could suppress the degradation of CTSL, then facilitated the migration and invasion of CC cells. Interestingly, our results indicated that autophagy is essential for decreasing CTSL, while CSN6 could inhibit the autophagy ability of CC cells. In addition, blocking of the mammalian target of rapamycin (mTOR) pathway reversed CSN6-mediated autophagy inhibition. We further demonstrated that CSN6 positively regulated CTSL expression through an autophagy-lysosomal system. Taken together, we concluded that CSN6 might promote the migration and invasion of cervical cancer cells by inhibiting autophagic degradation of CTSL and serve as a potential gene therapy target for the treatment of CC metastasis.
Keywords: CSN6, autophagy, CTSL, metastasis, cervical cancer
Introduction
CSN, composed of nine subunits [1], is known to regulate the ubiquitin-proteasome system (UPS) and macroautophagy (autophagy hereafter) [2-4]. CSN6, a critical subunit of the CSN, is found to be overexpressed in many types of cancers [5]. More importantly, UPS and autophagy are pivotal for regulate protein degradation in the cell. In addition, an increasing number of evidence suggests that CSN6 has received attention as a regulator of the degradation of cancer-related proteins through the UPS, suggesting its importance in cancerogenesis, consisting of cell proliferation [6, 7], metastasis [8, 9] and apoptosis [10, 11]. However, very little is known about the role of CSN6 on autophagy. Autophagy is enclosed in the double-membrane autophagosomes and delivered to lysosomes for degradation of cell components and the recycling of cellular construction [12], and its dysfunction has been implicated in many human cancer [13]. The modulation of autophagy plays dual roles in tumor promotion and suppression in many cancers [14]. Autophagy has emerged as a critical role for the biological behavior of CC [15-17], which remains to be one of the most aggressive cancers affecting women [18]. The activation of invasion and metastasis are the main causes for treatment failure and mortality in CC patients [19]. Therefore, the suppression of tumor metastasis is an effective forms of therapy for CC.
Lysosomes and lysosomal hydrolases, including the Cathepsin family, have been shown closely associated with intracellular protein degradation and processing [20]. Cathepsin family, highly expressed in cancer cells, play a vital role in triggering tumor proliferation, invasion, metastasis and angiogenesis [21, 22]. Cathepsin L (CTSL), a key member of the Cathepsin family of cysteine proteases, eventually stored in lysosomes as mature CTSL, has been shown to play a critical role in degradation of extracellular matrix for metastasis [23, 24]. It has been concluded that lysosomal proteases CTSL can be involved in the execution of autophagy [25]. Previous study showed that the enhancement of CTSL activity is necessary for the progress of autophagy [26-28]. However, the mechanism of how autophagy regulates lysosomal cysteine protease CTSL remains unclear. Therefore, understanding the relationship between autophagy and CTSL is critical to develop treating strategy for CC patients.
In this study, we verified CSN6 and CTSL levels in CC tissues and explored the involvement of CTSL in CSN6-mediated metastasis. We found that both CSN6 and CTSL were positively correlated with the aggressiveness of CC. In addition, CSN6 could up-regulate the expression of CTSL by inhibiting autophagy, thereby promoting the migration and invasion of CC cells. Our data provided a profound understanding of novel CSN6-CTSLsignaling in promoting CC metastasis.
Materials and Methods
Patients and tissue specimens
The study was conducted in accordance to local ethical guidelines. CC tissues and paracancerous tissues were collected from the Department of Pathology, The Affiliated Hospital of Xuzhou Medical University. The validation cohort tissue microarray (TMA) included 126 cases of CC tissues and 42 cases of paracancerous tissues. It consisted of 126 surgical cases from 2010 to 2011, termly followed up for 8 months to 86 months to assess the survival. Detailed clinical information of individual specimen was pathologically confirmed. The studies using human cervix tissue samples were approved by Xuzhou Human Subject Committee. Informed consent from the patients was obtained in all cases.
Immunohistochemistry of tissue microarray
After being baked at 65°C for 1h, TMA slides were dewaxed with dimethylbenzene and then rehydrated with graded alcohol and distilled water. For retrieving antigen, TMA slides were performed in a microwave oven heated at 95°C with 10 mM citrate buffer (pH 6.0). Endogenous peroxidases were quenched by 3% H2O2 for 20min. The slides were treated with normal goat serum to inhibit nonspecific staining, then the sections incubated with mouse monoclonal antibodies CSN6 and CTSL (1:50 dilution, Santa Cruz Biotechnology, USA) at 4°C overnight and then were incubated with a secondary antibody for 1h. Diaminobenzidine (DAB; Zhongshan biotech, Beijing, China) was used to produce a brown precipitate. After hematoxylin counterstain and dehydration were completed, the sections were sealed. The staining of the normal cervix tissues in each microarray slide was evaluated as the quality control of the immunostaining. Immunohistochemistry of TMA was assessed by microscopy (ZEISS AXIO Scope.A1 HAL100). The staining intensity and percentage of positive tumor cells of each section was calculated by the immunoreactive score (IRS) [29]. Staining patterns were classified as low (IRS: 0-4) and high (IRS: 6-12) protein expression of CSN6 or CTSL.
Cell lines and growth condition
Human normal cervical epithelial cells (NCECs) and CC cell lines MS751, Caski, HeLa, C33A and SiHa were purchased from the Institute of Biochemistry and Cell Biology, Chinese Academy of Sciences (Shanghai, China). NCECs were cultured as previously described [29]. MS751 and CaSki cells were cultured in RPMI 1640 (Gibco, Grand Island, NY, USA), and HeLa, C33A and SiHa cells were cultured in DMEM/F-12 medium (Hyclone) supplemented with 10% fetal bovine serum (FBS) (Invitrogen, Shanghai). Cells were incubated at 37 °C in a humidified atmosphere of 5% CO2.
Transfection and stable cell lines generation
The plasmids of pcDNA3.1-Vector (Vector), pcDNA3.1-CSN6, pcDNA3.1-CTSL and HA-ubiquitin (Gene-Pharma Shanghai, China) were transiently transfected into cervical cancer cells at 70% confluence using X-tremeGENE HP DNA Transfection Reagent (Roche, Switzerland) following the manufacturer's instructions. The small interfering RNA (siRNA) control (siCtrl), CSN6 siRNA (siCSN6) were designed and purchased from Gene-Pharma. CTSL siRNA (siCTSL) was purchased from Santa Cruz Biotechnology. They were transfected into cells using siLentFectTM Lipid Reagent (Bio-Rad, Hercules, CA, USA) according to the manufacturer's protocol. After 24 h or 48 h of transfection, cells were harvested for subsequent experiments.
Western blot
Cells were harvested from the plates. After digestion and centrifugation, total cell proteins were extracted from the cells using RIPA lysis method. Then, 100 μg proteins were applied onto 10% SDS- polyacrylamide gel (SDS-PAGE) for electrophoresis and then transferred onto nitrocellulose membrane. After blocking for 2 h, members were incubated overnight at 4°C with the antibodies (CSN6, 1:2 000; mTOR, 1:500 dilution, Proteintech Group, USA; Microtubule-associated protein light-chain 3 (LC3), 1:2 000 dilution, Cell Signaling Technology, USA; Sequestosome 1 (SQSTM1/p62), 1:2 000 dilution, Cell Signaling Technology, USA; CTSL, 1:300 dilution, Santa Cruz Biotechnology, USA; β-actin, 1:2 000 dilution, Zhong-shan biotech, China). After washed, the secondary antibody was added to incubate at room temperature for 2 h prior to ECL (Tanon, Shanghai, China) fuorescence imaging.
Cell proliferation assay
Cells were seeded into 96-well culture plates (Corning Incorporated, Corning, NY, USA) at a density of 4 × 10³ cells each well after transfection. Cell proliferation was determined with the colorimetric water-soluble tetrazolium salt (CCK8, Vicmed, China) at time points 1d, 2d and 3d according to the manufacturer's instructions. 100 μl serum-free culture medium and 10 μl CCK-8 solution were added into per well, then incubation at 37°C for 2h. The absorbance of individual wells was measured at 450 nm using a Multiskan Spectrum 1500 (Thermo Labsystems, USA).
Wound-healing assay
After transfection with siCSN6 and CSN6 plasmids, the CC cells were seeded in 6-well plates (Corning Incorporated). The cells were scratched with a yellow pipette tip along the center of the plate when cell culture reached about 95% confluence. The distance between the cells bordering the wound was measured at 0 and 24 h, and analyzed by the microscopy (Olympus IX71, Tokyo, Japan). Images of the wound were taken with a digital camera.
Migration assay
Transwell chambers (BD Bioscience, San Jose, CA, USA) with a pore size of 8 μm was used to determine cell migration. 6 × 10³ CC cells were seeded in serum-free medium in the upper chamber. The medium containing 10% FBS was added to the lower chamber. After incubating at 37°C for 24h, the cells were fixed in methanol and stained with Leucocrystal Violet. Cells in upper chamber were removed and the number of cells which traversed the membrane was determined by counting the Leucocrystal Violet stained cells. Stained cells were photographed under a microscope and calculated in the whole field.
Invasion assay
Compared to cell migration, the invasion membrane filters were coated with 100 μl of diluted (1:8 in serum-free medium) Matrigel (BD Biosciences, NJ, USA). 8 × 10³ CC cells were seeded in serum-free medium in the upper chamber. The medium containing 10% FBS was added to the lower chamber. Cells were cultured in a 37 °C incubator for 48 h. We removed non-invading cells of upper chamber. Invading cells were fixed in methanol and then stained with Leucocrystal Violet. The CC cells of invasion were photographed under a microscope and the number of stained cells was counted in the whole field.
Immunofluorescence
Transfected CC cells were seeded in glass coverslips in 6-well plates (Corning Incorporated). The cells were fixed in cold 4% paraformaldehyde for 15 min, permeabilized with 0.2% Triton X-100 in TBS for 10 min, and blocked with 5% bovine serum albumin (BSA) in phosphate-buffered saline (PBS) for 30 min, all at room temperature. Then, the cells were incubated with anti-mTOR antibody (dilution 1: 50, Proteintech Group, USA) overnight at 4°C, followed by detection using the FITC-conjugated secondary antibody for 30 min. The cell nuclei were counterstained with 4′, 6-Diamidino-2-phenylindole (DAPI) for 5min at room temperature in the dark. Images were collected and photographed by fluorescence microscope (ZEISS AXIO Scope.A1 HAL100).
Visualization and quantitative analysis of autophagy
We used monodansylcadaverine (MDC) staining to quantify the intracellular autophagic vacuoles. To view the MDC-labeled vacuoles, the CC cells were washed with PBS and then incubated with 0.05 mM MDC at 37°C for 10 min. Cells were washed three times with PBS and collected after incubation. Intracellular MDC-positive dots were analyzed by fluorescence microscopy. Autophagy flux in cells was detected by the Adenovirus mRFP-GFP-LC3 (Hanbio Biotechnology, Shanghai, China), which carries genes encoding modified red fluorescent protein (mRFP) and green fluorescent protein (GFP). The Adenovirus mRFP-GFP-LC3 infected into HeLa and SiHa cells according to the manufacturer's instructions. The yellow (mRFP and GFP) color spots indicated autophagosomes. The loss of green color spots and increased red spots indicated fusion of autophagosomes and lysosomes, and the red (mRFP only) color spots indicated formation of autolysosomes [30]. We calculated yellow color spots and red only color spots to assess the autophagy flux.
Inhibitor system
The cells after being seeded and incubated pre-treated with plasmids and continuously treated with different inhibitors: Z-Phe-Tyr-CHO (Santa Cruz Biotechnology), E64d/Pepstatin A (Sigma Aldrich), Rapamycin or Chloroquine diphosphate salt (MedChem Express).
Co-Immunoprecipitation
Cells were seeded onto 10 cm dish and treated with 50 μg/ml MG132 for 6 h before harvesting, then the total cell lysates were rinsed twice with PBS. Cells were harvested by centrifuge at low speed for 10 min and then were lysed with lysis buffer (50mM Tris-HCl pH 7.5 (Fisher), 0.15M NaCl (Fisher), 1% NP-40 and 1mM EDTA), 20 μl Complete Protease Inhibitor Cocktail (Roche Applied Science) for 20 min at 4°C. Cells were centrifuged at 12500 rpm, at 4 °C for 10 min. The supernatant collected and the protein amount were standardized, and a small amount of lysate was taken for Western blot analysis, and the remaining lysate were added 30 μl Agarose A+G (Santa Cruz Biotechnology) per sample for pre- clearing rotated at 4 °C for 2 h, and then were centrifuged at 3000 rpm, at 4 °C for 5 min. The supernatants were immunoprecipitated with the appropriately corresponding antibody in lysis buffer overnight at 4°C. Then the antibody was pulled down with 30 μl Agarose A+G at 4 °C for 6 h. The samples were centrifuged at 3000 rpm, at 4 °C for 5 min and discard supernatant then added wash buffer NETN up to 1 ml and inverted up and down at 4 °C for 10 min. As the same step that centrifuged at 3000 rpm, at 4 °C for 5 min and discard supernatant were performed in triplicate. The sediment were added 30 μl 2×Sample Buffer and boiled at 100 °C for 5 min then spin down at 12000 rpm for 10 min. Lysate samples were collected and loaded into SDS-PAGE for Western blot.
Protein turnover assay
After transfection, cells were incubated at 37°C with 5% CO2 for 24 or 48 h. Then cycloheximide (CHX) was added into the media to a final concentration of 100 μg/ml. The cells were harvested at the different time points after CHX treatment. The protein levels were analyzed by Western blot.
Ubiquitination assay
Transfected with indicated plasmids, cells were treated with 50 μg/ml MG132 for 6 h before harvesting. In order to detect the ubiquitinated protein in vitro, we pulled down the ubiquitinated protein with anti-mTOR antibody. The protein complexes were then separated on SDS-PAGE and probed with anti-Ubi or anti-HA antibody to reveal the level of ubiquitination.
Statistical analysis
All statistical analyses were determined using the SPSS 22.0 software. All experiments were performed at least three times. For TMA, the difference between CC tissues and paired paracancerous tissues was estimated by paired χ2 test. The correlation between CSN6 and CTSL was estimated by Spearman's correlation analysis. Survival analysis was evaluated by the Kaplan-Meier method and the Log rank test. The association between CSN6 and CTSL staining and the clinicopathologic parameters of the CC patients was evaluated by χ2 test. All values were shown as means ± standard deviation (SD). The two-group comparisons were calculated using Student's T test. P < 0.05 was considered statistically significant.
Results
CSN6 and CTSL serve as potential prognostic indicators for CC patients
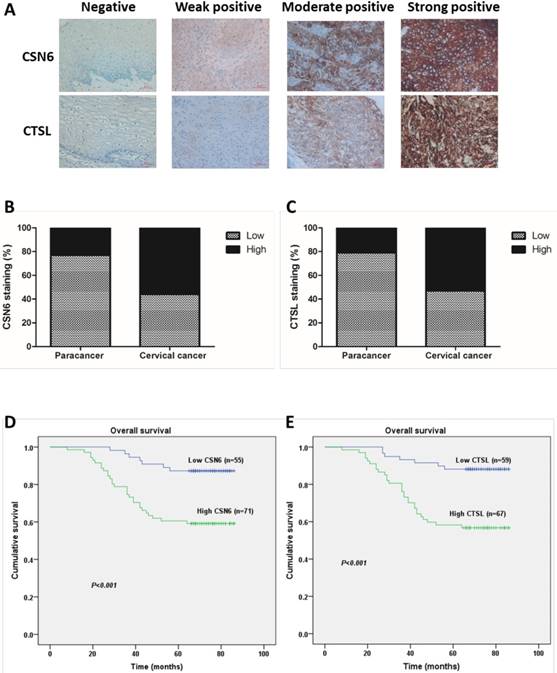
In order to investigate whether CSN6 and CTSL expression are changed in human CC, we performed an immunohistochemistry staining analysis of TMA slide and classified the immunohistologic staining of CSN6 and CTSL in tissue specimens as negative, weak positive, moderate positive and strong positive via IRS (Fig. 1A). The χ2 test suggested that there was a significantly different expression of CSN6 or CTSL in the CC tissues compared with paired paracancerous tissues (Table 1 and 2). CSN6 and CTSL expression were all higher in CC tissues (Fig. 1B and C). To further study whether CSN6 or CTSL expression in CC patients correlates with a worse prognosis, we performed Kaplan-Meier survival analysis and the Log rank test and results presented that survival was significantly lower in high expressed CSN6 CC patients (P< 0.001) (Fig. 1D). The similar result was got in CTSL (P< 0.001) (Fig. 1E). In addition, survival analysis indicated that high expression of CSN6 and CTSL all correlated with a poorer 5-year overall survival rate (Table 3).
Differential expression of CSN6 in CC tissues and paracancer tissues.
| Cervical cancer CSN6 | Paracancer CSN6 | Total | |
|---|---|---|---|
| Low | High | ||
| Low | 21 | 0 | 21 |
| High | 11 | 10 | 21 |
| Total | 32 | 10 | 42 |
P=0.001
CSN6 and CTSL are both up-regulated in TMAs of CC, and correlated with 5-year overall survival in CC patients. (A) Representative photographs of immunohistochemistry staining for CSN6 and CTSL in human CC. Original magnification × 400 for A. (B) High expression of CSN6 was observed in 23.8% (10 of 42 cases) paracancerous tissues, while 56.3% (71 of 126 cases) CC tissues. (C) CTSL high expression staining was observed in 21.4% (9 of 42 cases) paracancerous tissues, and 53.2% (67 of 126 cases) CC tissues. (D) Kaplan-Meier survival analysis of the rate of overall survival according to low and high CSN6 expression of 126 patients with CC (P <0.001, Log rank test). (E) Kaplan-Meier survival analysis of 126 CC patients with high or low CTSL expression (P <0.001, Log rank test).
Differential expression of CTSL in CC tissues and paracancer tissues.
| Cervical cancer CTSL | Paracancer CTSL | Total | |
|---|---|---|---|
| Low | High | ||
| Low | 20 | 0 | 20 |
| High | 13 | 9 | 22 |
| Total | 33 | 9 | 42 |
P<0.001
The 1,3 and 5-year overall cumulative survival rate of 126 CC patients with low or high CSN6 and CTSL expression.
| Number of cases | Number of deaths | Survival rate (%) | Log rank-X2 | P | |||
|---|---|---|---|---|---|---|---|
| 1 year | 3 year | 5 year | |||||
| CSN6 | 12.605 | <0.001 | |||||
| Low | 55 | 7 | 100.0 | 96.4 | 87.3 | ||
| High | 71 | 29 | 98.6 | 78.9 | 59.2 | ||
| CTSL | 15.298 | <0.001 | |||||
| Low | 59 | 7 | 100.0 | 93.2 | 88.1 | ||
| High | 67 | 29 | 98.5 | 80.6 | 56.7 | ||
CSN6 is positively correlated with of CTSL and they are all associated with the depth of invasion in human CC
To evaluate the relationship between CSN6 and CTSL expression in CC, we performed Spearman's correlation analysis. We demonstrated that there was a positive correlation between CSN6 and CTSL (r=0.713, P < 0.001) (Table 4). To further explore whether the clinicopathological features, such as depth of invasion, lymph node metastasis and HPV infection are correlated with CSN6 and CTSL expression, respectively. We summarized the relationships in Table 5 and 6. Statistical analysis showed that high level of CSN6 was correlated with depth of invasion (P= 0.030) and HPV infection (P= 0.039) (Table 5). In addition, we found the compelling correlations of CTSL expression with depth of invasion (P= 0.007) and lymph node metastases (P= 0.003) (Table 6). On the basis of these findings, we hypothesized that the coordination between CSN6 and CTSL expression might have an impact on CC invasion.
The correlation of CSN6 and CTSL expression in human CC.
| Cervical cancer CSN6 | Cervical cancer CTSL | Total | |
|---|---|---|---|
| Low | High | ||
| Low | 48 | 7 | 55 |
| High | 11 | 60 | 71 |
| Total | 59 | 67 | 126 |
Spearman's correlation analysis: r=0.713, P<0.001
The relationship between CSN6 staining and CC patients' clinicopathological features.
| Variables | Number (n=126) | CSN6 staining | X2 | P | |
|---|---|---|---|---|---|
| Low (%) | High (%) | ||||
| Age (years) | 1.021 | 0.312 | |||
| ≤45 | 60 | 29(48.3) | 31(51.6) | ||
| >45 | 66 | 26(39.4) | 40(60.6) | ||
| Diagnostic category | 1.536 | 0.215 | |||
| Squamous carcinoma | 116 | 53(45.7) | 63(54.3) | ||
| Adenocarinoma | 10 | 2(20.0) | 8(80.0) | ||
| Depth of invasion | 8.937 | 0.030 | |||
| T1 | 69 | 37(53.6) | 32(46.4) | ||
| T2 | 30 | 9(30.0) | 21(70.0) | ||
| T3 | 24 | 9(37.5) | 15(62.5) | ||
| T4 | 3 | 0(0) | 3(100.0) | ||
| Lymph node metastases | 1.721 | 0.190 | |||
| No | 101 | 47(46.5) | 54(53.5) | ||
| Yes | 25 | 8(32.0) | 17(68.0) | ||
| HPV infection | 4.261 | 0.039 | |||
| Negative | 28 | 17(60.7) | 11(39.3) | ||
| Positive | 98 | 38(38.8) | 60(61.2) | ||
The relationship between CTSL staining and CC patients' clinicopathological features.
| Variables | Number (n=126) | CTSL staining | X2 | P | |
|---|---|---|---|---|---|
| Low (%) | High (%) | ||||
| Age (years) | 4.455 | 0.035 | |||
| ≤45 | 60 | 34(56. 7) | 26(43.3) | ||
| >45 | 66 | 25(37.9) | 41(62.1) | ||
| Diagnostic category | 0.610 | 0.435 | |||
| Squamous carcinoma | 116 | 56(48.3) | 60(51.7) | ||
| Adenocarinoma | 10 | 3(30.0) | 7(70.0) | ||
| Depth of invasion | 12.226 | 0.007 | |||
| T1 | 69 | 40(58.0) | 29(42.0) | ||
| T2 | 30 | 13(43.3) | 17(56.7) | ||
| T3 | 24 | 6(25.0) | 18(75.0) | ||
| T4 | 3 | 0(0) | 3(100.0) | ||
| Lymph node metastases | 9.014 | 0.003 | |||
| No | 101 | 54(53.5) | 47(46.5) | ||
| Yes | 25 | 5(20.0) | 20(80.0) | ||
| HPV infection | 0.146 | 0.703 | |||
| Negative | 28 | 14(50.0) | 14(50.0) | ||
| Positive | 98 | 45(46.0) | 53(54.0) | ||
CSN6 promotes CC cells migration and invasion
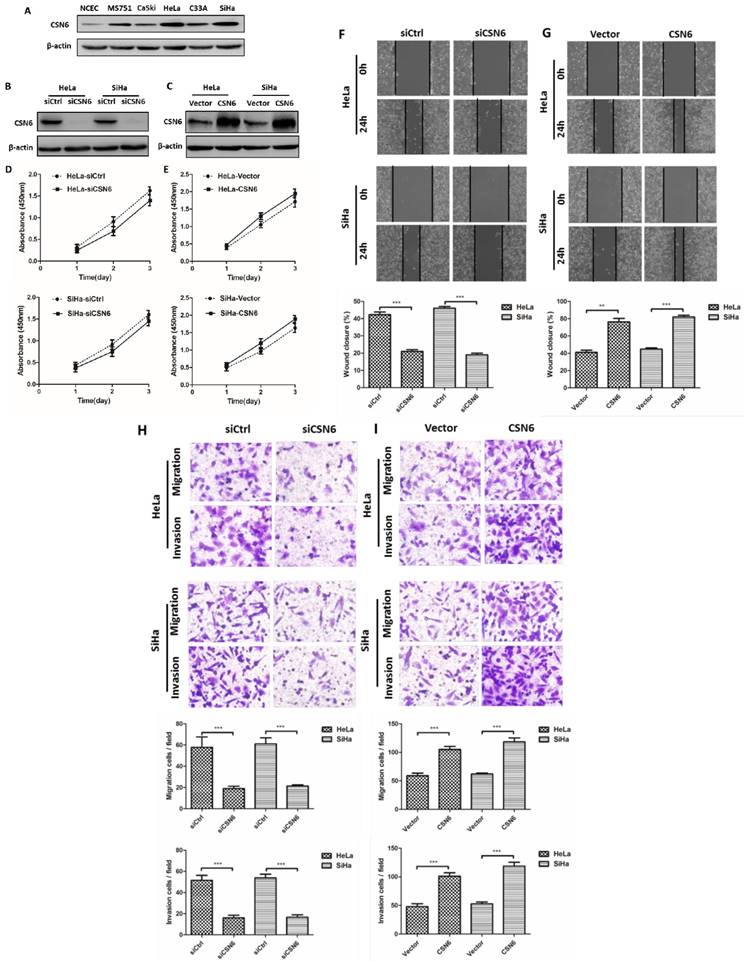
Western blot results revealed that CSN6 expression was increased in CC cell lines, which is consistent with the result of our previous study, indicating that the levels of CSN6 expression are predominantly higher in CC tissues. The expression of CSN6 was significantly up-regulated in HeLa and SiHa cells among these CC cell lines (Fig. 2A). Western blot showed that siCSN6 and CSN6 overexpression plasmid were successfully transfected into CC cells (Fig. 2B and C). To investigate whether CSN6 affects CC cell proliferation, we analyzed the growth of HeLa and SiHa cells through CCK-8 assay. The data revealed that the cell proliferation had no significant difference (Fig. 2D and E). Hence, we assessed the effect of CSN6 on motility of CC cells. Wound healing test revealed that a significant decrease in the wound closure of CSN6 knocked down cells when compared with the control cells (Fig. 2F). Furthermore, our results found that up-regulation of CSN6 increased the wound closure ability of CC cells (Fig. 2G). To assess the metastatic effects of CSN6 in CC, we performed transwell assay and found that down-regulation of CSN6 strongly decreased the migration and invasion abilities of CC cells (Fig. 2H). The contrary result was got in CSN6 overexpressioned CC cells migration and invasion assay (Fig. 2I).
Effects of CSN6 on proliferation, motility, migration and invasion in CC cells. (A) Western blot assays were used to detect the expression of CSN6 in normal NCEC and CC cells (MS751, CaSki, HeLa, C33A, SiHa). β-actin served as an internal control. (B and C) Western blot analysis of CSN6 protein level after transfection of siCtrl, siCSN6,Vector and CSN6 expression plasmids in HeLa and SiHa cells. β-actin served as an internal control. (D and E) CCK-8 cell proliferation assays after CSN6 knockdown and overexpression for 1, 2 and 3 d in HeLa and SiHa cells. (F and G) Wound-healing assays were performed to examine the effect of CSN6 knockdown and overexpression on cell motility. Original magnification × 200 for F and G. (H and I) Transwell assays were utilized to determine the migration and invasion abilities after CSN6 knockdown and overexpression in HeLa and SiHa cells, respectively. Original magnification × 400 for H and I. All experiments were performed in triplicate. The data are presented as mean ± SD. **, P < 0.01; ***, P < 0.001.
CTSL promotes CC cells migration and invasion
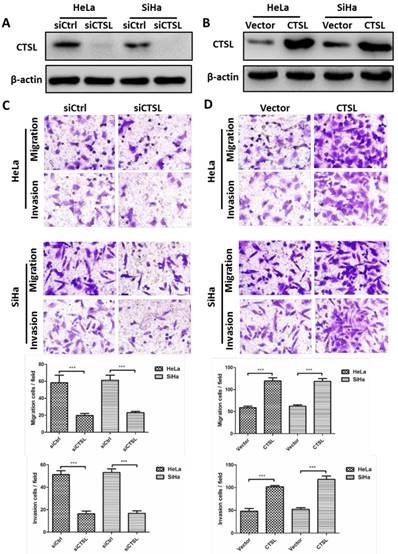
The above results indicated that CSN6 could facilitate metastasis of CC cells. Given that there is a positive relationship between CSN6 and CTSL in CC tissues. We thus wanted to determine whether overexpression of CTSL could promote the metastasis of CC cells in vitro. Western blot showed that siCTSL and CTSL overexpression plasmid were efficiently transfected into CC cells (Fig. 3A and B). As expected, transwell assay revealed that down-regulation of CTSL strongly decreased the migration and invasion abilities of CC cells (Fig. 3C). In addition, our results found that up-regulation of CTSL increased the migration and invasion ability of CC cells (Fig. 3D).
Effects of CTSL on migration and invasion in CC cells. (A and B) Western blot assays were utilized to detect the expression of CTSL after transfection of siCtrl, siCTSL, Vector and CTSL expression plasmids in HeLa and SiHa cells. β-actin served as an internal control. (C and D) Transwell assays were performed to determine the migration and invasion abilities after CTSL knockdown and overexpression in HeLa and SiHa cells, respectively. Original magnification × 400 for C and D. All experiments were performed in triplicate. The data are presented as mean ± SD. ***, P < 0.001.
CSN6 promotes metastasis by increasing CTSL expression in CC cells
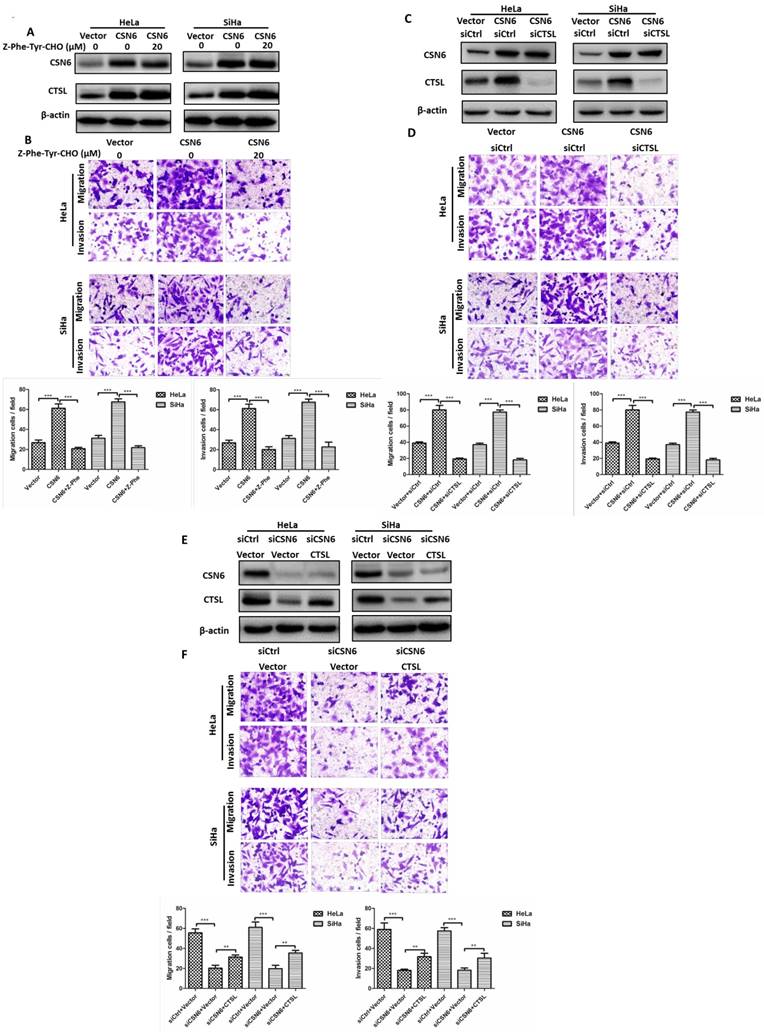
It has been reported that CSN6 could promote the cancerogenesis by regulating metastasis-related proteins [7-9]. Since CTSL plays a critical role in degradation of extracellular matrix for metastasis, next we wondered whether CSN6 could affect the cell migration and invasion of CC cells via CTSL. We used CTSL inhibitor Z-Phe-Tyr-CHO to inhibit activation of CTSL. Transwell assay showed that after transfecting CSN6 overexpression plasmid, the numbers of migratory and invasive cells were obviously increased versus Vector group. Furthermore, the trend of increase could be abolished by Z-Phe-Tyr-CHO (Fig. 4A and B). Besides, we conducted three groups of co-transfection and used western blot verified the effectiveness of co-transfection (Fig. 4C and E). Subsequent to transfection with CSN6 overexpression plasmid, the migratory and invasive cells were significantly increased versus Vector group. Moreover, the trend of increase might be somewhat abolished by co-transfection with siCTSL rather than with siCtrl (Fig. 4D). Inversely, following transfection with siCSN6, the migratory and invasive cells were decreased in contrast to siCtrl group, whereas the diminishing trend could be rescued by co-transfection with CTSL overexpression plasmid rather than with Vector plasmids (Fig. 4F). Our results demonstrated that CSN6 could promote metastasis of CC cells via CTSL.
CSN6 promotes the cell migration and invasion by CTSL. (A) Western blot assays were used to detect the expression of CSN6 and CTSL in HeLa and SiHa cells, which were transfected of Vector and CSN6 overexpression plasmids before treating with or without CTSL inhibitor Z-Phe-Tyr-CHO (20 μM). β-actin served as an internal control. (B) The cell migration and invasion evaluated by transwell assays after three groups (Vector, CSN6, CSN6+Z-Phe-Tyr-CHO) in HeLa and SiHa cells. (C and E) Western blot analysis of CSN6 and CTSL expression in three groups of co-transfection as labeled. β-actin served as an internal control. (D) The cell migration and invasion evaluated by transwell assays after three groups of co-transfection (Vector+siCtrl, CSN6+siCtrl, CSN6+siCTSL) in HeLa and SiHa cells. (F) The cell migration and invasion evaluated by transwell assays after three groups of co-transfection (siCtrl+Vector, siCSN6+Vector, siCSN6+CTSL) in HeLa and SiHa cells. Original magnification ×400. All experiments were performed in triplicate. The data are presented as mean ± SD. **, P < 0.01; ***, P < 0.001.
Knockdown of CSN6 enhances autophagy in CC cells
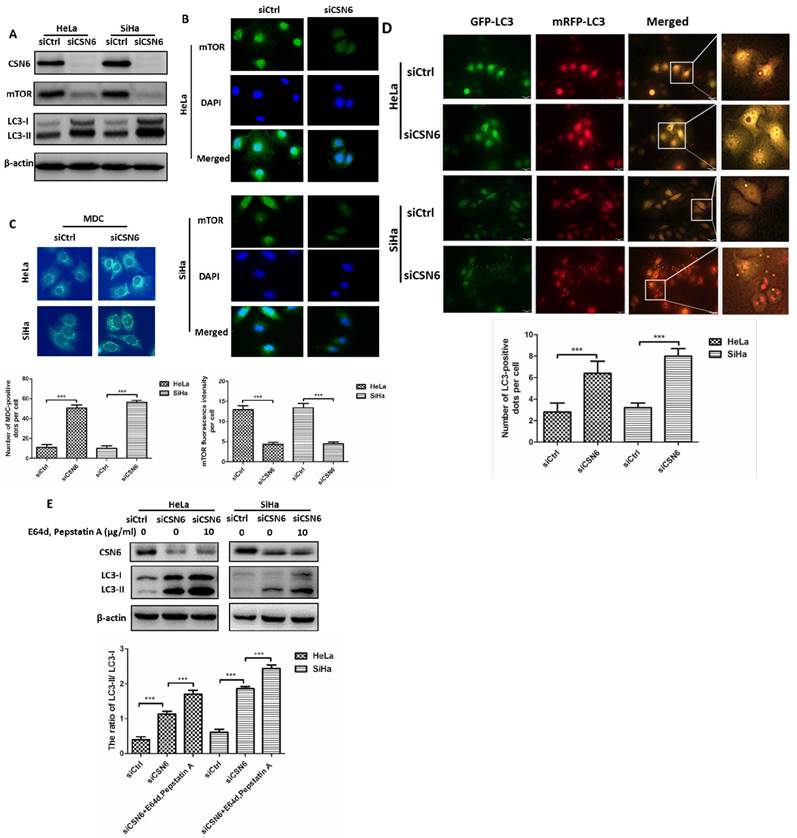
The above observation showed that CSN6 affected the CC cell migration and invasion of CC via CTSL. Previous studies reported that autophagy is associated with CTSL [26, 31, 32]. We wondered whether there are potential regulation mechanisms between CSN6 and autophagy. Western blot assay revealed that CSN6 knockdown resulted in the down-regulation of mTOR and the up-regulation of LC3-II (Fig. 5A). Consistently, the observations from immunofluorescence staining found that the mTOR signal (green) was strikingly decreased in CSN6 knockdown cells (Fig. 5B). Besides, we used the autofluorescent drug MDC to detect autophagic vesicles [33]. Accumulation of MDC were found to be markedly increased in CSN6 knockdown cells (Fig. 5C). To further monitor autolysosome formation, HeLa and SiHa cells were infected with adenovirus mRFP-GFP-LC3 before CSN6 knockdown. We found that knockdown of CSN6 induced increased fluorescent protein mRFP+-GFP+-LC3 puncta, suggesting that CSN6 knockdown elicits autophagy flux in CC cells (Fig. 5D). To further consolidate the data, we added lysosomal protease inhibitors E64d and Pepstatin A [34] into the cells that have been transfected with CSN6 siRNA. Western blot assay showed that the expression of LC3-II further accumulated in the presence of E64d and Pepstatin A. The ratio of LC3-II/ LC3-I also increased (Fig. 5E). Hence, knockdown of CSN6 enhanced the autophagic flux.
Knockdown of CSN6 enhances autophagy in CC cells. (A) Western blot assays of CSN6, mTOR and LC3-I/II protein levels after CSN6 knockdown in HeLa and SiHa cells. β-actin served as an internal control. (B) Immunofluorescence staining of mTOR signal (green) in HeLa and SiHa cells was analyzed by fluorescent microscope after CSN6 knockdown. DAPI fluorescence signal occurred in the nucleus (blue). The intensity of mTOR per cell was quantified by densitometry (software: Image J, NIH). Original magnification ×400 for B. (C) The visualization of autophagic vacuoles in HeLa and SiHa cells was suggested by interspersed MDC labeling and analyzed by fluorescence microscopy. The number of MDC staining spots per cell was quantified. Original magnification ×400 for C. (D) HeLa and SiHa cells were first infected with adenovirus mRFP-GFP-LC3 (10 MOI) and further transfected with siCtrl and siCSN6 for another 48 hours. The number of yellow puncta and red only puncta per cell was quantified. Original magnification ×400 for D. (E) Western blot assays were used to detect the expression of CSN6 and LC3-II in HeLa and SiHa cells, which were transfected of siCSN6 before treating with or without lysosomal protease inhibitors E64d (10 μg/ml) and Pepstatin A (10 μg/ml). The integrated optical density (IOD) values of each bands were measured by Image J. The ratio of LC3-II/LC3-I was indicated graphically. All experiments were performed in triplicate. The data are presented as mean ± SD. ***, P < 0.001.
CSN6 inhibits autophagy by increasing mTOR expression in CC cells
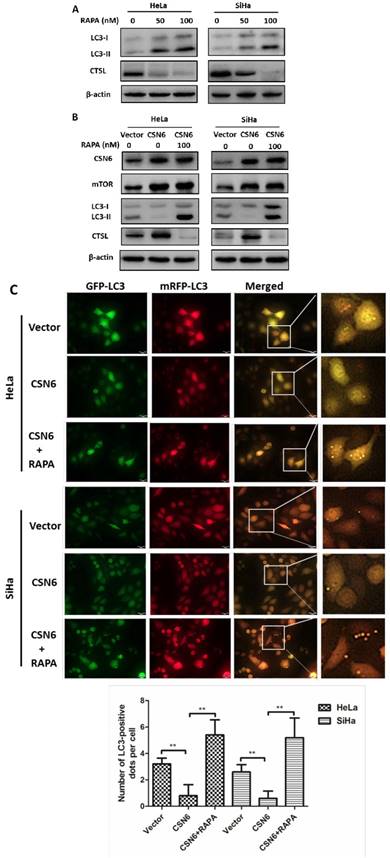
Given that knockdown of CSN6 effectively reduced the expression of mTOR (Fig. 5A and B), we thus wanted to determine whether CSN6 inhibits autophagy by increasing mTOR expression in CC cells. We used mTOR inhibitor Rapamycin (RAPA) to induce autophagy in HeLa and SiHa cells and found that Rapamycin enhanced the expressions of LC3 and decreased the expression of CTSL in a dose-dependent manner (Fig. 6A). We conducted three groups (Vector, CSN6, CSN6+RAPA). We analyzed the expression levels of mTOR and LC3 by western blot and the results showed that CSN6 up-regulated the mTOR expression and down- regulated LC3, while the trends of LC3 and CTSL were reversed by RAPA (Fig. 6B). Compared with empty vector group, CSN6 overexpression group presented that mitigated mRFP+-GFP+-LC3 fluorescent protein puncta in HeLa and SiHa cells. However, RAPA significantly reversed CSN6-mediated inhibition of autophagy (Fig. 6C). These results suggested that CSN6 could inhibit autophagy by increasing mTOR expression in CC cells.
CSN6 inhibits autophagy by increasing mTOR expression in CC cells. (A) Western blot assays of LC3 and CTSL protein levels in HeLa and SiHa cells treated with mTOR inhibitor Rapamycin (RAPA: 0, 50, 100 nM) for 12 h. β-actin served as an internal control. (B) Western blot assays were used to detect the expression of CSN6, mTOR, LC3 and CTSL in HeLa and SiHa cells, which were transfected of Vector and CSN6 overexpression plasmids before treating with or without autophagy inducer RAPA(100 nM, 12 h). β-actin served as an internal control. (C) The cell autophagy flux of three groups (Vector, CSN6, CSN6+RAPA) in HeLa and SiHa cells pretreated with adenovirus RFP-GFP-LC3 (10 MOI). The number of yellow puncta and red only puncta per cell was quantified. Original magnification ×400 for C. All experiments were performed in triplicate. The data are presented as mean ± SD. **, P < 0.01.
CSN6 increases mTOR stability by reducing mTOR ubiquitination
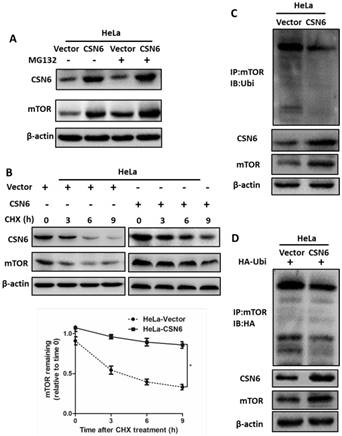
Our aforementioned results prompted us to investigate how CSN6 regulates mTOR expression. The data showed that CSN6-mediated mTOR up-regulation was enhanced by the 26S proteasome inhibitor MG132 (Fig. 7A). This indicated that CSN6 increased mTOR stability in a proteasome-dependent manner. Furthermore, CSN6 decreased the turnover rate of mTOR in the presence of CHX, a de novo protein synthesis inhibitor (Fig. 7B). Previous study has shown that CSN6 enhanced the autoubiquitination and degradation of FBXW7 (a subunit of SCF ubiquitin ligase) [35], which could target mTOR and regulate its ubiquitination and degradation processes [36]. To validate whether ubiquitination is involved in CSN6-mediated stabilization of mTOR, we then performed ubiquitination assay and found that overexpression of CSN6 decreased the ubiquitination level of mTOR (Fig. 7C and D).
CSN6 increases mTOR stability by reducing mTOR ubiquitination. (A) Western blot assays were used to detect the expression of CSN6 and mTOR in HeLa cells, which were transfected with Vector and CSN6 plasmids for 24 h and then treated with or without proteasome inhibitor MG132 (50 μg/ml) for 6 h before being harvested. (B) Western blot assays of mTOR turnover rate in CSN6 overexpressing HeLa cells. β-actin served as an internal control. HeLa cells were treated with cycloheximide (CHX) (100 μg /ml) for 0, 3, 6, 9 h after transfection. The IOD values of bands at each time point were measured by Image J. Remaining mTOR was indicated graphically. (C) HeLa cells were transfected with Vector or CSN6 plasmid. The cells were treated with MG132 (50 μg/ml) for 6 h before being harvested. The cell lysates were pulled down with anti-mTOR antibody and immunoblotted with anti-ubiquitin antibody. Western blot analysis of CSN6 and mTOR was performed using equal amounts of cell lysates. (D) HeLa cells were co-transfected with CSN6 and HA-ubiquitin plasmids. The cells were treated with MG132 (50 μg/ml) for 6 h before being harvested. The cell lysates were pulled down with anti-mTOR antibody and immunoblotted with anti-HA antibody. Western blot analysis of CSN6 and mTOR was performed using equal amounts of cell lysates. All experiments were performed in triplicate. The data are presented as mean ± SD. *, P < 0.05.
CSN6 interacts with CTSL and positively regulates CTSL expression through an autophagy-lysosomal system
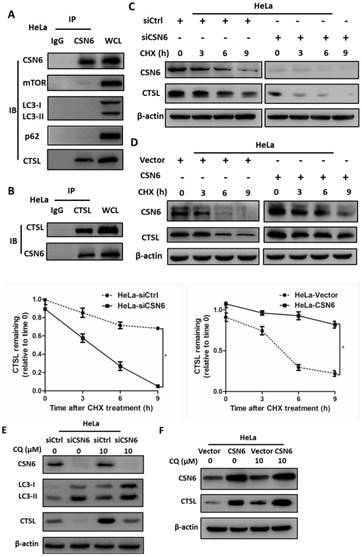
On the basis of findings above, we hypothesized that CSN6 and several essential proteins involved in the regulation of autophagy (mTOR, LC3, p62 and CTSL) might have interactive or regulatory relationships. Co-immunoprecipitation experiments showed endogenous interaction of CSN6 and CTSL in HeLa cells (Fig. 8A and B). Knockdown of CSN6 increase turnover of CTSL in the presence of CHX (Fig. 8C). In contrast, overexpression of CSN6 decreased the turnover rate of CTSL (Fig. 8D). These results suggest that CSN6 is critical for the stability of CTSL. Given that the autophagy inducer RAPA effectively reduced the expression of CTSL (Fig. 6A and B). To further clarify the relationship between CTSL and autophagy, we added autophagy inhibitor Chloroquine (CQ) into the cells that have been transfected with indicated siRNA or plasmids. Western blot assay demonstrated that siCSN6-mediated down-regulation of CTSL could be rescued by CQ (Fig. 8E). In addition, CSN6-mediated CTSL up-regulation was enhanced by CQ (Fig. 8F). These results suggested that CSN6 increased steady-state expression of CTSL in an autophagy-lysosomal dependent manner. Together, these data demonstrate that siCSN6 inhibited CTSL through an autophagic degradation pathway.
CSN6 interacts with CTSL and positively regulates CTSL expression through an autophagy-lysosomal system in HeLa cells. (A and B) Physical interaction of endogenous CSN6 with endogenous CTSL. Equal amounts of CSN6 overexpressing HeLa cells lysates were immunopricipitated with either IgG, anti-CSN6 or anti-CTSL antibody and immunoblotted with the indicated antibodies. Whole cell lysates (WCL) were immunoblotted with indicated antibody. (C and D) Western blot assays of CTSL turnover rate in CSN6 knockdown or overexpressing HeLa cells. β-actin served as an internal control. HeLa cells were treated with CHX (100 μg /ml) for 0, 3, 6, 9 h after transfection. The IOD values of bands at each time point were measured by Image J. Remaining CTSL was indicated graphically. (E and F) CSN6-mediated stabilization of CTSL was dependent on autophagy-lysosomal. CSN6 knockdown or overexpressing HeLa cells were treated with or without autophagy inhibitor Chloroquine (CQ, 10 μM) for 6 h before harvesting. Western blot analysis of CSN6 and CTSL protein levels. β-actin served as an internal control. All experiments were performed in triplicate. The data are presented as mean ± SD. *, P < 0.05.
CSN6 promotes the migration and invasion of CC cells through inhibiting autophagy
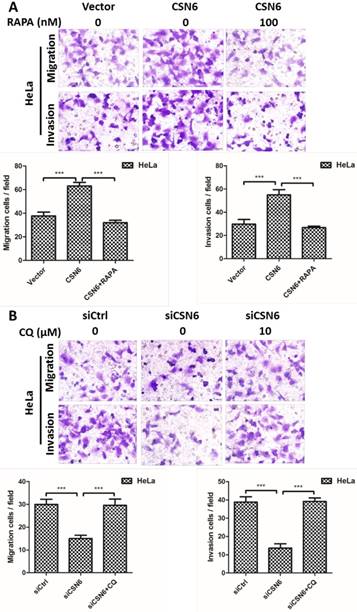
To further investigate the potential function of autophagy in cell migration and invasion, autophagy inducer Rapamycin and autophagy inhibitor Chloroquine were used to detect the cell motility when manipulating CSN6 expression. We performed transwell assays to detect the cell migration and invasion. Up-regulation of CSN6 significantly strengthened the migration and invasion ability of HeLa cells compared with Vector group, whereas this trend of increase was abated in cells treated with autophagy inducer Rapamycin (Fig. 9A). Furthermore, autophagy inhibitor Chloroquine reversed siCSN6-inhibited migration and invasion in HeLa cells (Fig. 9B), indicating that autophagy could participate in siCSN6-induced metastasis inhibition.
CSN6 promotes the migration and invasion of HeLa cells through inhibiting autophagy. (A) Autophagy inducer RAPA was used to detect cell migration and invasion when overexpressing CSN6. The cell migration and invasion evaluated by transwell assays after three groups (Vector, CSN6, CSN6+RAPA) in HeLa cells. (B) Autophagy inhibitor CQ was used to detect the cell migration and invasion when knocking down CSN6 expression. The cell migration and invasion evaluated by transwell assays after three groups (siCtrl, siCSN6, siCSN6+CQ) in HeLa cells. Original magnification ×400 for A and B. All experiments were performed in triplicate. The data are presented as mean ± SD. ***, P < 0.001.
Discussion
In recent years, CSN6, has been reported to exhibit important roles in cancer-related protein degradation by modulating the E3 ubiquitin ligases, are mainly embodied in the promoting of tumor cells migration, diffusion and accelerating of tumor cells proliferation [6, 7, 11, 35, 37-40]. CSN6 has been shown to be overexpressed in CC and associated with CC development [37]. Whereas its role in CC autophagy remain unveiled. Autophagy is enclosed in the double-membrane autophagosomes and delivered to lysosomes for degradation of cell components and the recycling of cellular construction [12], and its dysfunction has been implicated in many human cancer [13]. Emerging evidence have reported that autophagy is critical for the biological behavior of CC cells, which can regulate the proliferation and metastasis of CC cells [17, 41, 42]. Of note, CTSL is one of the cysteine proteases and has been implicated in stimulating autophagy [25, 43]. CTSL, produced as prepro CTSL, is transported by the Golgi apparatus in the form of pro CTSL and eventually stored in lysosomes as mature CTSL. In addition to acting as regulator of the cell cycle [44] and immune system [45]. Once activated, CTSL not only reduces cell adhesion through cleavage of E-cadherin [46] but also degrades the extracellular matrix for tumor migration and invasion [47]. In addition, CTSL has been shown to be highly expressed in variety of human cancer cells, particularly in invasive tumor cells [23]. The present study is the first scientific report demonstrating that CSN6-mediated the steady-state expression of CTSL may significantly promote the migration and invasion through an autophagy- lysosomal system in HeLa and SiHa cells.
In our study, we used immunohistochemical technique, cell proliferation assay, wound-healing assay, migration assay, invasion assay and western blot to investigate the role of CSN6 and CTSL in CC cells. We first identified increased expression of CSN6 and CTSL protein in CC tissues. Our results demonstrated that the positive relationship between CSN6 and CTSL. Furthermore, we found that high CSN6 and CTSL expression all correlated with a poorer 5-year overall cumulative survival for CC patients. Together, these results suggest that CSN6 and CTSL might be considered as important prognostic factors in CC. Our results demonstrated that the up-regulation of CSN6 promoted the migratory and invasive capacities of cancer cells. Meanwhile, the down-regulation of CSN6 inhibited the metastasis of cancer cells. Our data demonstrated that CSN6 could promote metastasis of CC cells via CTSL. Furthermore, knockdown of CSN6 suppressed CTSL expression and the cell invasion ability of the CC cells. Besides, overexpression of CTSL presented that reversed siCSN6-inhibited CTSL protein level and invasion.
Previous study has shown that CSN6 enhanced the autoubiquitination and degradation of FBXW7 [35], which could target mTOR and regulate its ubiquitination and degradation processes [36]. Our findings showed that CSN6 could increase mTOR stability by reducing mTOR ubiquitination. In recent years, mTOR has been proved to be a serine-threonine protein kinase that can be divided into two functionally and biochemically distinct complexes, mTORC1 and mTORC2. Specifically, mTORC1 is a key complex that regulates the initial stage of autophagy, and mTORC1 inhibition increases autophagy [48]. Meanwhile, autophagosomal proteins have been reported to be ubiquitinated by E3 ubiquitin ligases [49-52]. Our data showed that CSN6-mediated mTOR up-regulation was enhanced by the 26S proteasome inhibitor MG132. Ubiquitination assay indicated that overexpression of CSN6 decreased the ubiquitination level of mTOR. Among several essential proteins involved in the regulation of autophagy, LC3, homolog of Autophagy-related protein 8 (Atg8) [53], is processed to LC3-I, and then conjugated with phosphatidylethanolamine (PE) to generate LC3-II, locating on the membrane of autophagosome until it is degraded by the lysosome. Therefore, LC3 is widely used as a marker for autophagy [54]. Knockdown of CSN6 induced appropriate autophagy pathways and significantly increased LC3-II accumulation in our study.
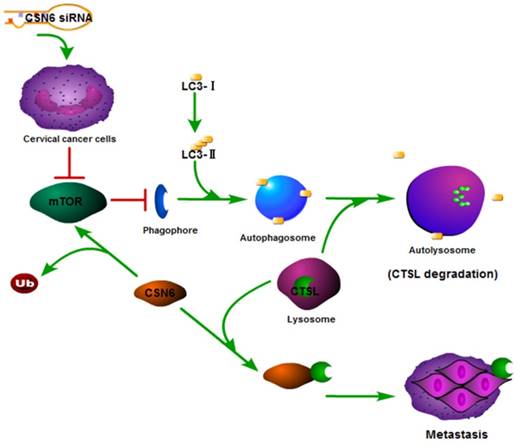
In recent years, autophagy has been reported to be associated with CTSL [26, 31, 32]. We found that Rapamycin activated autophagy of CC cells. CSN6-mediated CTSL up-regulation was decreased by Rapamycin. Endogenous LC3-II turnover blocked by autophagy inhibitor Chloroquine indicated that knockdown of CSN6 induced the normal flux of complete autophagy. Moreover, CSN6-mediated CTSL up-regulation was enhanced by Chloroquine. CSN6 could increase steady-state expression of CTSL through preventing autophagy-lysosomal system. In addition, Chloroquine could reverse siCSN6-inhibited migration and invasion in CC cells. Tumor cell migration and invasion are essential steps in the process of metastasis. On the basis of our mechanistic studies, we developed a model of CSN6 modulating CTSL stability and metastasis (Fig. 10).
Model of CSN6 modulating CTSL stability and metastasis.
In summary, our study showed that down- regulation of CSN6 inhibits invasion via autophagic degradation of CTSL in CC. CSN6 overexpression can facilitate CTSL stabilization in CC. These findings indicated that CSN6 might be a prognostic marker and a potential therapeutic target for CC.
Acknowledgements
This work was supported by the National Natural Science Foundation of China (No. 81572349, 81872080), Jiangsu Provincial Medical Talent (ZDRCA2016055), the Science and Technology Department of Jiangsu Province (BK20181148, BK20161157) and the Priority Academic Program Development of Jiangsu Higher Education Institutions (PAPD).
Competing Interests
The authors have declared that no competing interest exists.
References
1. Rozen S, Fuzesi-Levi MG, Ben-Nissan G, Mizrachi L, Gabashvili A, Levin Y. et al. CSNAP Is a Stoichiometric Subunit of the COP9 Signalosome. Cell reports. 2015;13:585-98
2. Zhang QY, Jin R, Zhang X, Sheng JP, Yu F, Tan RX. et al. The putative oncotarget CSN5 controls a transcription-uncorrelated p53-mediated autophagy implicated in cancer cell survival under curcumin treatment. Oncotarget. 2016;7:69688-702
3. Su H, Li J, Osinska H, Li F, Robbins J, Liu J. et al. The COP9 signalosome is required for autophagy, proteasome-mediated proteolysis, and cardiomyocyte survival in adult mice. Circulation Heart failure. 2013;6:1049-57
4. Su H, Li F, Ranek MJ, Wei N, Wang X. COP9 signalosome regulates autophagosome maturation. Circulation. 2011;124:2117-28
5. Zhang SN, Pei DS, Zheng JN. The COP9 signalosome subunit 6 (CSN6): a potential oncogene. Cell division. 2013;8:14
6. Zhu Y, Li F, Shi W, Zhai C, Wang J, Yan X. et al. COP9 signalosome subunit 6 mediates PDGF -induced pulmonary arterial smooth muscle cells proliferation. Experimental cell research. 2018;371:379-88
7. Hou J, Deng Q, Zhou J, Zou J, Zhang Y, Tan P. et al. CSN6 controls the proliferation and metastasis of glioblastoma by CHIP-mediated degradation of EGFR. Oncogene. 2017;36:1134-44
8. Wen D, Liao T, Ma B, Qu N, Shi RL, Lu ZW. et al. Downregulation of CSN6 attenuates papillary thyroid carcinoma progression by reducing Wnt/beta-catenin signaling and sensitizes cancer cells to FH535 therapy. 2018; 7: 285-96.
9. Fang L, Lu W, Choi HH, Yeung SC, Tung JY, Hsiao CD. et al. ERK2-Dependent Phosphorylation of CSN6 Is Critical in Colorectal Cancer Development. Cancer cell. 2015;28:183-97
10. Yang L, Liu Y, Wang M, Qian Y, Dong X, Gu H. et al. Quercetin-induced apoptosis of HT-29 colon cancer cells via inhibition of the Akt-CSN6-Myc signaling axis. Molecular medicine reports. 2016;14:4559-66
11. Shin J, Phan L, Chen J, Lu Z, Lee MH. CSN6 positively regulates c-Jun in a MEKK1-dependent manner. Cell cycle (Georgetown, Tex). 2015;14:3079-87
12. Cicchini M, Karantza V, Xia B. Molecular pathways: autophagy in cancer-a matter of timing and context. Clinical cancer research: an official journal of the American Association for Cancer Research. 2015;21:498-504
13. Paquette M, El-Houjeiri L, Pause A. mTOR Pathways in Cancer and Autophagy. Cancers. 2018:10
14. Yun CW, Lee SH. The Roles of Autophagy in Cancer. 2018; 19.
15. Qin G, Li P, Xue Z. Triptolide induces protective autophagy and apoptosis in human cervical cancer cells by downregulating Akt/mTOR activation. Oncology letters. 2018;16:3929-34
16. Guo X, Xiao H, Guo S, Li J, Wang Y, Chen J. Long noncoding RNA HOTAIR knockdown inhibits autophagy and epithelial-mesenchymal transition through the Wnt signaling pathway in radioresistant human cervical cancer HeLa cells. 2018.
17. Hsin MC, Hsieh YH, Wang PH, Ko JL, Hsin IL, Yang SF. Hispolon suppresses metastasis via autophagic degradation of cathepsin S in cervical cancer cells. Cell death & disease. 2017;8:e3089
18. Bhatla N, Aoki D, Sharma DN, Sankaranarayanan R. Cancer of the cervix uteri. International journal of gynaecology and obstetrics: the official organ of the International Federation of Gynaecology and Obstetrics. 2018;143(Suppl 2):22-36
19. Qureshi R, Arora H, Rizvi MA. EMT in cervical cancer: its role in tumour progression and response to therapy. Cancer letters. 2015;356:321-31
20. Li YY, Fang J, Ao GZ. Cathepsin B and L inhibitors: a patent review (2010 - present). Expert opinion on therapeutic patents. 2017;27:643-56
21. Pranjol MZ, Gutowski N, Hannemann M, Whatmore J. The Potential Role of the Proteases Cathepsin D and Cathepsin L in the Progression and Metastasis of Epithelial Ovarian Cancer. Biomolecules. 2015;5:3260-79
22. Anja P, Anahid J, Janko K. Cysteine cathepsins: Their biological and molecular significance in cancer stem cells. Seminars in cancer biology. 2018
23. Sudhan DR, Siemann DW. Cathepsin L targeting in cancer treatment. Pharmacology & therapeutics. 2015;155:105-16
24. Sudhan DR, Pampo C, Rice L, Siemann DW. Cathepsin L inactivation leads to multimodal inhibition of prostate cancer cell dissemination in a preclinical bone metastasis model. International journal of cancer. 2016;138:2665-77
25. Jung M, Lee J, Seo HY, Lim JS, Kim EK. Cathepsin inhibition-induced lysosomal dysfunction enhances pancreatic beta-cell apoptosis in high glucose. PloS one. 2015;10:e0116972
26. Hsu KF, Wu CL, Huang SC, Wu CM, Hsiao JR, Yo YT. et al. Cathepsin L mediates resveratrol-induced autophagy and apoptotic cell death in cervical cancer cells. Autophagy. 2009;5:451-60
27. Li L, Wang X, Fei X, Xia L, Qin Z, Liang Z. Parkinson's disease involves autophagy and abnormal distribution of cathepsin L. Neuroscience letters. 2011;489:62-7
28. Ueno T, Takahashi K. A cathepsin L-specific inhibitor preferentially inhibits degradation of autophagosomal LC3 and GABARAP in HeLa and Huh-7 cells. Autophagy. 2009;5:878-9
29. Huo FC, Pan YJ, Li TT, Mou J, Pei DS. PAK5 promotes the migration and invasion of cervical cancer cells by phosphorylating SATB1. Cell death and differentiation. 2018
30. Mizushima N, Yoshimori T, Levine B. Methods in mammalian autophagy research. Cell. 2010;140:313-26
31. Li L, Gao L, Song Y, Qin ZH, Liang Z. Activated cathepsin L is associated with the switch from autophagy to apoptotic death of SH-SY5Y cells exposed to 6-hydroxydopamine. Biochemical and biophysical research communications. 2016;470:579-85
32. Nagakannan P, Eftekharpour E. Differential redox sensitivity of cathepsin B and L holds the key to autophagy-apoptosis interplay after Thioredoxin reductase inhibition in nutritionally stressed SH-SY5Y cells. Free radical biology & medicine. 2017;108:819-31
33. Xu L, Liu JH, Zhang J, Zhang N, Wang ZH. Blockade of autophagy aggravates endoplasmic reticulum stress and improves Paclitaxel cytotoxicity in human cervical cancer cells. Cancer research and treatment: official journal of Korean Cancer Association. 2015;47:313-21
34. Mizushima N, Yoshimori T. How to interpret LC3 immunoblotting. Autophagy. 2007;3:542-5
35. Chen J, Shin JH, Zhao R, Phan L, Wang H, Xue Y. et al. CSN6 drives carcinogenesis by positively regulating Myc stability. Nature communications. 2014;5:5384
36. Mao JH, Kim IJ, Wu D, Climent J, Kang HC, DelRosario R. et al. FBXW7 targets mTOR for degradation and cooperates with PTEN in tumor suppression. Science (New York, NY). 2008;321:1499-502
37. Gao S, Fang L, Phan LM, Qdaisat A, Yeung SC, Lee MH. COP9 signalosome subunit 6 (CSN6) regulates E6AP/UBE3A in cervical cancer. Oncotarget. 2015;6:28026-41
38. Choi HH, Guma S, Fang L, Phan L, Ivan C, Baggerly K. et al. Regulating the stability and localization of CDK inhibitor p27(Kip1) via CSN6-COP1 axis. Cell cycle (Georgetown, Tex). 2015;14:2265-73
39. Choi HH, Gully C, Su CH, Velazquez-Torres G, Chou PC, Tseng C. et al. COP9 signalosome subunit 6 stabilizes COP1, which functions as an E3 ubiquitin ligase for 14-3-3sigma. Oncogene. 2011;30:4791-801
40. Zhao R, Yeung SC, Chen J, Iwakuma T, Su CH, Chen B. et al. Subunit 6 of the COP9 signalosome promotes tumorigenesis in mice through stabilization of MDM2 and is upregulated in human cancers. The Journal of clinical investigation. 2011;121:851-65
41. Pandey S, Chandravati. Autophagy in cervical cancer: an emerging therapeutic target. Asian Pacific journal of cancer prevention: APJCP. 2012;13:4867-71
42. Yang Y, Yu L, Li J, Yuan YH, Wang XL, Yan SR. et al. Autophagy regulates the stemness of cervical cancer stem cells. Biologics: targets & therapy. 2017;11:71-9
43. Wei DH, Jia XY, Liu YH, Guo FX, Tang ZH, Li XH. et al. Cathepsin L stimulates autophagy and inhibits apoptosis of ox-LDL-induced endothelial cells: potential role in atherosclerosis. International journal of molecular medicine. 2013;31:400-6
44. Brix K, Dunkhorst A, Mayer K, Jordans S. Cysteine cathepsins: cellular roadmap to different functions. Biochimie. 2008;90:194-207
45. Nakagawa T, Roth W, Wong P, Nelson A, Farr A, Deussing J. et al. Cathepsin L: critical role in Ii degradation and CD4 T cell selection in the thymus. Science (New York, NY). 1998;280:450-3
46. Gocheva V, Zeng W, Ke D, Klimstra D, Reinheckel T, Peters C. et al. Distinct roles for cysteine cathepsin genes in multistage tumorigenesis. Genes & development. 2006;20:543-56
47. Yu S, Yu Y, Zhang W, Yuan W, Zhao N, Li Q. et al. FOXO3a promotes gastric cancer cell migration and invasion through the induction of cathepsin L. Oncotarget. 2016;7:34773-84
48. Laplante M, Sabatini DM. Regulation of mTORC1 and its impact on gene expression at a glance. Journal of cell science. 2013;126:1713-9
49. Lin Q, Dai Q, Meng H, Sun A, Wei J, Peng K. et al. The HECT E3 ubiquitin ligase NEDD4 interacts with and ubiquitylates SQSTM1 for inclusion body autophagy. 2017; 130: 3839-50.
50. Lee Y, Chou TF, Pittman SK, Keith AL, Razani B, Weihl CC. Keap1/Cullin3 Modulates p62/SQSTM1 Activity via UBA Domain Ubiquitination. Cell reports. 2017;19:188-202
51. Peng H, Yang J, Li G, You Q, Han W, Li T. et al. Ubiquitylation of p62/sequestosome1 activates its autophagy receptor function and controls selective autophagy upon ubiquitin stress. Cell research. 2017;27:657-74
52. Sun A, Wei J, Childress C, Shaw JHt, Peng K, Shao G. et al. The E3 ubiquitin ligase NEDD4 is an LC3-interactive protein and regulates autophagy. Autophagy. 2017;13:522-37
53. Sugawara K, Suzuki NN, Fujioka Y, Mizushima N, Ohsumi Y, Inagaki F. The crystal structure of microtubule-associated protein light chain 3, a mammalian homologue of Saccharomyces cerevisiae Atg8. Genes to cells: devoted to molecular & cellular mechanisms. 2004;9:611-8
54. Klionsky DJ, Abdelmohsen K, Abe A, Abedin MJ, Abeliovich H, Acevedo Arozena A. et al. Guidelines for the use and interpretation of assays for monitoring autophagy (3rd edition). Autophagy. 2016;12:1-222
Author contact
![]() Corresponding authors: Yu-Sen Gong & Dong-Sheng Pei, Address: Laboratory of Clinical and Experimental Pathology, Xuzhou Medical University, Xuzhou 221004, Jiangsu, China. Tel: +86-0516-85582513; E-mail: 2035214353com; dspeiedu.cn
Corresponding authors: Yu-Sen Gong & Dong-Sheng Pei, Address: Laboratory of Clinical and Experimental Pathology, Xuzhou Medical University, Xuzhou 221004, Jiangsu, China. Tel: +86-0516-85582513; E-mail: 2035214353com; dspeiedu.cn