Impact Factor ISSN: 1449-2288
- Issue 12; 2026
- Issue 11; 2026
- Issue 10; 2026
- Issue 9; 2026
- Issue 8; 2026
- Volume 22; 2026
- Past Issues
- Advance Articles
- Editorial Board
- Cover Images
- Index & Coverage
- Cover Suggestion
- Special Issues
Introduction
Single-Cell Spatial...
Physically Segmenting Cells...
Other Advances in Single-Cell...
Conclusion and Future Prospects
Abbreviations
Acknowledgements
References
Author Biography

 Global reach, higher impact
Int J Biol Sci 2020; 16(14):2663-2674. doi:10.7150/ijbs.43887 This issue Cite
Research Paper
Encoding Method of Single-cell Spatial Transcriptomics Sequencing
Ying Zhou1, Erteng Jia1, Min Pan2, Xiangwei Zhao1, Qinyu Ge1 ![]()
1. State Key Laboratory of Bioelectronics, School of Biological Science & Medical Engineering, Southeast University, Nanjing 210096, China.
2. School of Medicine, Southeast University, Nanjing 210097, China.
Received 2020-1-16; Accepted 2020-7-20; Published 2020-7-30
Abstract

Despite significant advances in parallel single-cell RNA sequencing revealing astonishing cellular heterogeneity in many tissue types, the spatial information in the tissue context remains missing. Spatial transcriptome sequencing technology is designed to distinguish the gene expression of individual cells in their original location. The technology is important for the identification of tissue function, tracking developmental processes, and pathological and molecular detection. Encoding the position information is the key to spatial transcriptomics because different methods have different encoding efficiencies and application scenarios. In this review, we focus on the latest technologies of single-cell spatial transcriptomics, including technologies based on microwell plates, barcoded bead arrays, microdissection, in situ hybridization, and barcode in situ targeting, as well as mixed separation-based technologies. Moreover, we compare these encoding methods for use as a reference when choosing the appropriate technology.
Keywords: Single-cell RNA sequencing, Spatial transcriptomics, Encoding method, In situ sequencing
Introduction
About a century ago, Rudolph Virchow, who was the founder of modern pathology, postulated that all diseases originate in cells and thus started the cellular era [1]. Tissues consist of multiple cell types and each type has a particular lineage and function that contributes to the organ's biology. What's more, subgroups of cells of the same type are usually genetically heterogeneous with each other as well as other cell types [2]. As a result, single-cell sequencing has emerged to study the heterogeneity of cells. Differential expression of genes in various cell types with a common genome is a feature of complex cellular functions and the basis of multicellular organisms. Identifying the spatial organization of tissue at the cellular resolution from a single cell's gene expression profile is of great importance for understanding biological systems. In recent years, a number of single-cell RNA sequencing (scRNA-seq) methods have been developed, which have dramatically advanced in scale and power [3]. Among them, methods based on plates are low throughput and distribute a single cell per well of multi-well plates. In contrast, methods based on beads are high throughput and sort a cellular suspension into a tiny droplet or a well that contains the reagent and a barcoded bead. What's more, combinatorial indexing methods are scalable without physically isolating individual cells [4].
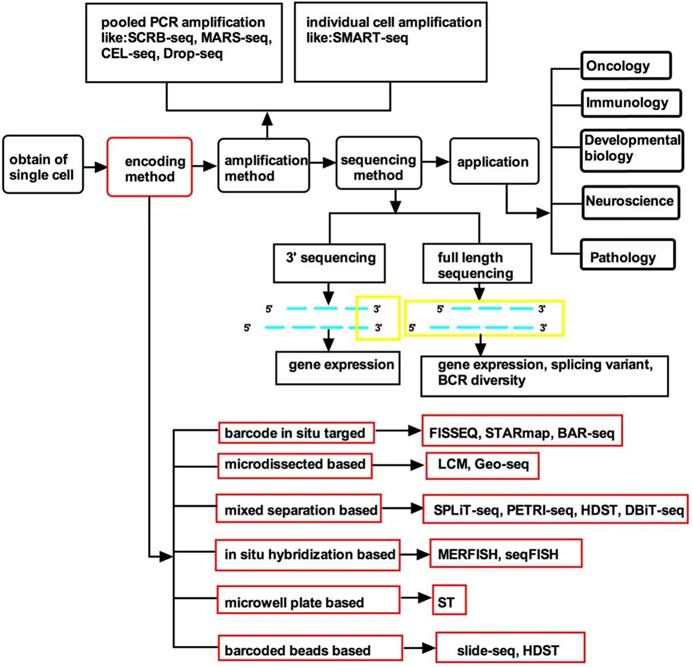
The spatial resolution of gene expression in complex biological tissues can be conventionally analyzed by in situ hybridization or immunohistochemistry [5]. However, these technologies can only be used to analyze a small number of genes at one time with low throughput. Recently, advances in RNA sequencing have enabled the high-throughput analysis of the expression of many genes. The high throughput of RNA sequencing and the advantages of traditional spatially resolved technologies can be combined in spatial transcriptomics, which can collect mRNA data with a massive throughput. Spatial transcriptomics spatially and quantitatively detect differences in gene mRNA expression between separate tissue regions and enable a new type of bioinformatics analysis [6, 7]. In addition, the gene expression of specific cells defines the state and type of the cells and the spatial organization which is closely related to the normal tissues' development and function, and thus also the pathogenesis and prognosis [8, 9]. Therefore, the ability to perform single-cell profiling with spatially resolved transcriptomes will provide tissue biology with critical insights. There have already been some excellent reviews on single-cell spatial transcriptomics which have introduced the various technologies that can realize spatial transcriptomics [8, 10], the spatial transcriptomics of tissue-level systems [11], the challenges of spatial transcriptomics [12], the basic sample preparation and data analysis process [13], and how to use scRNA-seq and single-molecule fluorescence in situ hybridization (smFISH) to understand the brain [14]. However, there is no article summarizing the specific field of the encoding methods of spatial transcriptomics. Single-cell spatial transcriptomic technologies include cell acquisition, location information encoding, amplification, cell library sequencing, and, finally, the application of the technology in different fields. The method of position information encoding is the key to spatial transcriptomics because different methods have different encoding efficiencies and applications. Here, we systematically summarize the encoding methods of state-of-the-art single-cell spatial transcriptomics and provide a comprehensive guide to choosing appropriate technologies (Figure 1, Table 1).
Flow diagram of single-cell spatial transcriptomics. The content discussed in this article is highlighted with a red border. Abbreviations: ST: spatial transcriptomics. HDST: high-definition spatial transcriptomics. SPLiT-seq: split-pool ligation-based transcriptome sequencing. Geo-seq: geographical position sequencing. UEI: unique event identifier. DBiT-seq: Deterministic Barcoding in Tissue for spatial omics sequencing. MERFISH: Multiplexed error-robust FISH. seqFISH: Sequential barcoded Fluorescence in situ Hybridization. FISSEQ: fluorescent in situ RNA sequencing. STARmap: spatially-resolved transcript amplicon readout mapping. BAR-seq: barcoded anatomy resolved by sequencing.
Recent technology for single-cell spatial transcriptomics
| Published time | Target | Single cell | Spatial resolution | Coding method | The type of technology | Efficient | Cost | |
|---|---|---|---|---|---|---|---|---|
| FISSEQ | 2015 | RNA | Yes | subcellular | Padlock probe | Barcode In situ Targeted | 0.005% | NA |
| Geo-seq | 2017 | RNA; DNA | Yes | cellular | zip-code mapping | Microdissected based | NA | NA |
| SPLiT-seq | 2018 | RNA | Yes | cellular | Four barcode combination | Mixed separation based | NA | $0.01/cell |
| STARmap | 2018 | RNA | Yes | subcellular | Barcoded SNAIL probes | Barcode In situ Targeted | 5-40% | NA |
| seqFISH | 2018 | RNA | Yes | subcellular | Probe hybridization | In situ Hybridization based | 84% | expensive |
| merFISH | 2019 | RNA | Yes | subcellular | Probe hybridization | In situ Hybridization based | 80% | expensive |
| ST | 2016; 2018 | RNA | Yes | cellular, 100 µm | Barcoded microarray slide | Microwell plate based | 6.9% | ~$650/plate |
| Slide-seq | 2019 | RNA | Yes | cellular, 10 µm | barcoded beads | Barcoded beads based | 2.7% | ~$200 to $500 for the pucks |
| HDST | 2019 | RNA | Yes | subcellular, 2 µm | barcoded beads | Barcoded beads and mixed separation based | 1.3% | NA |
| DBiT-seq | 2019 | RNA; DNA, protein | Yes | cellular, 10 µm | AiBj | Mixed separation based | NA | NA |
| BAR-seq | 2019 | RNA; DNA, protein | Yes | cellular | rolony | Barcode In situ Targeted | 30% | $50 neurons per cortical area |
| PETRI-seq | 2020 | RNA | Yes | cellular | In situ combinational indexing | Mixed separation based | 2.5~10% | $0.056/cell |
Single-Cell Spatial Transcriptomics of Complete Samples
Microwell plate-based technologies
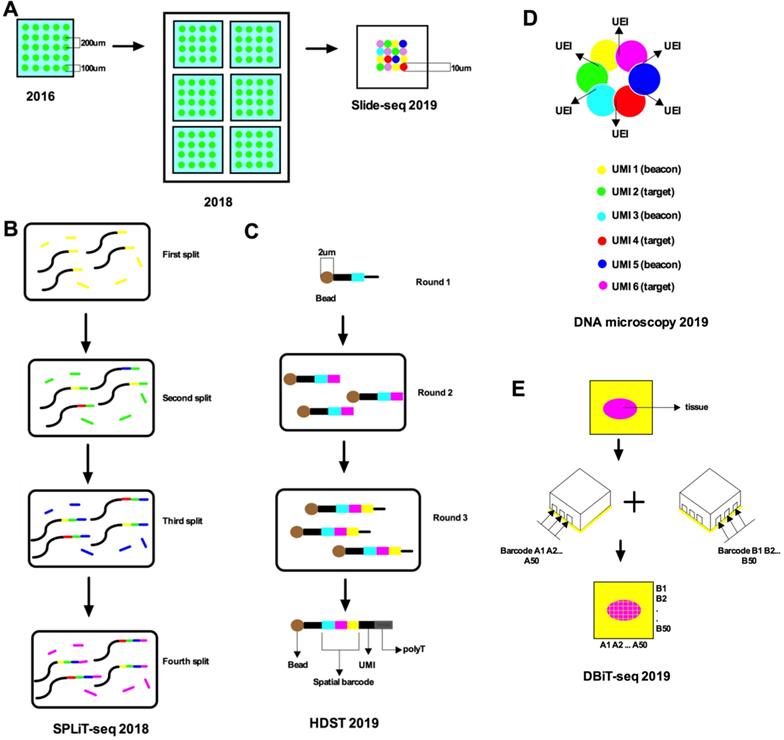
A recently popular spatial transcriptomic method is capturing the mRNA from tissue sections using a patterned microarray equipped with barcoded oligo-dT primers [7]. Such research has demonstrated high-quality RNA sequencing and two-dimensional location information from mouse brain and human breast cancer by placing reverse transcription arrayed primers with distinctive location barcodes on histological sections (Figure 2A). In the context of complete tissue sections, positional molecular barcodes in the cDNA synthesis reaction are introduced before the RNA sequence. Fluorescent cDNA is synthesized with Cy3-labeled nucleotides, which are revealed after removing the tissues. This method catches the mRNA in tissue slices with minimal diffusion and then spatial information is revealed by the arrayed oligo-dT primers with location barcodes. Each array device contains a DNA barcode probe including a T7 amplification site, a cleavage site, a spatial barcode, a unique molecular identifier (UMI), oligo-dT VN (V is anything but T and N is any nucleotide), and a sequencing handle. Finally, principal component analysis or t-distributed stochastic neighbor embedding (t-SNE)[15] and machine learning algorithms for dimensionality decrease and hierarchical clustering are used. Barcoded microplates are used in which the well diameter is 100 µm, enabling each well to capture 10-40 cells. However, the sensitivity of this technique was only 6.9% of single-molecule fluorescence in situ hybridization (smFISH). The decoding method of this technology mainly uses sequencing-by-ligation (SBL). Specifically, this technique encodes a unique barcode probe on a microplate and can be decoded before sample preparation to facilitate the interpretation of subsequent results.
Schematic of recent advances in single-cell spatial transcriptomics. A. Stahl et al. (2016) used a barcoded microplate with a diameter of 100 μm and a center-to-center distance of 200 μm, over an area of 6.2 mm by 6.6 mm. Stahl et al. (2018) used barcoded oligo-dT microarray slides divided into six subarrays, each with a size of 6.2 × 6.6 mm. Each subarray contains 1,007 circular spatial spots, each with a unique spatial barcode and an approximate diameter of 100 µm; the spots are also arranged with a center-to-center distance of 200 µm. Slide-seq (2019) used DNA-barcoded beads to reduce the spatial resolution to 10 µm. B. SPLiT-seq labeled transcriptomes with split-pool barcoding. In each split-pool round, fixed cells or nuclei are randomly distributed into wells, and transcripts are labeled with well-specific barcodes. Barcoded RT primers are used in the first round. Second- and third-round barcodes are appended to cDNA through ligation. A fourth barcode is added to cDNA molecules by PCR during sequencing library preparation. C. HDST deposits barcoded poly(d)T oligonucleotides into 2-μm wells with a randomly ordered bead array-based fabrication process and decodes their positions by a sequential hybridization and error-correcting strategy. Three rounds of split-and-pool were performed to produce a bead pool with 65×211×211 different oligonucleotide combinations. D. It shows the manner in which the DNA microscopy reaction encodes spatial location. Diffusing and amplifying clouds of UMI-tagged DNA overlap to extents that are determined by the proximity of their centers. UEIs between pairs of UMIs occur at frequencies determined by the degree of diffusion cloud overlap. E. DBiT-seq used two sets of barcodes A1-A50 and B1-B50 followed by ligation in situ yields a 2D mosaic of tissue pixels, each containing a unique combination of full barcode AiBj (i=1-50, j=1-50).
Comparing spatial transcriptomics (ST) [7] with the microwell-seq published by Ham in 2018 [16], although both use microwell arrays, the former uses a barcoded capture probe and intact tissue for capture, while the latter uses barcode beads to analyze single cells. Each oligonucleotide of the latter consists of a primer sequence, cell barcode, UMI, and a poly-T tail. The barcode beads are synthesized using three split-pool rounds to introduce three parts of oligonucleotides into the microbeads. In the first split cell cycle, carboxyl-coated magnetic beads are randomly distributed into 96-well plates in which 5' amino-modified oligonucleotides are conjugated to the beads. The oligonucleotide in each well has a unique barcode sequence. The beads are then combined and divided into another 96-well plate, where a second barcode sequence is introduced by single-cycle PCR. In the final split-pool round, a third barcode sequence, a UMI, and a poly-T tail are added. After splitting the pool, all oligonucleotides on the same bead will have the same cell barcode but different UMIs, and oligonucleotides on different beads will have different cell barcodes. In general, the encoding method of ST relies on the known probes on microplates and decoding by SBL, while the encoding method of the microwell-seq combines the principle of mixed separation-based technologies.
Stahl made a breakthrough in spatial transcriptomics and presented a protocol that applies spatial transcriptomic technology to mammalian tissues in 2018 [6] (Figure 2A). The protocol combined histological staining and spatially resolved RNA-seq data from a complete tissue section. Their strategy was based on the ingenious concept of immobilizing cDNA synthesis primers on microscope slides. They assigned primers with a single barcode on a microscope slide to make a microarray. Next, they placed a portion of the tissue on the surface of the microarray where the transcripts in the tissue were reverse transcribed from fixed cDNA synthesis primers. The resulting cDNA library was sequenced and the information was visualized by high-resolution histological imaging of tissue sections. They used the same microplates as before, but each barcoded oligo-dT microarray slide had six sub-arrays [7]. The 5' end of each probe is affiliated to a microarray slide and has a segment of deoxy uridine base, which is cleaved after the probe releases. The probe is the key to the encoding of this technology and allows users to locate individual cells back to a spatial position without having to know the expressed genes in advance. Every poly capture segment consists of a UMI, a position barcode, and a library adapter sequence. Significantly, the spatial data is retained by the location barcode. This method can also be combined with the scRNA-seq of cells isolated from adjacent tissue sections [17, 18].
The fundamental mechanism for these NGS-based spatial transcriptomics approaches can be termed barcoded solid-phase RNA capture [19]. This is a promising method, and despite the current low resolution and spatial coverage, it enables non-specialized laboratories to perform robust spatial transcriptomics research in tissues. It uses a DNA barcode dot array or barcode bead array to capture mRNA from a fresh tissue section and then lyses to release the mRNA. This method results in a greatly simplified workflow when compared to FISSEQ and seqFISH. The advantage of this technology is that it can analyze the whole mRNA and is easy to apply to most high-quality, fresh-frozen tissues, including clinical sections. Its encoding and decoding methods are relatively simple because the encoded microplates can be decoded in situ. This technique is suitable for samples with less structure and a high degree of heterogeneity, such as tumors, while tissues with similar morphological structures between adjacent slices are less suitable. Recently, this method has been applied to clinical diseases. Spatial transcriptomics and single-cell RNA-seq has been combined to investigate pancreatic ductal adenocarcinoma (PDAC). The precise composition of different sub-classifications of tumors varies between individuals and so the sub-population composition and spatial positioning of a given patient may be determined with great prognostic value in the future [20].
Barcoded bead array-based methods
Slide-seq was developed to reduce the spatial resolution to 10 μm [21] (Figure 2A). Slide-seq used 10 μm microparticles named “beads” and in situ decoding was performed using sequencing by oligonucleotide ligation and detection (SOLiD). The spatial position of the cells on the slice was determined according to the sequence decoded. Slide-seq can provide a scalable way to obtain spatially resolved gene expression data with near single-cell resolution. Slide-seq uses a self-assembled monolayer membrane of DNA barcode beads on a glass slide to capture mRNA released from a tissue section [21]. A “puck” was used to develop high-throughput sequencing for whole genomic expression analysis [22]. SOLiD can be used to chemically determine the different barcode sequences of each bead [23]. The advantage of Slide-seq is that it can perform spatial analysis of gene expression in frozen tissues and has high scalability and spatial resolution for large tissue volumes. Slide-seq integrates easily with large-scale single-cell sequencing data sets and spatially defines gene expression in both diseased and normal tissues.
However, this emerging method still has several limitations. For example, decoding the DNA barcode bead array is by manual sequential hybridization or SOLiD sequencing, similar to seqFISH, which requires a long and repeated imaging process. In addition, the number of genes detected from Slide-seq data with a resolution of 10-μm is very low and, therefore, it is difficult to visualize the spatial expression of individual genes even when collective gene sets can locate the main types of cells. What's more, these methods are all based on the same mechanism, i.e., barcoded solid-phase RNA capture, and the newly sectioned tissue must be carefully transferred to the network of beads or spots and lysed to release the mRNAs. Although mRNAs are likely to be captured only by the beads or probes, the lateral spread of free mRNAs is inevitable. In addition, the operation of slide-seq is relatively cumbersome, which leads to loss of expression information. The information obtained on a single spot is limited, which will limit the application, and how to extend it to other omics measurements remains unclear.
Technologies involving mixed separation
In addition to these methods, there is also a scRNA-seq method that uses split-pool to mark the cellular origin of RNA by combining barcode encoding [24]. Split-pool ligation-based transcriptome sequencing (SPLiT-seq) does not require dividing individual cells into separate sections, like droplets or microwells, but depends on the cells themselves in sections (Figure 2B). The complete workflow before sequencing includes only pipetting steps. SPLiT-seq is compatible with fixed cells or nuclei for efficient sample multiplexing without the need for custom equipment. Each transcriptome is uniquely labeled by encoding a formaldehyde-fixed cell or nucleus suspension through a four-round combination barcode. In every split cell round, fixed cells or nuclei are unsystematically assigned to the wells and the transcripts are marked with well-specific barcodes. Barcode RT primers are used in the first cycle. In the second and third cycles, barcodes are attached to the cDNA by ligation. Through sequencing library preparation, a barcode is added to the cDNA molecule by PCR in the fourth cycle. Lastly, every transcriptome is assembled by combining reads covering the four-barcode combination.
In 2019, high-resolution spatial transcriptomics (HDST) was discovered, which can capture RNA from histological sections on a spatial barcode bead array [25] (Figure 2C). Millions of transcript-coupled spatial barcodes are recovered with a resolution of 2-μm, as confirmed in primary breast cancer and mouse brain cancer. Frozen tissue sections are placed on decoded slides, stained, and imaged, and then the RNA is captured and analyzed. To produce high-resolution, high-density bead arrays, a pooling method is used to generate millions of individual barcoded beads, which are unsystematically placed on a hexagonal array of more than 1.4 million 2-μm wells. The position of each bead is decoded by hybridization cycles. Each barcode and bead receives an exclusive spatial color address, which can create an array in a total processing time of ~3 hours. The decoding method proceeds as published before [26], resulting in each well location being encoded with a three-color combination, including FAM, Cy3, and dark. A manufacturing process based on randomly arranged magnetic bead arrays was used to deposit barcoded poly(d)T oligonucleotides into 2-μm wells and their positions were decoded through sequential hybridization and error correction strategies. Simply put, the encoding method of this technology combines the principle of barcoded beads and SPLiT-seq. The main advantage of this technology is the resolution, which is 1400 times higher than ST and 25 times higher than Slide-seq.
There are many kinds of innovative technologies that use the principle of split-pool to encode. For example, prokaryotic expression profile through in situ labeled RNA and sequencing (PETRI-seq) [27] uses in situ combined indexing to encode barcode transcripts of cells in a single experiment. The technology encodes the barcode through three rounds of 96-well-plate split pools. After the barcode is encoded, the cells are lysed to release the cDNA, which is used for Illumina sequencing. With only a pipetting step and no complicated instruments, a single transcriptome of fixed cells can be uniquely labeled by multiple rounds of splitting, barcode encoding, and merging in microplates. In fact, single-cell combined index RNA sequencing (sci-RNA-seq) [28] and SPLiT-seq [24] are similar in principle. They both rely on cells as part of the barcode, eliminating the need for cell lysis in droplets or microwells, and have the advantages of low cost and high throughput.
Microfluidic deterministic barcoding in tissue for spatial omics sequencing (DBiT-seq) [29] (Figure 2E) is a fundamentally new scRNA-seq technology but contains similar decoding steps to mixed separation. The two sets of barcodes A1-A50 and B1-B50 crossed flowing, and are then connected in situ to generate a two-dimensional mosaic of tissue pixels. Each mosaic contains a distinct combination of the complete barcode AiBj (i and j are both from 1 to 50). DBiT-seq allows barcode encoding of mRNA, protein, or even other omics on fixed tissue slides at the same time, thus enabling next-generation sequencing to build multi-omics atlas with high spatial resolution. This technology does not require any DNA dot microarrays or decoded DNA barcode bead arrays, but only a series of reagents. It works with existing fixed tissue slides and does not require freshly prepared tissue sections. Barcode A (with fluorophore Cy3) and barcode B (with fluorophore FITC) are combined and the tissue at 50-μm-pixel resolution is imaged through DBiT-seq. The theoretical boundary of the spatial resolution of DBiT-seq is nearly 2-μm and it can simultaneously measure the mRNA transcriptome and fix tissue slides with high spatial resolution in an unbiased manner. Its encoding method uses combined codes, which are divided into vertical and horizontal axes for decoding.
Physically Segmenting Cells Using Innovative Methods
The most critical step in single-cell research is to effectively capture the single cells of interest. Methods include micro pipetting and microfluidic separation, which often comprehensively depends on mechanical or enzymatic hydrolysis of cell masses or tissues into a single-cell suspension. As a result, any location information of the cell will be lost. Laser capture microdissection (LCM) can accurately capture target cells while retaining the structural and spatial data. Geographical position sequencing (Geo-seq) [30] is the combination of LCM and traditional single-cell RNA-Seq to realize spatial transcriptome sequencing. The spatial transcriptome at single-cell resolution is obtained by the sequencing of a small number of cells with spatial information. Geo-seq has been used to study the spatial transcriptome of early mouse embryos [31], and pathological liver and mouse brains (data not shown) [30]. Geo-seq can build a three-dimensional transcriptome atlas using the spatial information to display the transcriptome in space and quantity. Geo-seq can compute the single-cell location address unsystematically using the zip-code mapping protocol. However, this technology only allows transcriptome data to be extracted from a small number of cells while retaining the original spatial information.
There are clear differences between Geo-seq and Slide-seq. The throughput of Geo-seq is relatively low and gene expression information is unknown before LCM. The throughput of Slide-seq is high, and it hybridizes probes with known information to the sample. What's more, Geo-seq uses LCM to capture single cells, which is more sensitive than Slide-seq. GEO-seq is highly operable, but the accuracy of spatial information will be subject to data analysis methods. The sensitivity of Slide-seq is relatively low at only 2.7% (Table 1). In order to improve the sensitivity, Slide-seq2 was developed, which increases the sensitivity by an order of magnitude. The enhanced capture efficiency of Slide-seq2 combined with its near single-cell resolution may be used to explore the spatial development of the entire tissue.
Other Advances in Single-Cell Spatial Transcriptomics
Progress of assistive tools
Despite the tremendous progress made in the molecular profiling of cellular components relying on optical microscopy or direct physical registration, their spatial localization is still a disconnected and mechanically intensive and specialized process. In 2019, Joshua proposed a DNA microscopy technology that enables scalable non-optical imaging of the relative positions of biomolecules [32]. Transcript molecules are labeled in situ with random nucleotides by DNA microscopy. Neighboring regions of the molecule from these tandem sequences are decoded by an algorithm. The image of the original transcript is inferred at cellular resolution with precise sequence data. Since its imaging capabilities are derived completely from diffusion molecular dynamics, DNA microscopy establishes a chemically encoded microscope system. The coded microscopy uses a unique event identifier (UEI) (Figure 2D). The extent to which UMI-tagged DNA diffuses and magnifies the cloud depends on the proximity to its center. The UEI between the paired UMIs occurs at a frequency related to the degree of overlap of the diffusion clouds. The frequencies are read by DNA sequencing and inserted into the UEI matrix. Then, UEI is used to infer the UMI location. The DNA microscope can encode the spatial location but it has limited targets and, so far, has not been widely used. There are numerous other advances in this field that are not described here in detail [33]. The development of these auxiliary tools will help us to understand and apply single-cell spatial transcriptomics.
Fluorescence in situ hybridization (FISH)-based technologies
The era of spatial transcriptomic dates back to the advances in smFISH [34]. By imaging a single RNA molecule in a single cell directly, smFISH can both measure RNA expression quantitatively and provide information of the spatial localization. An individual transcript can be imaged as a diffraction-limited spot using fluorescent microscopy and has been applied to mammal tissues and cells [35], where the cellular subpopulations and spatial heterogeneity can be characterized [36]. Cai and colleagues created a smFISH probe library with four unusual versions, each with indistinguishable probe sets [37]. These advanced smFISH methods use a multiplexed approach that combines a successive series of hybridization, detection, and pickling to detect thousands of gene expression targets in tissue sections [38]. smFISH can detect RNA in its natural spatial setting through construction[39]. Its disadvantage is the high cost and long time. Early attempts were based on multiplex smFISH through spectral barcodes and sequential imaging [40, 41]. In the past few years, smFISH has rapidly developed from the detection of a few genes to millions, for example, sequential barcoded fluorescence in situ hybridization (seqFISH) [42] and multiplexed error-robust fluorescence in situ hybridization (MERFISH) [39], and recently to the entire transcriptome level, for example, SeqFISH+ [42, 43]. Compared with the traditional in situ hybridization technology, smFISH has higher accuracy and a wider dynamic range and so it can accurately infer spatial information with fewer marker genes. smFISH, and its multiplex variants MERFISH [44] and seqFISH [43], all provide excellent sensitivity and single-cell resolution.
The problem of the combination smFISH is the robustness against read errors and MERFISH has been developed to overcome this problem. It ensures a sequence of barcodes for different genes and only multiple read errors could cause assignment errors [39] (Figure 3A). Besides, an ingenious scheme of two hybridization stages used by MERFISH lowered the cost of the synthesis of fluorescent probes and the time of hybridization circles. MERFISH assigns error-resistant barcodes to separate RNA species and labels RNA with oligonucleotides representing each barcode. As a result, it can be used for single-cell transcriptome profiling in tissue segments [45]. Specifically, MERFISH encodes individual RNA species using error-resistant barcodes and physically imprints barcodes on RNA using combinatorial oligonucleotide labeling, and then measures the barcodes through a series of images of single cells at the transcriptome scale [46]. The disadvantages of MERFISH are that it requires special equipment and is relatively expensive. A 69-bit error-corrected coding scheme (23 hybridization rounds and three-color imaging per round) was used [47]. The coding scheme includes both the “1” (on) and “0” (off) signal in the barcode and allows the fraction of “1” bits to be changed by altering the number of hybridization circles. When the number of “1” bits of each barcode remains the same, the two strategies (sample expansion or hybridization number increase) will increase the imaging time by achieving the same amount of diluted RNA spot density [38, 42]. MERFISH enables the profiling of spatially resolved gene expression of individual cells within a complete biological sample through assigning error-robust barcodes to single RNA species.
Imaging-based methods for single-cell spatial transcriptomics. A. Hybridization of the sample with readout probes complementary to the encoding-probe readout sequences that correspond to the first three bits of the MERFISH barcodes, and imaging of these readout probes in three distinct color channels, cleaving the dye off the readout probe, hybridization and imaging of the next set of readout probes corresponding to the next three bits, and iterate this process until all bits are measured. The RNA signals and registration of decoded RNAs and the immunofluorescence image of the cellular structure are decoded finally. B. seqFISH uses temporal barcodes, in which the combination of signal across all cycles is specific to each target. C. FISSEQ uses padlock probes to target specific mRNAs, with cDNA synthesis and rolling-circle amplification in situ, followed by sequencing by ligation, but reverse-transcribes RNA in an unbiased manner. D. STARmap uses sequencing to multiplex read out of hybridization signals. E. BAR-seq copies target sequences from the mRNA into the rolonies to allow true sequencing.
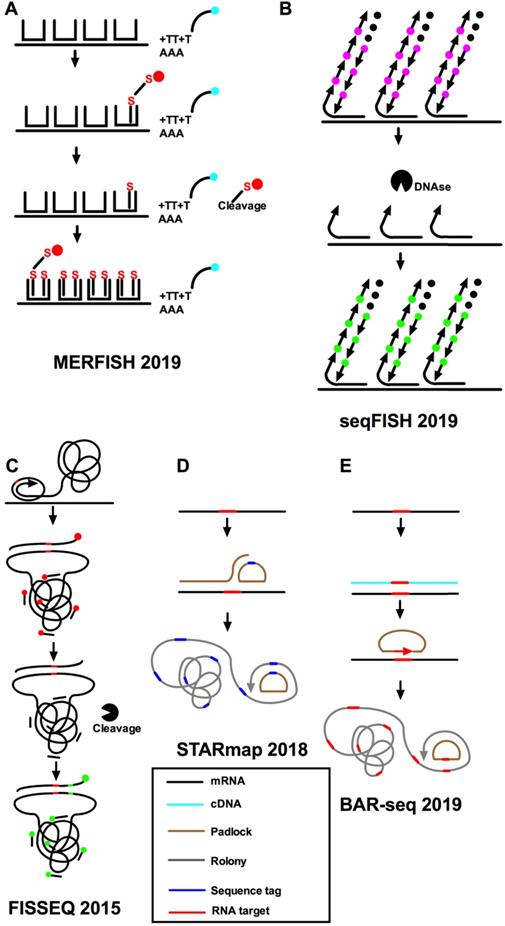
A time-barcoded scheme was established to overcome scalability issues that used a series of limited fluorophores. SeqFISH can scale exponentially over time [37, 42] (Figure 3B). A color sequence at the known location offers the barcode reading of that mRNA, just as barcode synthesis. The barcodes are identified and quantified by reference to a lookup table to achieve single-cell expression. In addition, single-molecule hybridization chain reaction (smHCR), an amplified version of smFISH, can overcome the auto-fluorescence and scattering in the brain [48, 49]. DNase strips the smHCR probe from the target mRNA after imaging, which makes re-hybridization on the same mRNA possible. The color of mRNA can be adjusted through the hybridization probe [50]. After hybridization, mRNA is amplified through the addition of complementary hairpin pairs. The round of DNase smHCR is repeated on the similar mRNA to build predefined barcodes, which will change with time. Generally, the hybridization of sequential probes on mRNA in unchanging cells will give an individually predefined color time-series to generate mRNA barcodes in situ. At the core of these methods are complex algorithms that can take into account different sources of experimental variability while inferring location information [11,44]. This technique encodes the readout probes of different colors and decodes them after a series of hybridization rounds. These methods combine the advantages of two aspects: it can perform a deep unbiased analysis of a large number of individual cells and retain the positional information. The use of combinatorial barcodes can target almost any gene, but its disadvantage is that it requires a large number of probes.
Barcode in situ targeted sequencing methods
To supplement multiplex FISH, in situ sequencing (IS-seq) can also be used to perform RNA analysis at the transcriptomic scale of an individual cell. Fluorescence in situ sequencing (FISSEQ) can detect millions of RNAs in a non-targeted manner with low efficiency of detection [12, 51] (Figure 3C) and may lead to bias due to uneven binding efficiency because of variations in the base structure. Lately, another kind of IS-seq, spatially resolved transcript amplicon readout mapping (STARmap), was developed to significantly increase the efficiency [40] (Figure 3D). However, the number of genes that can be detected by fluorescent IS-seq methods is low, and like seqFISH, they require a long time and specialist technology for image processing. The IS-seq method is a complementary technique to reveal intracellular transcriptomes, discover new cell types, identify cells, and to draw maps of cell types within tissues. IS-seq is theoretically like conventional Illumina DNA in vitro sequencing. Several researchers have combined microplates or magnetic beads with known barcode sequence information for encoding. Some extremely sensitive multiplex approaches have been put forward, including STARmap [40], IS-seq [52], MERFISH [38], seqFISH [42], and cyclic single-molecule fluorescent in situ hybridization [53]. All the above approaches lack single nucleotide specificity. In these methods, seqFISH and MERFISH approaches use multiple cycles of hybridization to detect and read multiplex mRNA. STARmap and non-vacuum padlocks use sequencing technologies to multiplex read hybridization signals, or use IS-seq (such as FISSEQ [54]) and barista-seq to copy target sequences from mRNA to rolonies for accurate sequencing. Targeted in situ RNA sequencing was introduced by using padlock probes to initiate targeted cDNA in situ synthesis [52]. The padlock method is like the smFISH method because it targets identified genes. All these approaches use nano-balls to amplify the signals, which limit the amount of transcripts and produce a potential bias in favor of certain transcripts. In general, these methods are encoded by means of nanospheres, and all use the improved SBL chemical method to decode the barcode. However, all of the above methods are technically demanding and require advanced image analyzing processes, high sensitivity optical mapping systems, and long imaging workflows for advanced multiplexing [41]. What's more, all of them involve a limited set of probes that hybridize to identify RNA sequences and these IS-seq approaches also require custom instruments.
Barcoded anatomy resolved by sequencing (BAR-seq) is an IS-seq method based on an RNA barcode to map the projection of millions of spatially resolved neurons [55]. The latest BAR-seq method can be used in conjunction with highly multiplexed FISH or IS-seq methods to predict and correlate the expression of millions of genes. A previously developed sequence-based method was named multiplexed analysis of projections by sequencing (MAP-seq) [56, 57] and enables high-throughput projection mapping. MAP-seq can individually label single neurons with a random RNA sequence or barcode to achieve multiplexing. However, the original MAP-seq protocol depends on tissue homogenization, similar to most other sequencing technologies, and thus it will lose the location information of cells. In this technology, RNAs are converted to cDNAs through reverse transcription, and the cDNAs are then amplified by rolling circle amplification to produce nano-sized balls of DNA called rolonies during the amplification period. The rolonies are sequenced using four fluorescently labeled nucleotides in parallel during the sequencing period. The nucleotide sequence is thus converted into a color sequence and read by a multi-channel fluorescent microscope. BAR-seq combines high-throughput measurements based on cell barcodes, such as high-throughput screening [58], pedigree tracking [59], and projection mapping, with such integrated methods. There are several FISH approaches that read specific genomic tags by sequencing, thus allowing multiplex detection of RNA [38, 48]. However, these methods cannot straightforwardly sequence the specific RNA and are not appropriate for the sequencing of barcodes. In a targeted method called Barista-Seq [60] (Figure 3E), reverse transcription is used to convert the barcode sequence to cDNA followed by hybridization to a padlock probe, filling in the gaps, and then ligation to form a circular pattern for amplification of the rolling circles. However, this technique has quantity limitations due to prior selection of targets.
Conclusion and Future Prospects
Recently, transcriptomics has been developed for single-cell RNA analysis and has revolutionized the study of biology and heterogeneity in single cells in cellular immunity, cancer diagnosis, oncology, stem cells, and development [61-63]. A number of single-cell RNA sequencing strategies with different strengths and effectiveness have been established [64]. However, despite the latest advances in massively parallel scRNA-seq [65], which revealed astonishing cellular heterogeneity in many tissue types [66, 67], the spatial information in the context of tissues is missing from the scRNA-seq data. Therefore, methods have been devised to achieve high-throughput analysis while preserving spatial data about the cellular and subcellular localization.
In this article, we have summarized the latest single-cell spatial transcriptome sequencing technologies and described their encoding methods. There are many types of encoding methods for single-cell spatial transcriptomic sequencing technologies, including microplate-based methods. There are also technologies that use magnetic beads for encoding, split-pool with barcode combination, fluorescent probes for hybridization, padlock probes for in situ encoding, and combination encoding methods using unique location signs, like AiBj, for encoding. Although the encoding methods of these technologies are different, their common goal is to bring the resolution close to the single-cell level and to increase throughput. However, we should not pursue greater resolution excessively. Sometimes the resolution is too low to cause undesirable results. Its effectiveness may decrease with the technical resolution and throughput increase. For example, the resolution of HDST is about 2-μm, but its effectiveness is only 1.3%, while the efficiency of ST can be up to 6.9% (Table 1). Therefore, we must also consider the issue of efficiency while pursuing increased resolution of novel technologies.
Most technologies, such as ST, slide-seq, Geo-seq, MERFISH, and HDST, can only be applied to fresh-frozen samples and only a few, such as LCM and FISSEQ, can be applied to paraffin samples (FFPE) even though FFPE is the normal way to preserve samples in many laboratories. In a recently published article [68], nanoliter array technology was successfully applied to FFPE. The encoding method of this technology is similar to the combination of ST and FISH.
Heterogeneity of spatial gene expression plays a vital role in biological, pathological, and physiological processes, but genome-wide, high spatial resolution, unbiased biomolecular profiling analysis on large areas of tissue is still a challenge. Our main task in the future will be to develop a simple and cheap method that can simultaneously encode and expand whole genomes with spatial resolution while keeping cells and tissues intact for subsequent target analysis. With this expansion of methods and technology, we are confident that single-cell spatial transcriptomics will rapidly improve our understanding of multicellular tissues and organisms in health and disease.
Abbreviations
scRNA-seq: single-cell RNA sequencing; UMI: unique molecular identifier; t-SNE: t-distributed stochastic neighbors embedding; SBL: sequencing-by-ligation; PDAC: pancreatic ductal adenocarcinoma; SOLiD: sequencing by oligonucleotide ligation and detection; NMFreg: Non-Negative Matrix Factorization Regression; SPLiT-seq: Split-pool ligation-based transcriptome sequencing; HDST: high-resolution spatial transcriptomics; PETRI-seq: prokaryotic expression profile through in situ labeled RNA and sequencing; sci-RNA-seq: single-cell combined index RNA sequencing; DBiT-seq: Deterministic Barcoding in Tissue for spatial omics sequencing; LCM: Laser capture microdissection; Geo-seq: geographical position sequencing; UEI: unique event identifier; FISH: fluorescence in situ hybridization; smFISH: single-molecule fluorescence in situ hybridization; seqFISH: sequential barcoded fluorescence in situ hybridization; MERFISH: Multiplexed error-robust fluorescence in situ hybridization; smHCR: single molecule hybridization chain reaction; IS-seq: in situ sequencing; FISSEQ: Fluorescence in situ sequencing; STARmap: spatially resolved transcript amplicon readout mapping; BAR-seq: Barcoded anatomy resolved by sequencing; MAP-seq: multiplexed analysis of projections by sequencing; FFPE: paraffin-embedded; ST: spatial transcriptomic.
Acknowledgements
This work was supported by the National Natural Science Foundation of China (81827901, 61801108).
Authorship contribution
Ying Zhou: Investigation, Writing-original draft, Writing-review & editing. Qinyu Ge: Project administration, Conceptualization, Investigation, Writing-review & editing. Xiangwei Zhao: Project administration. Min Pan: Writing-review & editing. Erteng Jia: Writing-review & editing.
Competing Interests
All of the authors declare that they have no conflict of interest. This article does not contain any studies with human or animal subjects.
References
1. Mazzarello P. A unifying concept: the history of cell theory. NAT CELL BIOL. 1999;1(1):E13-5
2. Engel KL, Mackiewicz M, Hardigan AA, Myers RM, Savic D. Decoding transcriptional enhancers: Evolving from annotation to functional interpretation. SEMIN CELL DEV BIOL. 2016;57:40-50
3. Cembrowski MS. Single-cell transcriptomics as a framework and roadmap for understanding the brain. J NEUROSCI METH. 2019;326:108353
4. Gehring J, Hwee Park J, Chen S, Thomson M, Pachter L. Highly multiplexed single-cell RNA-seq by DNA oligonucleotide tagging of cellular proteins. NAT BIOTECHNOL. 2020;38(1):35-8
5. Armit C, Richardson L, Venkataraman S, Graham L, Burton N, Hill B, Yang Y, Baldock RA. eMouseAtlas: An atlas-based resource for understanding mammalian embryogenesis. DEV BIOL. 2017;423(1):1-11
6. Salmén F, Ståhl PL, Mollbrink A, Navarro JF, Vickovic S, Frisén J, Lundeberg J. Barcoded solid-phase RNA capture for Spatial Transcriptomics profiling in mammalian tissue sections. NAT PROTOC. 2018;13(11):2501-34
7. Stahl PL, Salmen F, Vickovic S. et al. Visualization and analysis of gene expression in tissue sections by spatial transcriptomics. SCIENCE. 2016;353(6294):78-82
8. Crosetto N, Bienko M, van Oudenaarden A. Spatially resolved transcriptomics and beyond. NAT REV GENET. 2015;16(1):57-66
9. Lein E, Borm LE, Linnarsson S. The promise of spatial transcriptomics for neuroscience in the era of molecular cell typing. SCIENCE. 2017;358(6359):64-9
10. Asp M, Bergenstråhle J, Lundeberg J. Spatially Resolved Transcriptomes-Next Generation Tools for Tissue Exploration. BIOESSAYS. 2020 p:1900221
11. Moor AE, Itzkovitz S. Spatial transcriptomics: paving the way for tissue-level systems biology. Curr Opin Biotechnol. 2017;46:126-33
12. Lein E, Borm LE, Linnarsson S. The promise of spatial transcriptomics for neuroscience in the era of molecular cell typing. Science (New York, N.Y.). 2017;358(6359):64-9
13. Kulkarni A, Anderson AG, Merullo DP, Konopka G. Beyond bulk: a review of single cell transcriptomics methodologies and applications. CURR OPIN BIOTECH. 2019;58:129-36
14. Cembrowski MS. Single-cell transcriptomics as a framework and roadmap for understanding the brain. J NEUROSCI METH. 2019;326:108353
15. Mahfouz A, van de Giessen M, van der Maaten L, Huisman S, Reinders M, Hawrylycz MJ, Lelieveldt BP. Visualizing the spatial gene expression organization in the brain through non-linear similarity embeddings. METHODS. 2015;73:79-89
16. Han X, Wang R, Zhou Y. et al. Mapping the Mouse Cell Atlas by Microwell-Seq. CELL. 2018;172(5):1091-107
17. Satija R, Farrell JA, Gennert D, Schier AF, Regev A. Spatial reconstruction of single-cell gene expression data. NAT BIOTECHNOL. 2015;33(5):495-502
18. Achim K, Pettit JB, Saraiva LR, Gavriouchkina D, Larsson T, Arendt D, Marioni JC. High-throughput spatial mapping of single-cell RNA-seq data to tissue of origin. NAT BIOTECHNOL. 2015;33(5):503-9
19. Trcek T, Lionnet T, Shroff H, Lehmann R. mRNA quantification using single-molecule FISH in Drosophila embryos. NAT PROTOC. 2017;12(7):1326-48
20. Moncada R, Barkley D, Wagner F. et al. Integrating microarray-based spatial transcriptomics and single-cell RNA-seq reveals tissue architecture in pancreatic ductal adenocarcinomas. NAT BIOTECHNOL. 2020
21. Rodriques SG, Stickels RR, Goeva A. et al. Slide-seq: A scalable technology for measuring genome-wide expression at high spatial resolution. SCIENCE. 2019;363(6434):1463-7
22. Macosko EZ, Basu A, Satija R. et al. Highly Parallel Genome-wide Expression Profiling of Individual Cells Using Nanoliter Droplets. CELL. 2015;161(5):1202-14
23. Lee JH, Daugharthy ER, Scheiman J. et al. Fluorescent in situ sequencing (FISSEQ) of RNA for gene expression profiling in intact cells and tissues. NAT PROTOC. 2015;10(3):442-58
24. Rosenberg AB, Roco CM, Muscat RA. et al. Single-cell profiling of the developing mouse brain and spinal cord with split-pool barcoding. SCIENCE. 2018;360(6385):176-82
25. Vickovic S, Eraslan G, Salmen F. et al. High-definition spatial transcriptomics for in situ tissue profiling. NAT METHODS. 2019;16(10):987-90
26. Gunderson KL, Huang XC, Morris MS, Lipshutz RJ, Lockhart DJ, Chee MS. Mutation detection by ligation to complete n-mer DNA arrays. GENOME RES. 1998;8(11):1142-53
27. Blattman SB, Jiang W, Oikonomou P, Tavazoie S. Prokaryotic single-cell RNA sequencing by in situ combinatorial indexing. NAT MICROBIOL. 2020
28. Cao J, Spielmann M, Qiu X. et al. The single-cell transcriptional landscape of mammalian organogenesis. NATURE. 2019;566(7745):496-502
29. Yang Liu MYYD. High-Spatial-Resolution Multi-Omics Atlas Sequencing of Mouse Embryos via Deterministic Barcoding in Tissue. bioRxiv. 2019
30. Chen J, Suo S, Tam PP, Han JJ, Peng G, Jing N. Spatial transcriptomic analysis of cryosectioned tissue samples with Geo-seq. NAT PROTOC. 2017;12(3):566-80
31. Peng G, Suo S, Chen J. et al. Spatial Transcriptome for the Molecular Annotation of Lineage Fates and Cell Identity in Mid-gastrula Mouse Embryo. DEV CELL. 2016;36(6):681-97
32. Weinstein JA, Regev A, Zhang F. DNA Microscopy: Optics-free Spatio-genetic Imaging by a Stand-Alone Chemical Reaction. CELL. 2019;178(1):229-41
33. Askary A, Sanchez-Guardado L, Linton JM, Chadly DM, Budde MW, Cai L, Lois C, Elowitz MB. In situ readout of DNA barcodes and single base edits facilitated by in vitro transcription. NAT BIOTECHNOL. 2020;38(1):66-75
34. Raj A, van den Bogaard P, Rifkin SA, van Oudenaarden A, Tyagi S. Imaging individual mRNA molecules using multiple singly labeled probes. NAT METHODS. 2008;5(10):877-9
35. Itzkovitz S, van Oudenaarden A. Validating transcripts with probes and imaging technology. NAT METHODS. 2011;8(4 Suppl):S12-9
36. Bahar HK, Tanami S, Landen S, Chapal M, Szlak L, Hutzler A, Nizhberg A, Itzkovitz S. Bursty gene expression in the intact mammalian liver. MOL CELL. 2015;58(1):147-56
37. Lubeck E, Coskun AF, Zhiyentayev T, Ahmad M, Cai L. Single-cell in situ RNA profiling by sequential hybridization. NAT METHODS. 2014;11(4):360-1
38. Chen KH, Boettiger AN, Moffitt JR, Wang S, Zhuang X. RNA imaging. Spatially resolved, highly multiplexed RNA profiling in single cells. SCIENCE. 2015;348(6233):a6090
39. Moffitt JR, Zhuang X. RNA Imaging with Multiplexed Error-Robust Fluorescence In situ Hybridization (MERFISH). METHOD ENZYMOL. 2016;572:1-49
40. Wang X, Allen WE, Wright MA. et al. Three-dimensional intact-tissue sequencing of single-cell transcriptional states. SCIENCE. 2018;361(6400):t5691
41. Pichon X, Lagha M, Mueller F, Bertrand E. A Growing Toolbox to Image Gene Expression in Single Cells: Sensitive Approaches for Demanding Challenges. MOL CELL. 2018;71(3):468-80
42. Eng CL, Lawson M, Zhu Q. et al. Transcriptome-scale super-resolved imaging in tissues by RNA seqFISH. NATURE. 2019;568(7751):235-9
43. Shah S, Lubeck E, Zhou W, Cai L. seqFISH Accurately Detects Transcripts in Single Cells and Reveals Robust Spatial Organization in the Hippocampus. NEURON. 2017;94(4):752-8
44. Moffitt JR, Hao J, Wang G, Chen KH, Babcock HP, Zhuang X. High-throughput single-cell gene-expression profiling with multiplexed error-robust fluorescence in situ hybridization. Proc Natl Acad Sci U S A. 2016;113(39):11046-51
45. Xia C, Babcock HP, Moffitt JR, Zhuang X. Multiplexed detection of RNA using MERFISH and branched DNA amplification. SCI REP-UK. 2019 9(1)
46. Geiss GK, Bumgarner RE, Birditt B. et al. Direct multiplexed measurement of gene expression with color-coded probe pairs. NAT BIOTECHNOL. 2008;26(3):317-25
47. Xia C, Fan J, Emanuel G, Hao J, Zhuang X. Spatial transcriptome profiling by MERFISH reveals subcellular RNA compartmentalization and cell cycle-dependent gene expression. Proceedings of the National Academy of Sciences. 2019;116(39):19490-9
48. Choi HM, Beck VA, Pierce NA. Next-generation in situ hybridization chain reaction: higher gain, lower cost, greater durability. ACS NANO. 2014;8(5):4284-94
49. Shah S, Lubeck E, Schwarzkopf M. et al. Single-molecule RNA detection at depth by hybridization chain reaction and tissue hydrogel embedding and clearing. DEVELOPMENT. 2016;143(15):2862-7
50. Shah S, Lubeck E, Zhou W, Cai L. In situ Transcription Profiling of Single Cells Reveals Spatial Organization of Cells in the Mouse Hippocampus. NEURON. 2016;92(2):342-57
51. Lee JH, Daugharthy ER, Scheiman J. et al. Highly multiplexed subcellular RNA sequencing in situ. SCIENCE. 2014;343(6177):1360-3
52. Ke R, Mignardi M, Pacureanu A, Svedlund J, Botling J, Wahlby C, Nilsson M. In situ sequencing for RNA analysis in preserved tissue and cells. NAT METHODS. 2013;10(9):857-60
53. Codeluppi S, Borm LE, Zeisel A, La Manno G, van Lunteren JA, Svensson CI, Linnarsson S. Spatial organization of the somatosensory cortex revealed by osmFISH. NAT METHODS. 2018;15(11):932-5
54. Hansen KD, Brenner SE, Dudoit S. Biases in Illumina transcriptome sequencing caused by random hexamer priming. NUCLEIC ACIDS RES. 2010;38(12):e131
55. Chen X, Sun YC, Zhan H. et al. High-Throughput Mapping of Long-Range Neuronal Projection Using In situ Sequencing. CELL. 2019;179(3):772-86
56. Han Y, Kebschull JM, Campbell R, Cowan D, Imhof F, Zador AM, Mrsic-Flogel TD. The logic of single-cell projections from visual cortex. NATURE. 2018;556(7699):51-6
57. Kebschull JM, Garcia DSP, Reid AP, Peikon ID, Albeanu DF, Zador AM. High-Throughput Mapping of Single-Neuron Projections by Sequencing of Barcoded RNA. NEURON. 2016;91(5):975-87
58. Feldman D, Singh A, Schmid-Burgk JL, Carlson RJ, Mezger A, Garrity AJ, Zhang F, Blainey PC. Optical Pooled Screens in Human Cells. CELL. 2019;179(3):787-99
59. Raj B, Wagner DE, McKenna A, Pandey S, Klein AM, Shendure J, Gagnon JA, Schier AF. Simultaneous single-cell profiling of lineages and cell types in the vertebrate brain. NAT BIOTECHNOL. 2018;36(5):442-50
60. Chen X, Sun YC, Church GM, Lee JH, Zador AM. Efficient in situ barcode sequencing using padlock probe-based BaristaSeq. NUCLEIC ACIDS RES. 2018;46(4):e22
61. Shalek AK, Satija R, Adiconis X. et al. Single-cell transcriptomics reveals bimodality in expression and splicing in immune cells. NATURE. 2013;498(7453):236-40
62. van Wolfswinkel JC, Wagner DE, Reddien PW. Single-cell analysis reveals functionally distinct classes within the planarian stem cell compartment. CELL STEM CELL. 2014;15(3):326-39
63. Durruthy-Durruthy R, Gottlieb A, Hartman BH, Waldhaus J, Laske RD, Altman R, Heller S. Reconstruction of the mouse otocyst and early neuroblast lineage at single-cell resolution. CELL. 2014;157(4):964-78
64. Wen L, Tang F. Single-cell sequencing in stem cell biology. GENOME BIOL. 2016;17:71
65. Klein AM, Mazutis L, Akartuna I. et al. Droplet barcoding for single-cell transcriptomics applied to embryonic stem cells. CELL. 2015;161(5):1187-201
66. Cao J, Spielmann M, Qiu X. et al. The single-cell transcriptional landscape of mammalian organogenesis. NATURE. 2019;566(7745):496-502
67. Pijuan-Sala B, Griffiths JA, Guibentif C. et al. A single-cell molecular map of mouse gastrulation and early organogenesis. NATURE. 2019;566(7745):490-5
68. Nagarajan MB, Tentori AM, Zhang WC, Slack FJ, Doyle PS. Spatially resolved and multiplexed MicroRNA quantification from tissue using nanoliter well arrays. MICROSYST NANOENG. 2020 6(1)
Author Biography
 YING ZHOU obtained her bachelor's degree in Clinical Medicine from Wuhan University. She is currently a Ph.D. student in the Department of Bioscience and Medical Engineering of Southeast University under the supervision of Prof. Qinyu Ge. Her research is centered on spatial transcriptomics.
 QINYU GE is a professor of State Key Laboratory of Bioelectronics, School of Biological Science & Medical Engineering, Southeast University. He has successively chaired the National Natural Science Foundation Project, the Ministry of Education Doctoral Fund Project, and the Tsinghua University National Laboratory of Information Science and Technology Support Program and other more than 10 research projects. He has related research results of over 60 SCI publications. The current research interests in Professor Ge's group include practical biochips, high-throughput sequencing, and related applications of circulating nucleic acids in human blood.
 XIANGWEI ZHAO is a professor of State Key Laboratory of Bioelectronics, School of Biological Science & Medical Engineering, Southeast University. He has served as a visiting scholar at the Institute of Laser Engineering at Osaka University in Japan, the Department of Biomedical Engineering at the University of Michigan, the Department of Electronic and Computer Engineering at the University of Illinois at Urbana-Champaign, and the Harvard Medical School. He published more than 50 SCI papers and authorized more than 20 patents. The current research interests in Professor Zhao's group include nanophotonics technology, single cell analysis, POCT, biomedical big data, etc.
![]() Corresponding author: Professor Qinyu Ge, State Key Laboratory of Bioelectronics, School of Biological Science & Medical Engineering, Southeast University, Nanjing 210096, China. E-mail: geqinyuedu.cn.
Corresponding author: Professor Qinyu Ge, State Key Laboratory of Bioelectronics, School of Biological Science & Medical Engineering, Southeast University, Nanjing 210096, China. E-mail: geqinyuedu.cn.