Impact Factor ISSN: 1449-2288
- Issue 12; 2026
- Issue 11; 2026
- Issue 10; 2026
- Issue 9; 2026
- Issue 8; 2026
- Volume 22; 2026
- Past Issues
- Advance Articles
- Editorial Board
- Cover Images
- Index & Coverage
- Cover Suggestion
- Special Issues
Introduction
Materials and Methods
Results
Discussion
Abbreviations
Supplementary Material
Acknowledgements
References

 Global reach, higher impact
Int J Biol Sci 2021; 17(13):3554-3572. doi:10.7150/ijbs.62168 This issue Cite
Research Paper
Identification and Characterization of Alcohol-related Hepatocellular Carcinoma Prognostic Subtypes based on an Integrative N6-methyladenosine methylation Model
Yue Zhang1,2#, Fanhong Zeng1,2#, Min Zeng1,2, Xu Han1,2, Lei Cai1,2, Jiajun Zhang1,2, Jun Weng1,2 ![]() , Yi Gao1,2
, Yi Gao1,2 ![]()
1. Department of Hepatobiliary Surgery II, Guangdong Provincial Research Center for Artificial Organ and Tissue Engineering, Guangzhou Clinical Research and Transformation Center for Artificial Liver, Institute of Regenerative Medicine, ZhuJiang Hospital, Southern Medical University, Guangzhou, Guangdong Province, China.
2. State Key Laboratory of Organ Failure Research, Southern Medical University, Guangzhou, China.
#These authors contributed equally to this work.
Received 2021-5-5; Accepted 2021-8-1; Published 2021-8-14
Abstract

Background: Alcohol consumption increases the risk of hepatocellular carcinoma (HCC), and associated with a high mortality rate and poor prognosis. N6-methyladenosine (m6A) methylations play key roles in tumorigenesis and progression. However, our current knowledge about m6A in alcohol-related HCC (A-HCC) remains elucidated. Herein, the authors construct an integrative m6A model based on A-HCC subtyping and mechanism exploration workflow.
Methods: Based on the m6A expressions of A-HCC and in vivo experiment, different prognosis risk A-HCC subtypes are identified. Meanwhile, multiple interdependent indicators of prognosis including patient survival rate, clinical pathological prognosis and immunotherapy sensitivity.
Results: The m6A model includes LRPPRC, YTHDF2, KIAA14219, and RBM15B, classified A-HCC patients into high/low-risk subtypes. The high-risk subtype compared to the low-risk subtype showed phenotypic malignancy, poor prognosis, immunosuppression, and activation of tumorigenesis and proliferation-related pathways, including the E2F target, DNA repair, and mTORC1 signalling pathways. The expression of Immunosuppressive cytokines DNMT1/EZH2 was up-regulated in A-HCC patients, and teniposide may be a potential therapeutic drug for A-HCC.
Conclusion: Our model redefined A-HCC prognosis risk, identified potential m6As linking tumour progress and immune regulations and selected possible therapy target, thus promoting understanding and clinical applications about A-HCC.
Keywords: Hepatocellular carcinoma, N6-methyladenosine, tumour immune microenvironment, treatment sensitivity, teniposide
Introduction
N6-Methyladenosine (m6A) methylation is the most common post-transcriptional modification, regulating RNA splicing, translocation, stability, and translation into proteins [1, 2]. Enzymes involved in m6A methylation include demethylases (commonly referred as 'erasers'), methylases ('writers'), and methylation recognition enzymes ('readers') [3]. Abnormal activity of m6A-related enzymes can induce numerous pathological responses, including tumour development, immune dysregulation, and embryonic developmental delay [4-6]. Therefore, understanding the m6A alterations can provide meaningful insights into the tumorigenesis, progression and potential therapeutic targets.
Liver cancer is one of the most common cancers and the fourth leading cause of cancer-related deaths, with more than 850,000 annually reported cases worldwide [7-10]. The most common risk factors for HCC are viral infection, alcoholism, and metabolic syndrome [11-13]. Alcohol can significantly increase the release of cytoplasmic mtDNA, thereby activating the cGAS-IRF3 signal, causing liver cell apoptosis and inflammation [14, 15]. Excessive alcohol intake induces a metabolism shift from oxidative metabolism to reductive reaction, which favour the synthesis of fatty acids and promote fatty liver progress, leading to liver cirrhosis and cancer [16, 17]. In addition, chronic alcohol intake can cause reactive oxygen species and DNA damage, and further promote the activation of cancer stem cell-related gene mutations, leading to a poor prognosis for A-HCC [18], which has a mortality rate that is 4 times that of the general population [19].
The specific molecular mechanisms underlying A-HCC remain to be elucidated. The two most recognised major drivers are cytochrome P450 2E1 (CYP2E1) and intestinal lipopolysaccharide (LPS) imbalance [20, 21]. Alcohol could induce liver inflammation and oxidative stress cause DNA damage in hepatocytes; ultimately promote tumour initiation and progression [22]. Previously, m6A methylation was reported to play a promoting role in the occurrence and development of HCC, regulating cell proliferation, cell invasion and epithelial to mesenchymal transformation [23]. The levels and activities of m6A regulatory genes YTHDF2, ALKBH5 and FTO can inhibit the HCC malignancy [24-26]. For example, FTO can control liver energy homeostasis and metabolism, and it plays an anticancer role in the HCC development [27].
Here, to further explore the correlation between the level of m6A methylations and the occurrence and prognosis of A-HCC. We propose an integrative m6A model based on A-HCC subtyping and mechanism exploration workflow. Then, based on the m6A regulatory factors and multi-omics data from the cancer genome atlas (TCGA) two A-HCC subtypes and their corresponding biological and clinical characters were identified. We observed high-risk A-HCC subtypes are related to immunosuppression and some key Immunosuppressive cytokines (EZH2 and DNMT1) promote the poor prognosis of A-HCC patients. In addition, we selected possible therapy target, thereby promoting a comprehensive understanding of A-HCC and providing guidelines for its treatment.
Materials and Methods
Patients and specimens
For this study, we collected samples from 108 patients who underwent a liver biopsy at Zhujiang Hospital (Southern Medical University, Guangzhou, China) between 2018 and February 2021. After formalin fixation for 24 h, the samples were dehydrated, embedded in paraffin, and stored at 4 °C. The samples were divided into three groups: normal (no HCC history, n = 31), N-A-HCC (no history of alcohol consumption, n = 56), and A-HCC (history of alcohol consumption for more than 20 years, n = 21) (Supplementary Table 1). The data and tissue samples used in this study met the medical ethical requirements of the Southern Medical University.
Mice, diets, and experimental design
C57BL/6 mice were obtained from the Guangdong Animal Experiment Center, China and they were kept in a specific pathogen-free environment at a constant temperature and light-dark cycle of 12 h. All animal handling procedures were approved by the Southern Medical University Animal Care and Use Committee.
To establish a tumour model, C57BL/6 mice were intraperitoneal injected with 25 mg/kg diethylnitrosamine (DEN; Sigma, USA) at 2 weeks of age. At 6 months, mice injected with DEN were given a non-alcoholic liquid diet for diet adaption. One week later, the experimental group was switched to an alcoholic liquid diet (the alcohol concentration was gradually increased to 4.8%), while the control group continued to receive a non-alcoholic liquid diet (maltose instead of alcohol with the same caloric content). Mice in the experimental treatment group were given teniposide (0.4 mg/d per kg bodyweight; Topscience, China) via gavage for 8 weeks at 6 months of age.
Cell culture and reagents
The human HCC-derived cell lines Huh7 and HepG2 were obtained from the American Type Culture Collection (ATCC, Manassas, VA, USA). Cells were cultured in Dulbecco's modified Eagle's medium (DMEM; Gibco, USA) supplemented with 10% foetal bovine serum (FBS; Gibco) and 1% penicillin/streptomycin (Gibco) at 37 °C in a 5% CO2 atmosphere. Mid-log phase cells were used in all experiments.
When the cells achieved the desired confluency, the cells were starved by culturing in medium without FBS for 24 h. Subsequently, the cells were incubated with medium containing 100 mM ethanol for 48 h at 37 °C in a 5% CO2 humidified environment. These cells were used as in vitro model of A-HCC. Then, the cells were incubated for 12 h with 0.5 μM teniposide (Alexis Biochemicals, San Diego, CA, USA).
Quantitative reverse transcription PCR (qRT-PCR)
Total RNA was extracted from clinical patient samples and cells using TRIzol reagent (Life Technologies, USA). RNA concentration and quality were measured using a spectrophotometer (Nanodrop One, Thermo Fisher Scientific, Waltham, MA, USA). Samples with a 260/280 absorbance ratio > 2 ± 0.1 were considered contaminated with protein and discarded. RNA samples were then reverse transcribed to cDNA using a reverse transcription kit (#RR037A; Takara Bio, Shiga, Japan), after which qPCR was performed using SYBR Premix Ex Taq (DRR041A; Takara Bio). Specific primers as shown in Supplementary Table 2 were used to detect the expression levels of relevant genes.
Immunohistochemistry and immunofluorescence
To perform immunohistochemistry (IHC) on patient liver samples, the samples were processed into 4 μm-thick paraffin sections, deparaffinized, and hydrated, followed by microwave treatment (10 mM citrate buffer) for antigen retrieval. The tissue sections were treated with 3% H2O2 for 15 min to block endogenous peroxidase and with goat serum to prevent nonspecific antibody binding. Thereafter, they were incubated overnight at 4 °C with the primary antibodies against DNMT1 (ab188453; Abcam, Cambridge, England), EZH2 (ab191080; Abcam), KIAA1429 (PA5-95717, Thermo Fisher Scientific), LRPPRC (sc-166178,Santa Cruz Biotechnology, Dallas, TX, USA), RBM15B (PA5-110279, Thermo Fisher Scientific, USA) and YTHDF2 (PA5-100053, Thermo Fisher Scientific), followed by incubation with the secondary antibody at room temperature for 1h. For IHC staining, 3,3-diaminobenzidine (DAB; DA1010; Solarbio, China) was used and cell nuclei were counterstained with haematoxylin. Tissue sections were observed using brightfield microscopy.
For immunofluorescence, the cells were fixed with 4% paraformaldehyde, incubated with Triton, blocked with goat serum, and incubated with primary antibodies against DNMT1 and EZH2 at 4 °C overnight and with secondary antibodies (ab150077; Abcam) at room temperature for 1 h. The nuclei were counterstained with DAPI, after which the samples were imaged using a fluorescence microscope.
Western blotting
Cultured cells were dissolved in RIPA buffer containing protease and phosphatase inhibitors. Proteins were collected by centrifugation (10,000 rpm for 10 min) and their concentrations determined using the bicinchoninic acid assay (BCA; Thermo Fisher Scientific). Proteins were subjected to NuPAGE Bis-Tris Gel Electrophoresis (#NP0321; Invitrogen, USA), transferred to nitrocellulose membranes, and incubated with the corresponding antibodies against DNMT1 (1:1,000), EZH2 (1:500), and β-actin (1:1,000; ab8226; Abcam).
Data acquisition
Tumour RNA-seq data and clinical information were obtained from two separate series of patients. The first series obtained from The Cancer Genome Atlas (TCGA, https://portal.gdc.cancer.gov/), included 167 samples (117 A-HCC samples and 50 normal liver samples), and was used as the training set. The second series consisted of 316 samples (114 A-HCC samples and 202 normal liver samples) from the International Cancer Genome Consortium (ICGC, https://icgc.org/) and was used as the validation set. The relationship between m6A-regulators was determined used the Search Tool for Retrieval of Interacting Genes/Proteins (STRING, https://string-db.org/). The clinical characteristics of each patient series are shown in Supplementary Tables 3 and 4. Data obtained from TCGA and ICGC databases are freely available to the public, and this research strictly followed access policies and publication guidelines. Therefore, this study did not require ethical review or approval from an Ethics Committee.
Genes related to KIAA1429, LRPPRC, RBM15B, and YTHDF2, as well as mutation data, were obtained from Cbioportal (http://www.cbioportal.org/). Co-expressed genes were considered those with a Spearman's coefficient greater than 0.3. For gene selection, the threshold parameters were R ≥ 0.3, and p < 0.05. Drug sensitivity data were obtained from the Cancer Therapeutics Response Portal (CTRP) database of GSCALite (http://bioinfo.life.hust.edu.cn/web/GSCALite/) [28]. The Immune Cell Abundance Identifier (ImmunoCellAI, http://bioinfo.life.hust.edu.cn/ImmuCellAI#!/) tool was used to predict immunotherapy response [29]. The relationship of 21 m6A regulators was downloaded from GeneMANIA (http://genemania.org/).
Risk model constitution
The 21 m6A-regulators, comprising eight writers (METTL3, METTL14, RBM15, RBM15B, WTAP, KIAA1429, CBLL1, ZC3H13), two erasers (ALKBH5 and FTO), and 11 readers (YTHDC1, YTHDC2, YTHDF1, YTHDF2, YTHDF3, IGF2BP1, HNRNPA2B1, HNRNPC, FMR1, LRPPRC, ELAVL1), were selected based on a previous report [30]. To quantify the effects of m6A-regulators, statistically significant m6A-regulators selected from univariable Cox regression were analysed using least absolute shrinkage and selection operator (LASSO) regression. Statistical significance was set at p < 0.05. The hazard ratios and 95% confidence intervals were calculated. A total of 11 m6A-regulators were selected for further analysis. The m6A-risk model was developed using the LASSO Cox regression algorithm. The applied formula was as follows:
Risk score =

Gene set enrichment analysis (GSEA)
GSEA analysis was performed using GSEA software (version 4.0.3) to detect the difference in enriched pathways between the high-risk and low-risk subtypes by the Molecular Signatures Database (MSigDB, h.all.v7.2.symbols.gmt). For each analysis, gene set permutations were performed 1,000 times.
Estimation of immune cell type
We used the single-sample GSEA (ssGSEA) algorithm to quantify the relative abundance of infiltrated immune cells. The gene set stores a variety of human immune cell subtypes, including T cells, dendritic cells, macrophages, and B cells [31, 32]. The enrichment score calculated using ssGSEA analysis was used to assess infiltrated immune cells in each sample.
Statistical analysis
Relationships among the m6A regulators were calculated using Pearson's correlation based on gene expression. Continuous variables are summarised as mean ± standard deviation (SD). Differences between groups were compared using the Wilcoxon test, using the R software. Different m6A-risk subtypes were compared using the Kruskal-Wallis test. The 'ConsensusClusterPlus' package in R was used for consistent clustering to determine the subgroup of A-HCC samples from TCGA. The Euclidean squared distance metric and K-means clustering algorithm were used to divide the sample from k = 2 to k = 9. Approximately 80% of the samples were selected in each iteration, and the results were obtained after 100 iterations [33]. The optimal number of clusters was determined using a consistent cumulative distribution function graph. Thereafter, the results were depicted as heatmaps of the consistency matrix generated by the 'heatmap' R package.
We then used Kaplan-Meier analysis to compare the disease-specific survival (DSS), disease-free interval (DFI), progression-free interval (PFI) or overall survival (OS) between different subtypes using the 'survival' and 'survminer' packages in R software. The significance of differences in survival time was calculated using the log-rank test with a threshold of p < 0.05. Univariate and multivariate analyses were performed using Cox regression, followed by identification of independent risk factors for DSS, DFI, PFI, and OS in A-HCC. To evaluate the accuracy and sensibility of the model, we constructed the receiver operating characteristic (ROC) curve and calculated the area under the curve (AUC) using the 'survivalROC' package in R software.
Results
Regulatory pattern of m6A-related genes in A-HCC
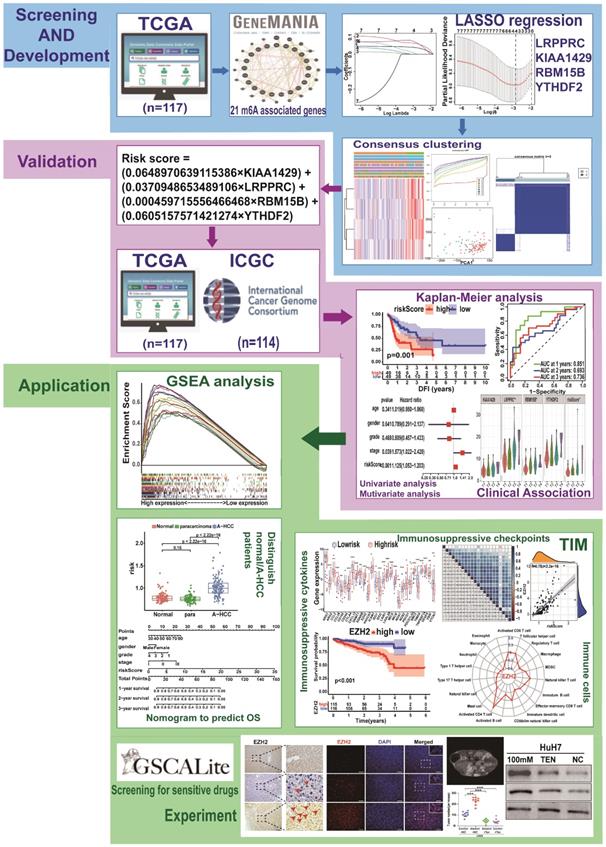
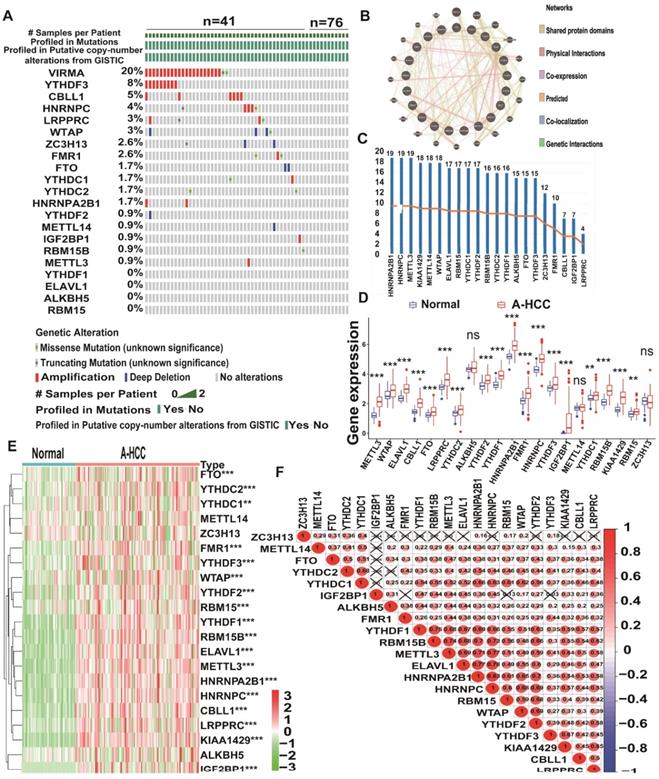
The study design is shown in Figure 1. To determine whether the clinical prognosis of A-HCC is associated with known m6A-related genes, we summarised the occurrence of 21 m6A regulatory factor mutations in A-HCC in TCGA database (n = 117). Among them, VIRMA (KIAA1429) had the highest mutation rate (20%), followed by YTHDF3, whereas four genes (YTHDF1, ELAVL1, ALKBH5, and RBM15) did not show any mutation in this sample (Figure 2A). To systematically study all the functional interactions between proteins, we used the web site GeneMANIA to construct a network of interaction between the selected proteins and found that HNRNPA2B1 was the hub of the network (Figure 2B-C). Furthermore, we determined the difference in the expression levels of the 21 m6A regulatory factors between A-HCC and normal liver tissue (Figure 2D-E). Subsequently, we analysed the correlation of the m6A regulators (Figure 2F) and found that the expression patterns of m6A-regulatory factors were highly heterogeneous between normal and A-HCC samples, suggesting that the altered expression of m6A-regulatory factors might play an important role in the occurrence and development of A-HCC.
Flow chart of this study: establishment, verification, and application of m6A model.
Landscape of genetic expression and variation of m6A regulators in A-HCC. (A) The mutation frequency of 21 m6A regulators in A-HCC patients from TCGA-LIHC cohort was acquired from Cbioportal. (B) Protein-Protein interactions among 21 m6A-related genes acquired from GeneMANIA. (C) Number of edges of 21 m6A regulators in the protein-protein interactions network. (D-E) Boxplot (D) and heatmap (E) of 21 m6A regulator expression levels between normal individuals and A-HCC patients. (F) Correlation analysis of 21 m6A regulators in TCGA-A-HCC cells.
An integrative m6A risk model
To explore the prognostic value of the expression levels of the 21 m6A methylation regulators in A-HCC, we performed univariate Cox regression analysis based on the expression levels of related factors in TCGA dataset and found seven related genes to be significantly related to OS (p < 0.05), namely YTHDF2, KIAA1429, YTHDF1, RBM15B, LRPPRC, RBM15, and YTHDF3 (Supplementary Table 5). To identify the most powerful prognostic m6A regulator, we performed LASSO Cox regression analysis. Four candidate genes (LRPPRC, KIAA1429, RBM15B, and YTHDF2) were selected to construct the m6A risk assessment model (Figure 3A, B), the risk score was as follows: risk score = (0.0648970639115386 × KIAA1429) + (0.0370948653489106 × LRPPRC) + (0.000459715556466468 × RBM15B) + (0.0605157571421274 × YTHDF2). Based on the expression levels of these four m6A-related genes as well as k = 2, a parameter that leads to Supplementary Table clustering outcome, we identified two new clusters in TCGA dataset (Figure 3C-E). Principal component analysis showed that cluster analysis could successfully divide A-HCC patients into two subtypes (Figure 3F). We compared the clinical survival curves of the two subtypes and found that the survival trend of subtype C1 was significantly better than that of subtype C2 (p = 9.832e-04; Supplementary Table 6, Figure 3G, Figure S1A). The expression levels of the four selected m6A-related genes and the clinicopathological variables in the two subtypes were closely related to tumour stage and grade (Figure 3H).
Establishment of the model with four m6A RNA methylation regulators and availability of these key genes. (A-B) Consensus clustering model with cumulative distribution function for k = 2-9 (k means cluster count). (C) TCGA A-HCC cohort was divided into two clusters when k = 2. (D) Relative change in area under cumulative distribution function curve for k = 2-9. (E) Consensus clustering cumulative distribution function for k = 2-9. (F) Principal component analysis of the total RNA expression profile in A-HCC cohort. (G) Overall survival curves for A-HCC patients. (H) Heatmap showing the relationship between two clusters and clinical characteristics. (I & J) m6A high/low risk subtype: the mutation frequency of the top 10 genes in different risk subtype with A-HCC from TCGA-LIHC cohort acquired from Cbioportal. (K) Chi-square test of mutation frequency in different risk subtypes. (L) Boxplots showing model-related gene expression and risk scores in the TP53 mutation and non-mutation groups. (M) Venn diagram of KIAA1429, LRPPRC, RBM15B, and YTHDF2 associated genes from Cbioportal. (N) GO analysis of KIAA1429, LRPPRC, RBM15B, and YTHDF2 associated genes.

We verified the gene and protein expression of the four m6A regulators screened in the collected samples from HCC clinical patients, and the results showed that compared with normal patients, KIAA1429, LRPPCC, RBM15b and YTHDF2 were up-regulated in HCC patients, which was more significant in A-HCC patients (Figure S1B-C). Meanwhile, to further illustrate the external applicability of the model, we conducted survival analysis of the m6A model in a variety of cancers in addition to A-HCC and found that it was predictive (p =0.003), such as liver hepatocellular carcinoma (LIHC, p =0.01), lower grade glioma (LGG, p =0.029), uterine corpus endometrial carcinoma (UCEC, p =0.033) kidney chromophobe (KICH, p =0.005) and arenal cortical carcinoma (ACC, p =0.044; Figure S1D).
To further unravel the mutation events associated with the m6A risk model, we divided the A-HCC patients into high-risk and low-risk subtypes. In the high-risk subtype, 53% of the samples had mutations in TP53 (Figure 3I), whereas CTNNB1 mutations were frequent in the low-risk subtype (Figure 3J). TP53 is a common tumour suppressor gene, and its mutations accompany tumorigenesis [34]. The frequency of TP53 mutations in the high-risk subtype was significantly higher than in the low-risk subtype (53% vs. 23%, p = 0.001; Figure 3K). Subsequently, we divided the A-HCC patients into two subtypes according to the presence or absence of mutations in TP53 (Figure 3L). Risk scores and model-related gene expressions were higher in the TP53-mutation group than in the non-mutated group.
To explore the function of the four identified m6A-related genes, we extracted and screened genes their co-expressed genes and performed gene ontology (GO) enrichment analysis. A total of 202 genes were co-expressed with the four m6A-related genes (Figure 3M) and their functional categories were molecular function (MF), biological process (BP), and cellular component (CC). These terms were mainly enriched in pathways related to RNA processing, modification, and proliferation such as ncRNA metabolic processing and regulation of lipid metabolic processes (Figure 3N). Altogether, the results suggest that TP53 mutation may be a key factor in initiating m6A methylation, which activates cancer-promoting pathways. Hence, the expression levels of KIAA1429, LRPPRC, RBM15B, and YTHDF2 could be used as a prognostic indicator in A-HCC.
Prognostic performance of the m6A risk model in A-HCC
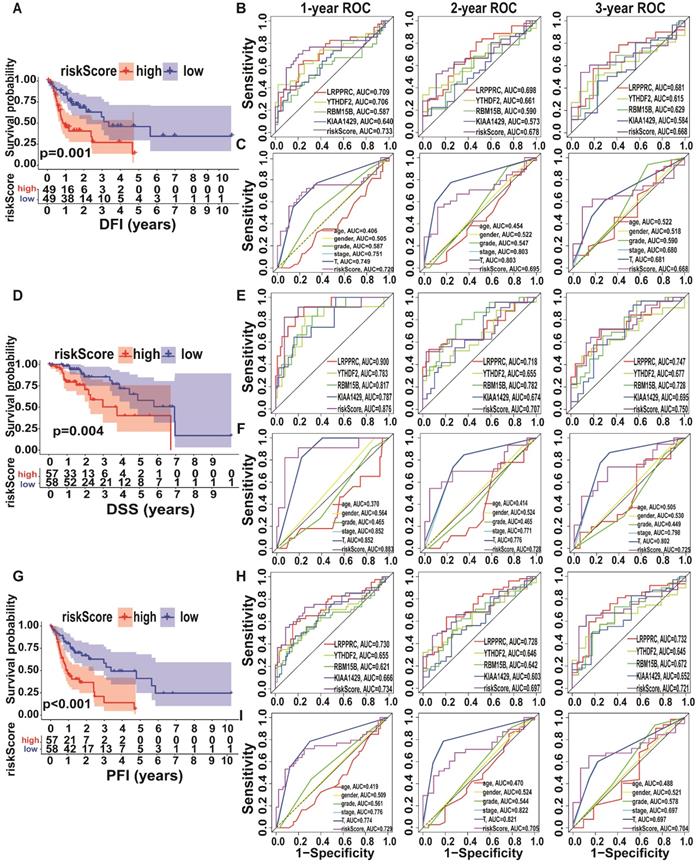
Since the expression levels of the four selected genes (KIAA1429, LRPPRC, RBM15B, and YTHDF2) play a crucial role in tumorigenesis and tumour development, we employed them to establish an m6A risk signature model. KIAA1429, YTHDF2, and RBM15B expression levels were not significantly different between the high/low-risk subtypes when DFI was analysed. In the LRPPRC low-expression group and low m6A risk model, patients had significantly longer DFI than those in the high-expression and high-risk model (Figure 4A, Figure S2A). To demonstrate the reliability of the m6A risk model, we constructed an ROC curve for DFI prediction and quantified the AUC. The AUC of the m6A risk model in 1/2/3 years was better than that of the expression of other genes (KIAA1429, YTHDF2, and RBM15B) and other factors, such as age, sex, and tumour grade (Figure 4B-C). The clinical prognostic differences were consistent from DSS and PFI analysis (Figure 4D-I), which indicated that the m6A risk model composed of four genes (KIAA1429, LRPPRC, RBM15B, and YTHDF2) can more accurately predict the prognosis of A-HCC.
Kaplan-Meier analysis and ROC curves of different survival times in the TCGA-A-HCC cohort. (A) Different factors risk model of Kaplan-Meier analysis for disease-free interval (DFI). (B-C) Model-related genes (B)/ clinical characteristics (C) of ROC curves for DFI (1/2/3 year). (D) Different factors risk model of Kaplan-Meier analysis for disease-specific survival (DSS). (E-F) Model-related genes (E)/ clinical characteristics (F) of ROC curves for DSS (1/2/3 year). (G) Different factors risk scores of Kaplan-Meier analysis for progression-free survival (PFI). (H-I) Model-related genes (H)/ clinical characteristics (I) of ROC curves for PFI (1/2/3 year).
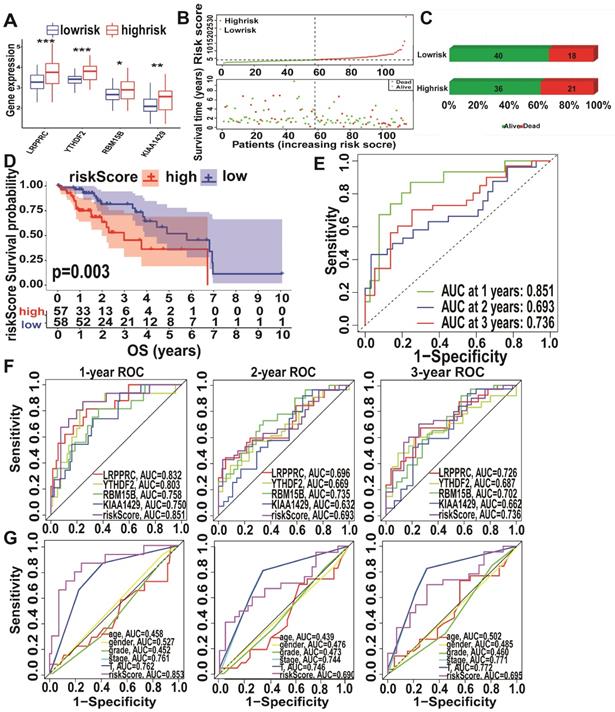
Analysis of KIAA1429, LRPPRC, RBM15B, and YTHDF2 expression levels in the high- and low-risk subtypes from TCGA database showed significantly upregulated expression in the high-risk subtype (Figure 5A). The high-risk subtypes had a lower OS and a higher risk score than those in the low-risk subtype (Figure 5B-C). Higher expression levels of KIAA1429, and RBM15B and higher m6A risk model scores were associated with a higher mortality rate in the high-risk subtype (Figure 5D, Figure S2D). To further evaluate the accuracy of the m6A risk model for predicting the 1, 2, and 3-year survival rate of A-HCC patients, we performed ROC curve analysis on TCGA (n = 117) cohorts (Figure 5E). Similarly, the performance of the m6A risk model was better than the models using the expression levels of a single gene and other factors (age, gender, tumour grade, tumour stage, and vascular invasion; Figure 5F-G). Meanwhile, the same verification was performed in the ICGC database (Figure S3). The above data show that the m6A risk model predicts the OS of A-HCC patients with more accuracy and reliability than any of the other models analysed.
Performance of the m6A-risk model in predicting A-HCC patient survival in TCGA databases. (A) Boxplots showing four m6A-related gene expression profiles in high-risk and low-risk subtypes. (B) Patient status distribution in the high-risk and low-risk subtypes. (C) Mortality rates of the high-risk and low-risk subtypes. (D) Overall survival curves for A-HCC patients. (E-G) ROC curves of TCGA cohort: ROC curves showing the predictive accuracy of model (E)/model-related genes (F)/different clinical characteristics and time (1/2/3 year) (G).
m6A risk model to evaluate the occurrence and development of A-HCC
Considering that m6A methylation is closely related to the occurrence and development of tumours, we explored the relationship between the m6A risk model and clinicopathological characteristics. In TCGA cohort, the expression levels of LRPPRC and RBM15B and the m6A risk score were significantly correlated with tumour grade and T stage. Increases in tumour grade and T stage were associated with higher m6A risk score or gene expression levels. Additionally, KIAA1429, LRPPRC, and RBM15B and the m6A risk scores were significantly different between different tumour stages (Figure 6A). Subsequently, we validated our conclusions again using the ICGC dataset. In the ICGC cohort, KIAA1429, LRPPRC, RBM15B, and YTHDF2 expression levels and the m6A risk score were significantly correlated with tumour grade. Moreover, the increase in tumour grade was associated with a gradual increase in the m6A risk model score. Only RBM15B expression levels and the m6A risk model score were associated with tumour stage and T stage. We also evaluated the relationship between the m6A risk model and vascular invasion and found that KIAA1429 and LRPPRC expression levels and the m6A risk model score were significantly correlated with vascular invasion (Figure 6B). This indicates that tumour vascular invasion is highly correlated with the model score and that patients with higher scores are more likely to exhibit vascular invasion.
Analysis of clinical characteristics analysis of the m6A-risk model in A-HCC. (A-B) The expression levels of KIAA1429, LRPPRC, RBM15B, YTHDF2 and risk model in A-HCC patients with different clinical characteristics in TCGA (A) and ICGC (B) databases. (C-D) Univariate and Multivariate analyses in TCGA (C) and ICGC cohorts (D) in A-HCC patients; Left: Univariate evaluating m6A signature in terms of OS; Right: Multivariate analyses evaluating the m6A signature in terms of OS.
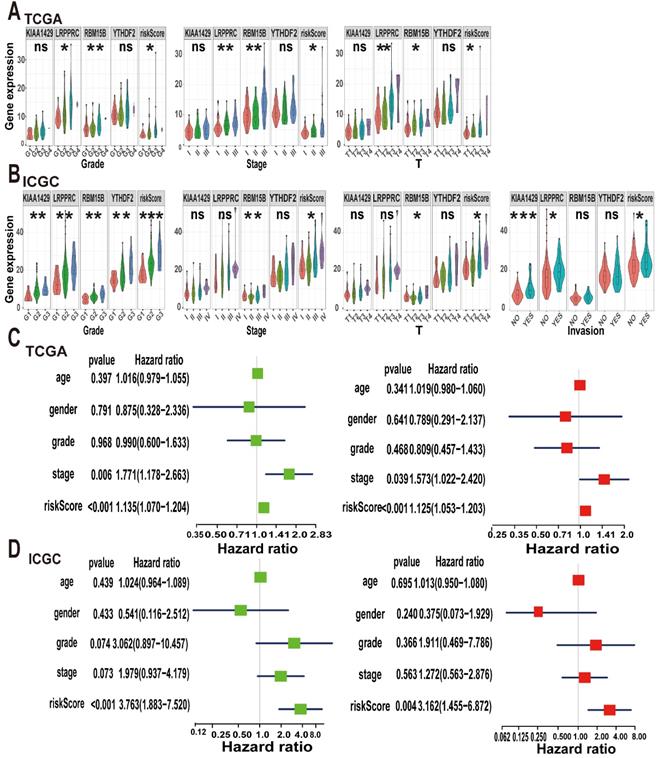
Next, we used the Cox regression model to perform univariate and multivariate survival analyses on the m6A risk model. In TCGA dataset, both univariate and multivariate analyses showed that tumour stage and the m6A risk model score were strongly associated with OS (Figure 6C), which was replicated in the ICGC database (Figure 6D). Thus, we concluded that the m6A risk model can used to evaluate the occurrence and development of A-HCC.
GSEA signalling pathways
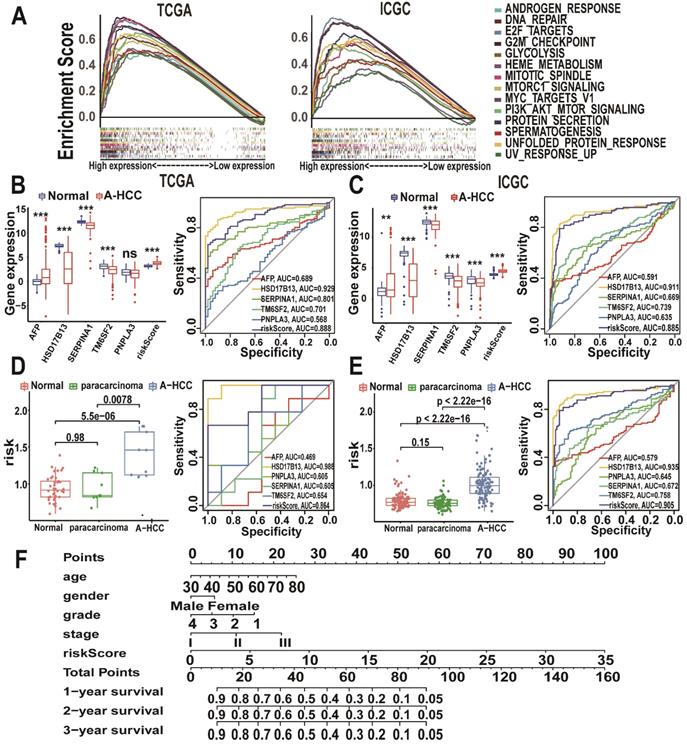
To further explore the pathways potentially involved in the development of A-HCC, we divided the patients from TCGA and ICGC databases into high-risk and low-risk subtypes based on risk scores and performed GSEA enrichment analysis (Supplementary Table 7). Pathways enriched in the high-risk subtype were mainly related to tumour formation and proliferation, such as E2F targets, DNA repair, and MTORC1 signalling pathways (Figure 7A). Interestingly, the enriched pathways were shown to be closely related to tumour development and anti-apoptosis. For example, the E2F pathway plays a key role in cell proliferation by regulating the cell cycle [35].
Prognostic value of the m6A-risk model in A-HCC. (A) GSEA showing enriched hallmarks in TCGA (left) and ICGC (right) cohorts. Normalized enrichment score (NES) > 1 and nominal p-value (NOM p-Val) < 0.05were indicated significant gene sets. (B-C) Boxplot and ROC curves (from left to right) of m6A-risk model in TCGA (B) and ICGC (C) cohorts to distinguish normal individuals and A-HCC patients. (D-E) Boxplot and ROC curves of the m6A-risk model in TCGA (D) and ICGC (E) cohorts to distinguish normal individuals and paracarcinoma and A-HCC patients. (F) Multivariate nomogram predicts OS in A-HCC patients.
Utility of the m6A risk model in diagnosing and assessing the disease status of A-HCC
To explore the potential role of the m6A risk model in the diagnosis of A-HCC as well as its reliability and accuracy, we compared it with known A-HCC-related genes and diagnostic markers. Alpha-fetoprotein (AFP) is the most commonly used clinical HCC marker [36]. Other proteins closely related to A-HCC include patatin-like phospholipase domain-containing protein 3 (PNPLA3), hydroxysteroid 17-beta dehydrogenase 13 (HSD17B13), serpin family A member 1 (SERPINA1), and transmembrane 6 superfamily member 2 (TM6SF2) [37-40]. We found that the m6A risk model (AUC = 0.888) had a better predictive accuracy for A-HCC diagnosis compared with that of AFP, SERPINA1, TM6SF2, and PNPLA3 expression levels (Figure 7B). We validated these results using the ICGC database (Figure 7C).
We next evaluated the specificity of the m6A model in distinguishing A-HCC from alcohol-associated non-malignant changes. Surprisingly, the m6A risk model score was significantly increased in the A-HCC samples compared with A-HCC paracarcinoma and normal tissue samples in both TCGA and ICGC databases; additionally, the m6A model showed a marked sensitivity in A-HCC diagnosis (Figure 7D-E). We also verified that this model was superior to other related factors in distinguishing cancer and paracarcinoma tissue samples (Figure S4), demonstrating that dysregulated expression levels of m6A genes are highly specific in the tumorigenesis of A-HCC. Based on TCGA database, we established a nomogram to predict the OS of patients according to various possible influencing factors (Figure 7F).
The immune landscape of A-HCC patients
To explore the immune landscape of A-HCC patients, we performed ssGSEA using TCGA and ICGC databases. The resulting heatmap is shown in Figure S5A-B and the infiltration levels of various immune cell types are shown in Figure 8A. The infiltration levels of most immune-activated cells, such as activated CD8+ cells, activated CD8+ T cells, effector memory CD8+ T cells, gammadelta T cells, and immature B cells, were reduced in the high-risk subtype. However, the proportion of activated CD4+ T cells and CD56dim natural killer cells in the high-risk subtype was higher than in the low-risk subtype. We then found a positive correlation between these immune cells, and the proportion of myeloid-derived suppressor cells were closely correlated with that of regulatory T cells (R = 0.91; Figure 8B). Subsequently, we downloaded the immunosuppressive cytokines related to the cancer-immunity cycle from the Tracking Tumour Immunophenotype website [41] and compared the relationship between the m6A risk model and immunosuppressive cytokines using box plots. The results showed that levels of most of the immunosuppressive cytokines, such as Arg2, CCL28, DNMT1, and EZH2, were upregulated in the high-risk subtype (Figure 8C), suggesting that high-risk A-HCC patients have reduced cancer-immunity cycle activity. Similarly, we analysed the correlation between these immunosuppressive cytokines and found that DNMT1 and EZH2 were highly correlated (R = 0.71; Figure 8D). Kaplan-Meier analysis of DNMT1 and EZH2 showed that patients with higher DNMT1/EZH2 expression have poorer OS (Figure 8E-F).
Immune landscape and immunotherapy prediction between low and high m6A-risk A-HCC patients in TCGA databases. (A) Boxplot visualizing the difference of immune cell infiltration among different risk subtypes from TCGA-A-HCC. * P < 0.05, ** P < 0.01, *** P < 0.001. (B) Correlation analysis of immune cells from TCGA-A-HCC. (C) Boxplot visualizing the different expression of immunosuppressive cytokines among different risk subtypes from TCGA-A-LIHC. * P < 0.05, ** P < 0.01, *** P < 0.001. (D) Correlation analysis of immunosuppressive cytokines from TCGA-A-HCC. (E-F) Kaplan-Meier analysis of DNMT1 (E) and EZH2 (F) for OS between different risk subtypes. (G-H) Radar map showing relationship between immune cells and DNMT1 (G)/EZH2 (H). (I) Boxplot of the relationship between ImmuneScore StromaScore ImmuneScore/StromaScore-MicroenvironmentScore. (J) Boxplot showing risk scores and four hub genes (KIAA1429, LRPPRC, RBM15B, and YTHDF2) between the immunotherapy non-response and immunotherapy response groups in the TCGA databases.
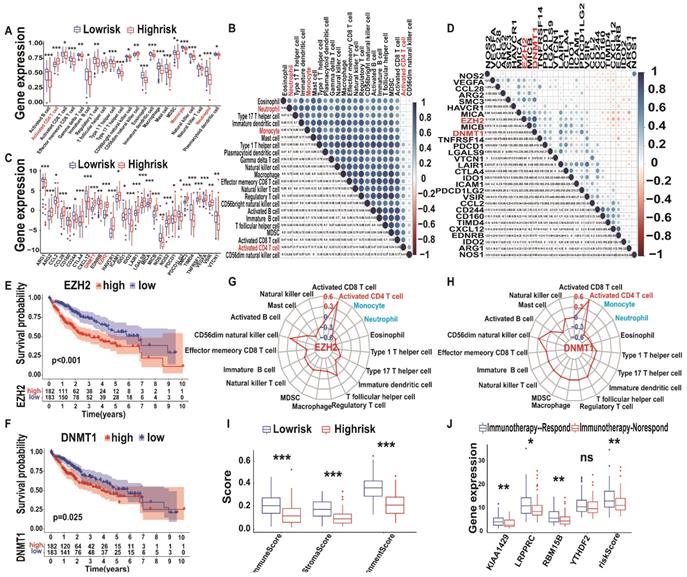
To verify the above conclusions, we generated a Venn diagram of immune cells and immunosuppressive cytokines of TCGA/ICGC databases, which resulted in an overlap of 19 immune cells and 26 immunosuppressive cytokines (Figure S4C). Subsequently, we explored the correlation between immunosuppressive cytokines (DNMT1 and EZH2) and all immune cells (Supplementary Table 8) and found that three types of immune cells (activated CD4+ T cells, monocytes, and neutrophils) were closely related to DNMT1 and EZH2 levels (Figure 8G-H). These results were further validated in the ICGC database (Figure S6A-H). Therefore, we performed logistic regression analysis of the model risk score and immune cells/immunosuppressive cytokines levels and found that they were closely correlated (Figure S7). Altogether, these results indicate that an increase in activated CD4+ T cell infiltration is associated with higher expression levels of DNMT1 and EZH2, whereas the opposite was observed for monocyte and neutrophil infiltration. Therefore, immunosuppressive cytokines, such as DNMT1 and EZH2, and immune cells, such as activated CD4+ T cells, monocytes, and neutrophils, may form a TIM regulatory system, representing a new target for A-HCC therapy.
m6A model predicts A-HCC treatment efficacy
In TCGA database, patients in the m6A high-risk subtype had lower immune and stroma scores as well as lower ration immune score - stroma Score/microenvironment score than patients in the m6A low-risk subtype (Figure 8I). Thus, our model could predict the TIM state and the therapeutic responses of A-HCC. Recently, an ImmuCellAI estimation method was developed to predict the response of HCC patients to immunotherapy [42]. We evaluated whether the m6A risk model can make similar predictions and analysed the difference in KIAA1429, LRPPRC, RBM15B, and YTHDF2 expression levels and the risk score between the responder and non-responder group.
Significantly upregulated expression of KIAA1429, LRPPRC, and RBM15B and high-risk scores were observed in the non-responder group compared with the responder group (Figure 8J). This was further verified using the ICGC database (Figure S5I-J). As shown in Figure 8A, most high-risk subtypes lacked immune cells; immunoreactive cell deficiency is known to cause immunotherapy tolerance [43, 44], which indicates that high-risk may be related to non-response to immunotherapy (immune tolerance).
We further conducted a drug sensitivity analysis of DNMT1, EZH2, RBM15B, KIAA1429, LRPPRC, and YTHDF2 using the CTRP database. Screening revealed teniposide, PX-12, LRRK2-IN-1, and GSKJ4 as potential therapies for A-HCC (Figure S8).
Validation of A-HCC core genes (DNMT1/EZH2) and potential drugs
We collected pathological samples from normal, N-A-HCC, and A-HCC patients and performed immunohistochemical staining and qRT-PCR. DNMT1 and EZH2 levels in the liver tissues of normal individuals and N-A-HCC patients were barely detecSupplementary Table, while they were diffusely expressed in A-HCC patients (Figure 9A-C), indicating that DNMT1 and EZH2 expression in A-HCC patients is increased in comparison with normal and N-A-HCC individuals.
Expression of DNMT1/EZH2 and potential drug validation. (A-B) The immunohistochemical staining of DNMT1/EZH2 in clinical patients of three groups was observed: Normal (n = 31), N-A-HCC (no history of alcohol consumption n = 56), and A-HCC (n = 21) (A), the positive rate of immunohistochemical staining was analysed (B). (C) qRT-PCR expression of DNMT1/EZH2 in clinical patients of the three groups (Normal/ N-A-HCC/ A-HCC). (D-F) HCC cell lines (Huh7 and HepG2) were treated with alcohol, divided into normal control (NC) group, alcohol (100 mM) groups, and teniposide group (0.5 μM teniposide treatment of alcohol-treated HCC cells), and the expression of DNMT1/EZH2 was analysed using western blotting (D), immunofluorescence staining (E) and qRT-PCR (F).
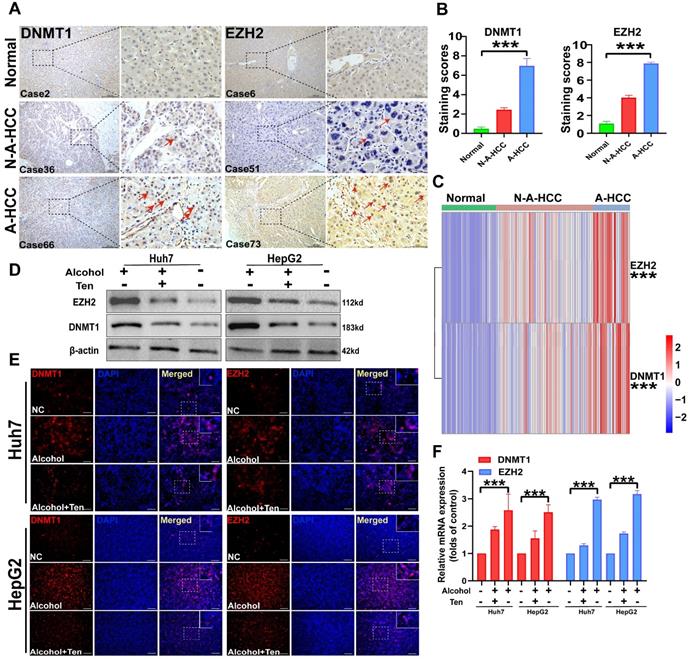
We then evaluated the role of DNMT1 and EZH2 in guiding A-HCC treatment. As the therapeutic effects of PX-12 [45], LRRK2-IN-1 [46], and GSK-J4 [47] in A-HCC have been already described, we decided to explore the therapeutic effect of teniposide on A-HCC. We employed two HCC cell lines, Huh7 and HepG2, and treated them with 100 mM alcohol, as a cellular model of A-HCC. DNMT1 and EZH2 gene expression and protein levels, evaluated by qRT-PCR, western blotting and immunofluorescence staining, were significantly higher in the alcohol-treated group (100 mM) than in the control group. Administration of teniposide (0.5 μM) to alcohol-treated cells abolished these effects (Figure 9D-F). Given that DNMT1 and EZH2 are barely expressed in the control group but are significantly up-regulated by alcohol-treatment and significantly down-regulated after teniposide treatment, the results suggest that DNMT1 and EZH2 may be core proteins in the aetiology of A-HCC and highlight teniposide as a potential therapeutic drug.
The potential therapeutic effect of teniposide against A-HCC in vivo
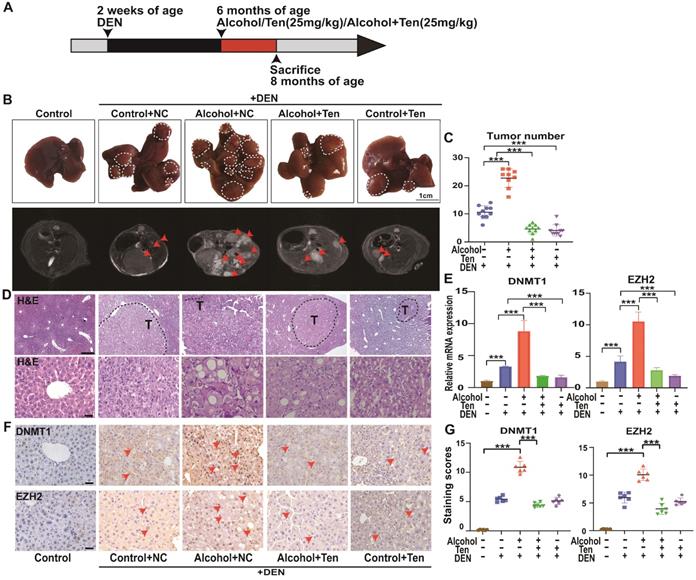
We evaluated the role of teniposide in the occurrence and development of HCC in mice; an overview of the experimental procedure is provided in Figure 10A. Mice begin to form HCC 7-10 months after injection of DEN solvent [48]; hence we administered alcohol and drugs (teniposide, TEN) at 6 months of age, and divided the mice into five groups: Control+NC (without TEN and alcohol), Alcohol+NC (without TEN), Alcohol+TEN, Control+TEN (without alcohol) under DEN stress, and Control without DEN stress (10 mice per group). MRI imaging (AVANCE IIITM HD 600MHz) of the mouse liver was obtained at 8 months and representative liver images of each group are shown in Figure 10B. Tumour number analysis showed that teniposide significantly reduced tumours numbers in A-HCC (Figure 10C). Haematoxylin and eosin staining of liver sections demonstrated that Alcohol+NC group had the most obvious liver lesions and that teniposide was more effective in treating A-HCC than HCC (Figure 10D). We then determined the expression of two A-HCC core genes (DNMT1 and EZH2) using qRT-PCR and IHC, and found significantly higher expression in the A-HCC group than in the HCC group, which significantly decreased following teniposide treatment (Figure 10E-G). Taken together, these data suggest that teniposide has a potential therapeutic effect on the occurrence and progression of A-HCC by acting on the A-HCC core genes, DNMT1 and EZH2.
Alcohol promotes the occurrence and development of HCC, while teniposide showed a therapeutic effect on A-HCC. (A) C57BL/6 mice were injected with 25mg/kg DEN (n = 40) at 2 weeks of age. At 6 months of age, mice were given liquid alcohol diet (4.8% alcohol) (n = 10), teniposide (n = 10) and liquid alcohol diet (4.8% alcohol) + teniposide (n = 10). The animals were sacrificed at 8 months of age. (B) Representative MRI liver images obtained for each group (arrows depict tumours), n = 10 for Control without DEN stress, Control+NC, Alcohol+NC, Alcohol+Ten, and Control+Ten group under DEN stress. (C) Quantification results of tumour number for each group under DEN stress, *** P < 0.001 (Mann-Whitney U test). (D) H&E staining of representative liver sections observed in each group (dotted line indicates tumours outline). Scale bar, 400 µm (D); 50 µm (E). (E) qPCR results of DNMT1 and EZH2 in liver tissue of each group, data shown as mean ± SEM; n = 10 for Control without DEN stress, Control+NC, Alcohol+NC, Alcohol+Ten, and Control+Ten group under DEN stress, *** P < 0.001 (Mann-Whitney U test). (F-G) Immunohistochemical staining showed the expression level of DNMT1/EZH2 in each group: Control without DEN stress, Control+NC, Alcohol+NC, Alcohol+ TEN, and Control+ TEN group under DEN stress (F), positive rate of immunohistochemical staining was analysed. Scale bar, 40x, 50 µm. *** P <0.001 (Mann-Whitney U test) (G).
Discussion
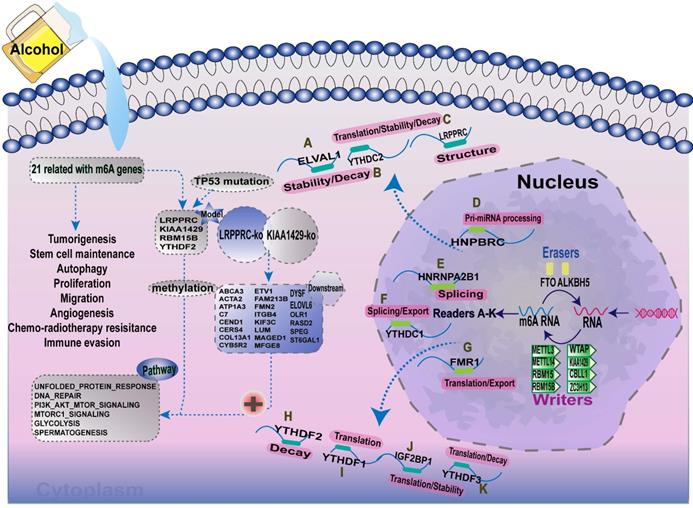
Increasing evidence has demonstrated that the interaction between multiple m6A regulators plays an essential role in the development and progression of several types of cancers. Here, we summarised the m6A-regulatory genes involved in the pathways associated with tumorigenesis (Supplementary Table 9). To clarify the relationship between m6A-related genes and the prognoses of patients with A-HCC, we selected 21 m6A regulators and mapped the m6A modifications mediated by these regulators and their potential biological functions in disease occurrence (Figure 11). Demethylases (FTO and ALKBH5) and methyltransferases (such as Metl3 and Metl14) have been reported to regulate the progression of several types of cancers, including liver, lung, and breast cancers [49-52]. For example, silent information regulator 1 (SIRT1) can deregulate FTO to guide the m6A methylation of downstream molecules [53], and ALKBH5 can act as a tumour suppressor by reducing the expression of LYPD1 in HCC [54].
Summary of the dynamic process of m6A RNA methylation mediated by 21 regulators and their potential biological functions.
Currently, the mortality rate of HCC remains high, especially for A-HCC patients, owing to the lack of early diagnostic markers, treatment resistance, and poor immunotherapy sensitivity [55]. The TIM plays a decisive role in the effectivity of treatment methods and can lead to tumour development and recurrence after treatment [56, 57]. In the progression of liver cancer, immune cells and immunosuppressive cytokines can adjust the balance of the immune system by, for example, modifying the proportion of T-cell subsets [58]. Importantly, the immunosuppressive state in the tumour can be transformed into an immune-activated state by adjusting the TIM and inducing an effective immune response, which can lead to an enhanced sensitivity to immunotherapy. Therefore, evaluating the TIM, and its relationship with prognosis in A-HCC patients is urgent. In the present study, we clarified the role of m6A methylation in regulating the TIM and developed a risk model based on the expression levels of m6A regulators, which may help predict the prognosis of A-HCC patients and more effective immunotherapy targets.
The risk model developed herein integrated four m6A methylation regulators, LRPPRC, YTHDF2, KIAA14219, and RBM15B. LRPPRC encodes a nuclear protein that is significantly negatively correlated with the immune response in a variety of tumour tissues [59-61]. YTHDF2 encodes a member of the YT521-B homology (YTH) domain family that has been reported to regulate mRNA stability [62, 63], and Yu et al. found that YTHDF2 plays a negative regulatory role in the inflammatory response induced by LPS [64]. KIAA14219 encodes a methyltransferase that acts as a m6A 'writer' [65] and has been reported to be involved in tumour cell proliferation and metabolism pathways in liver and breast cancers [66, 67]. Finally, RBM15B, which encodes another m6A 'writer', modifies m6A by binding to m6A methylation complexes (METTL3 and WTAP) [68]. RBM15B has been reported to be associated with the immune landscape in various diseases [69].
In this study, we used the four m6A regulators to divide A-HCC patients into two subtypes and predicted their prognosis, and the model was validated in clinical patient samples we collected. We notably found that m6A high-risk subtypes had a high frequency of mutations in TP53. As TP53 is a tumour suppressor gene, this indicates that TP53 mutations may cause changes in m6A methylation levels. In addition, the pathways associated with the high-risk subtype were mainly related to RNA processing modification, and tumour development, suggesting that these four m6A regulators can be used as indicators of the occurrence and prognosis of A-HCC. In analysing different survival interval (DFI, DSS, PFI and OS), we found that the prognosis of the m6A high-risk subtype was significantly worse and that the m6A risk model was more reliable and accurate than single genes in prediction efficiency, which could be used as an independent predictor. Meanwhile, the model was more reliable than the common clinical indicators AFP, PNPLA3, HSD17B13, SERPINA1, and TM6SF2 in predicting patient outcome. Finally, we constructed a nomogram based on various confounding factors, with the aim of applying this model to clinical guidance in the future.
GSEA indicated that the pathways enriched in the high-risk subtype were related to tumour formation and proliferation, which included the common E2F pathway and the PI3K/Akt/mTOR pathway [70, 71]. E2F is a transcription factor that controls the expression of all cell division genes, of which E2F8 is significantly increased in HCC and ovarian cancer [72]. It can transcriptionally inhibit CDK1-induced hepatocyte polyploidy, interact with HIF1 to form a complex, improve VEGFA level, promote angiogenesis, and induce tumour metastasis [72, 73]. In addition, the PI3K/Akt/mTOR pathway is essential for tumour survival and growth, and induces resistance to radio-therapy, chemo-therapy, and cytostatic drugs [74].
A large amount of data from various disease conditions have indicated a correlation between m6A modifications and TIM [75-77]. Although several studies have investigated the role of single regulatory factors or a single immune-infiltrating cell type in the immune response [78, 79], the comprehensive role of multiple m6A regulators in the immune response has not been studied to date. In this study, we describe the relationship between m6A regulators and the A-HCC immune response. In our model, there were clear differences in the TIM cell infiltration characteristics, higher m6A risk scores were associated with a higher infiltration of activated CD4+ T cells, higher levels of immunosuppressive cytokines (DNMT1 and EZH2) and reduced levels of monocytes and neutrophils infiltration. These features indicate an immunosuppressive TIM in the high-risk subtype, corresponding to the so-called 'immune desert type'. In contrast, the low-risk subtype had an immune-activated state. Therefore, the immunosuppressive cytokines DNMT1 and EZH2; and the immune cells activated CD4+ T cells, monocytes, and neutrophils appear to form a TIM regulatory system that greatly impacts the prognosis of A-HCC.
DNMT1, a common DNA methyltransferase, is involved in DNA methylation in eukaryotes [80]. DNMT1 is closely related to the occurrence and development of various diseases, including several types of cancers, as it affects the methylation levels of CD4+T cell-related genes, thereby inhibiting the immune response [81-84]. EZH2 acts as a catalyst for polycomb repressive complex 2 (PRC2) formation, catalysing the trimethylation of lysine 27 on histone H3 (H3K27me3) and mediating gene silencing [85]. Several studies have reported that EZH2 can regulate the development and function of B cells and neutrophil migration and change the plasticity of CD4+T cells, highlighting the important role of EZH2 in the immune regulation of many diseases [86-88].
CD4+ T cells act as central orchestrators of immune regulation. Depending on the specific TIM, activated CD4+ T cells can differentiate into CD4+ T helper (Th) cells, which collaborate with B cells and CD8+ T cells promote immune response [89, 90]. Monocytes are an important part of innate immunity and have been reported to be key regulators of cancer development [91]. During tumorigenesis, monocytes perform several antitumor immunity functions, including phagocytosis and recruitment of lymphocytes, and can even differentiate into tumour-related immune cells [92, 93]. Neutrophils exhibit powerful antimicrobial functions, including phagocytosis and formation of neutrophil extracellular traps [94, 95]. Under pathological conditions, neutrophils are activated and infiltrate lesions, thereby changing the tissue microenvironment [96-98].
We evaluated the performance of the m6A risk model in assessing the sensitivity of immunotherapy and found that high score models were associated with reduced sensitivity to treatment. This may be because activated CD4+ T cells, monocytes, and neutrophils in the m6A high-risk subtype interact with DNMT1 and EZH2, resulting in an immunosuppressive, desert type microenvironment. DNMT1 and EZH2 expression levels were then compared between normal, N-A-HCC and A-HCC samples, while activating activated CD4T cells and inhibiting monocyte and neutrophil. DNMT1 and EZH2 expression levels were revealed to be correlated with changes in immune cells in the TIM and may improve the TIM state by inhibiting its expression. Through drug sensitivity analysis, we found that A-HCC patients were generally sensitive to teniposide, PX-12, LRRK2-IN-1, and GSK-J4 drugs, which can help clinicians better select treatment strategies. Among these four drugs, teniposide has not been reported in HCC studies. In our study, we found that teniposide has a potential therapeutic effect on A-HCC by down-regulating the expression of A-HCC core genes (DNMT1 and EZH2), thereby reversing the malignant degree of A-HCC and improving the prognosis.
In conclusion, we employed the expression levels of m6A regulators to construct a risk model that can accurately predict the prognosis of A-HCC patients and aid further understanding of the TIM state in A-HCC. The model can also predict the sensitivity of A-HCC patients to immunotherapy and drug therapy, which can greatly help guide future clinical selection of A-HCC targeted therapy and immunotherapy. Our finding also demonstrated that DNMT1 and EZH2 can be exploited as core genes of A-HCC and that teniposide can be used for the treatment of A-HCC.
Abbreviations
A-HCC: alcohol-induced HCC; AUC: area under the curve; DFI: disease-free interval; DMEM: Dulbecco's modified Eagle's medium; DSS: disease-specific survival; FBS: foetal bovine serum; HCC: hepatocellular carcinoma; ICGC: International Cancer Genome Consortium; LASSO: least absolute shrinkage and selection operator; LPS: lipopolysaccharide; OS: overall survival; PFI: progression-free interval; ROC: receiver operating characteristic; TCGA: The Cancer Genome Atlas; TIM: tumour immune microenvironment; LGG: lower grade glioma; UCEC: uterine corpus endometrial carcinoma; KICH: kidney chromophobe; ACC: arenal cortical carcinoma.
Supplementary Material
Supplementary figures and tables.
Acknowledgements
The authors thanked Dr Lei Cai and Jianmin Zhang for the advice and help in the discussion on the field of m6A and immunotherapy of A-HCC.
Funding
This work was supported by China Postdoctoral Science Foundation (Grant Number F121ZJ0216, 2021M691463); the National Key R&D Program of China (2018YFC1106400; 2018YFA0108200) ;Science and Technology Planning Project of Guangdong Province(2015B020229002); the National Natural Science Foundation of China (31972926);The Natural Science Foundation of Guangdong Province (2014A030312013, 2018A030313128); Guangdong key research and development plan (2019B020234003); Guangdong Basic and Applied Basic Research Foundation (2020A1515111111).
Authors' contributions
Weng Jun conceptualized the discussions. Yue Zhang wrote the manuscript under the supervision of Gao Yi. Fanhong Zeng, Min Zeng, Lei Cai and Xu Han edited the manuscript. All authors read and approved the final manuscript.
Competing Interests
The authors have declared that no competing interest exists.
References
1. Xiao W, Adhikari S, Dahal U. et al. Nuclear m(6)A Reader YTHDC1 Regulates mRNA Splicing. Molecular Cell. 2016;61:507-519
2. Alarcón CR, Lee H, Goodarzi H. et al. N6-methyladenosine marks primary microRNAs for processing. Nature. 2015;519:482-485
3. Lee M, Kim B, Kim VN. Emerging roles of RNA modification: m(6)A and U-tail. Cell. 2014;158:980-987
4. Luo J, Liu H, Luan S. et al. Aberrant Regulation of mRNA m⁶A Modification in Cancer Development. International Journal Of Molecular Sciences. 2018 19
5. Yi YC, Chen XY, Zhang J. et al. Novel insights into the interplay between m(6)A modification and noncoding RNAs in cancer. Molecular Cancer. 2020;19:121
6. Chen J, Fang X, Zhong P. et al. N6-methyladenosine modifications: interactions with novel RNA-binding proteins and roles in signal transduction. RNA Biology. 2019;16:991-1000
7. Llovet JM, Zucman-Rossi J, Pikarsky E. et al. Hepatocellular carcinoma. Nature Reviews Disease Primers. 2016;2:16018
8. Bray F, Ferlay J, Soerjomataram I. et al. Global cancer statistics 2018: GLOBOCAN estimates of incidence and mortality worldwide for 36 cancers in 185 countries. CA Cancer J Clin. 2018;68:394-424
9. Yang JD, Hainaut P, Gores GJ. et al. A global view of hepatocellular carcinoma: trends, risk, prevention and management. Nat Rev Gastroenterol Hepatol. 2019;16:589-604
10. Zhang K, Chen R, Gong X. et al. Survival outcomes of liver transplantation versus liver resection among patients with hepatocellular carcinoma: A SEER-based longitudinal study. Journal of the Formosan Medical Association. 2019;118:790-796
11. Testino G, Leone S, Borro P. Alcohol and hepatocellular carcinoma: a review and a point of view. World J Gastroenterol. 2014;20:15943-15954
12. Schütze M, Boeing H, Pischon T. et al. Alcohol attribuSupplementary Table burden of incidence of cancer in eight European countries based on results from prospective cohort study. BMJ. 2011;342:d1584
13. EASL-EORTC clinical practice guidelines. management of hepatocellular carcinoma. Journal of Hepatology. 2012;56:908-943
14. Xu D, Tian Y, Xia Q. et al. The cGAS-STING Pathway: Novel Perspectives in Liver Diseases. Frontiers in Immunology. 2021;12:682736
15. Wen B, Zhang C, Zhou J et al. Targeted treatment of alcoholic liver disease based on inflammatory signalling pathways, Pharmacol Ther 2021;222:107752
16. Osna NA, Donohue TJ, Kharbanda KK. Alcoholic Liver Disease: Pathogenesis and Current Management. Alcohol Res. 2017;38:147-161
17. Ganne-Carrié N, Nahon P. Hepatocellular carcinoma in the setting of alcohol-related liver disease. Journal of Hepatology. 2019;70:284-293
18. Dai X, Guo Y, Hu Y. et al. Immunotherapy for targeting cancer stem cells in hepatocellular carcinoma. Theranostics. 2021;11:3489-3501
19. Hagström H, Thiele M, Sharma R. et al. Risk of Cancer in Biopsy-Proven Alcohol-Related Liver Disease: A Population-Based Cohort Study of 3410 Persons. Clin Gastroenterol Hepatol. 2021
20. Wang Y, Millonig G, Nair J. et al. Ethanol-induced cytochrome P4502E1 causes carcinogenic etheno-DNA lesions in alcoholic liver disease. Hepatology. 2009;50:453-461
21. Seki E, De Minicis S, Osterreicher CH. et al. TLR4 enhances TGF-beta signaling and hepatic fibrosis. Nature Medicine. 2007;13:1324-1332
22. Seitz HK, Stickel F. Molecular mechanisms of alcohol-mediated carcinogenesis. Nature Reviews Cancer. 2007;7:599-612
23. Pan XY, Huang C, Li J. The emerging roles of m(6)A modification in liver carcinogenesis. International Journal of Biological Sciences. 2021;17:271-284
24. Liu X, Liu J, Xiao W. et al. SIRT1 Regulates N(6) -Methyladenosine RNA Modification in Hepatocarcinogenesis by Inducing RANBP2-Dependent FTO SUMOylation. Hepatology. 2020;72:2029-2050
25. Chen Y, Zhao Y, Chen J. et al. ALKBH5 suppresses malignancy of hepatocellular carcinoma via m(6)A-guided epigenetic inhibition of LYPD1. Molecular Cancer. 2020;19:123
26. Zhang C, Huang S, Zhuang H. et al. YTHDF2 promotes the liver cancer stem cell phenotype and cancer metastasis by regulating OCT4 expression via m6A RNA methylation. Oncogene. 2020;39:4507-4518
27. Niu Y, Lin Z, Wan A. et al. RNA N6-methyladenosine demethylase FTO promotes breast tumor progression through inhibiting BNIP3. Molecular Cancer. 2019;18:46
28. Liu CJ, Hu FF, Xia MX. et al. GSCALite: a web server for gene set cancer analysis. Bioinformatics. 2018;34:3771-3772
29. Miao YR, Zhang Q, Lei Q. et al. ImmuCellAI: A Unique Method for Comprehensive T-Cell Subsets Abundance Prediction and its Application in Cancer Immunotherapy. Adv Sci (Weinh). 2020;7:1902880
30. Zhang B, Wu Q, Li B. et al. m(6)A regulator-mediated methylation modification patterns and tumor microenvironment infiltration characterization in gastric cancer. Molecular Cancer. 2020;19:53
31. Charoentong P, Finotello F, Angelova M. et al. Pan-cancer Immunogenomic Analyses Reveal Genotype-Immunophenotype Relationships and Predictors of Response to Checkpoint Blockade. Cell Reports. 2017;18:248-262
32. Barbie DA, Tamayo P, Boehm JS. et al. Systematic RNA interference reveals that oncogenic KRAS-driven cancers require TBK1. Nature. 2009;462:108-112
33. Wilkerson MD, Hayes DN. ConsensusClusterPlus: a class discovery tool with confidence assessments and item tracking. Bioinformatics. 2010;26:1572-1573
34. Bykov V, Eriksson SE, Bianchi J. et al. Targeting mutant p53 for efficient cancer therapy. Nature Reviews Cancer. 2018;18:89-102
35. Fang ZH, Han ZC. The transcription factor E2F: a crucial switch in the control of homeostasis and tumorigenesis. Histology And Histopathology. 2006;21:403-413
36. Lersritwimanmaen P, Nimanong S. Hepatocellular Carcinoma Surveillance: Benefit of Serum Alfa-fetoprotein in Real-world Practice. Euroasian J Hepatogastroenterol. 2018;8:83-87
37. Boëlle PY, Debray D, Guillot L. et al. SERPINA1 Z allele is associated with cystic fibrosis liver disease. GENETICS IN MEDICINE. 2019;21:2151-2155
38. Tian C, Stokowski RP, Kershenobich D. et al. Variant in PNPLA3 is associated with alcoholic liver disease. Nature Genetics. 2010;42:21-23
39. Stickel F, Lutz P, Buch S. et al. Genetic Variation in HSD17B13 Reduces the Risk of Developing Cirrhosis and Hepatocellular Carcinoma in Alcohol Misusers. Hepatology. 2020;72:88-102
40. Buch S, Stickel F, Trépo E. et al. A genome-wide association study confirms PNPLA3 and identifies TM6SF2 and MBOAT7 as risk loci for alcohol-related cirrhosis. Nature Genetics. 2015;47:1443-1448
41. Chen DS, Mellman I. Oncology meets immunology: the cancer-immunity cycle. IMMUNITY. 2013;39:1-10
42. Miao YR, Zhang Q, Lei Q. et al. ImmuCellAI: A Unique Method for Comprehensive T-Cell Subsets Abundance Prediction and its Application in Cancer Immunotherapy. Adv Sci (Weinh). 2020;7:1902880
43. Mahoney KM, Rennert PD, Freeman GJ. Combination cancer immunotherapy and new immunomodulatory targets. Nature Reviews Drug Discovery. 2015;14:561-584
44. Nebot-Bral L, Coutzac C, Kannouche PL. et al. Why is immunotherapy effective (or not) in patients with MSI/MMRD tumors? Bull Cancer. 2019;106:105-113
45. Li GZ, Liang HF, Liao B. et al. PX-12 inhibits the growth of hepatocelluar carcinoma by inducing S-phase arrest, ROS-dependent apoptosis and enhances 5-FU cytotoxicity. American Journal of Translational Research. 2015;7:1528-1540
46. Lorenzo N, Sabina DM, Guido C. et al. DCLK1, a Putative Stem Cell Marker in Human Cholangiocarcinoma. Hepatology. 2021;73:144-159
47. Bayo J, Fiore EJ, Dominguez LM. et al. A comprehensive study of epigenetic alterations in hepatocellular carcinoma identifies potential therapeutic targets. Journal of Hepatology. 2019;71:78-90
48. Esparza-Baquer A, Labiano I, Sharif O. et al. TREM-2 defends the liver against hepatocellular carcinoma through multifactorial protective mechanisms. GUT. 2020
49. Yi D, Wang R, Shi X. et al. METTL14 promotes the migration and invasion of breast cancer cells by modulating N6-methyladenosine and hsa-miR-146a-5p expression. Oncology Reports. 2020;43:1375-1386
50. Wu L, Wu D, Ning J. et al. Changes of N6-methyladenosine modulators promote breast cancer progression. BMC Cancer. 2019;19:326
51. Niu Y, Lin Z, Wan A. et al. RNA N6-methyladenosine demethylase FTO promotes breast tumor progression through inhibiting BNIP3. Molecular Cancer. 2019;18:46
52. Pan XY, Huang C, Li J. The emerging roles of m(6)A modification in liver carcinogenesis. International Journal of Biological Sciences. 2021;17:271-284
53. Liu X, Liu J, Xiao W. et al. SIRT1 Regulates N(6) -Methyladenosine RNA Modification in Hepatocarcinogenesis by Inducing RANBP2-Dependent FTO SUMOylation. Hepatology. 2020
54. Chen Y, Zhao Y, Chen J. et al. ALKBH5 suppresses malignancy of hepatocellular carcinoma via m(6)A-guided epigenetic inhibition of LYPD1. Molecular Cancer. 2020;19:123
55. Siegel RL, Miller KD, Jemal A. Cancer statistics, 2019. CA Cancer J Clin. 2019;69:7-34
56. Rosenbaum SR, Wilski NA, Aplin AE. Fueling the Fire: Inflammatory Forms of Cell Death and Implications for Cancer Immunotherapy, Cancer Discovery. 2021;11:266-281.
57. Horton BL, Fessenden TB, Spranger S. Tissue Site and the Cancer Immunity Cycle. Trends Cancer. 2019;5:593-603
58. Bian J, Lin J, Long J. et al. T lymphocytes in hepatocellular carcinoma immune microenvironment: insights into human immunology and immunotherapy. American Journal of Cancer Research. 2020;10:4585-4606
59. Refolo G, Ciccosanti F, Di Rienzo M. et al. Negative Regulation of Mitochondrial Antiviral Signaling Protein-Mediated Antiviral Signaling by the Mitochondrial Protein LRPPRC During Hepatitis C Virus Infection. HEPATOLOGY. 2019;69:34-50
60. Arguello AE, DeLiberto AN, Kleiner RE. RNA Chemical Proteomics Reveals the N(6)-Methyladenosine (m(6)A)-Regulated Protein-RNA Interactome. JOURNAL OF THE AMERICAN CHEMICAL SOCIETY. 2017;139:17249-17252
61. Li Y, Gu J, Xu F. et al. Molecular characterization, biological function, tumor microenvironment association and clinical significance of m6A regulators in lung adenocarcinoma. Briefings in Bioinformatics. 2020
62. Liao S, Sun H, Xu C. YTH Domain: A Family of N(6)-methyladenosine (m(6)A) Readers. Genomics Proteomics Bioinformatics. 2018;16:99-107
63. Chen M, Wei L, Law CT. et al. RNA N6-methyladenosine methyltransferase-like 3 promotes liver cancer progression through YTHDF2-dependent posttranscriptional silencing of SOCS2. Hepatology. 2018;67:2254-2270
64. Yu R, Li Q, Feng Z. et al. m6A Reader YTHDF2 Regulates LPS-Induced Inflammatory Response. International Journal of Molecular Sciences. 2019 20
65. Schwartz S, Mumbach MR, Jovanovic M. et al. Perturbation of m6A writers reveals two distinct classes of mRNA methylation at internal and 5' sites. Cell Reports. 2014;8:284-296
66. Lan T, Li H, Zhang D. et al. KIAA1429 contributes to liver cancer progression through N6-methyladenosine-dependent post-transcriptional modification of GATA3. Molecular Cancer. 2019;18:186
67. Qian JY, Gao J, Sun X. et al. KIAA1429 acts as an oncogenic factor in breast cancer by regulating CDK1 in an N6-methyladenosine-independent manner/ Oncogene. 2019;38:6123-6141.
68. Patil DP, Chen CK, Pickering BF. et al. m(6)A RNA methylation promotes XIST-mediated transcriptional repression. Nature. 2016;537:369-373
69. Fang J, Hu M, Sun Y. et al. Expression Profile Analysis of m6A RNA Methylation Regulators Indicates They Are Immune Signature Associated and Can Predict Survival in Kidney Renal Cell Carcinoma. Dna and Cell Biology. 2020
70. Bayard Q, Meunier L, Peneau C. et al. Cyclin A2/E1 activation defines a hepatocellular carcinoma subclass with a rearrangement signature of replication stress. Nature Communications. 2018;9:5235
71. Hao WC, Zhong QL, Pang WQ. et al. MST4 inhibits human hepatocellular carcinoma cell proliferation and induces cell cycle arrest via suppression of PI3K/AKT pathway. Journal of Cancer. 2020;11:5106-5117
72. Lv Y, Xiao J, Liu J. et al. E2F8 is a Potential Therapeutic Target for Hepatocellular Carcinoma. Journal of Cancer. 2017;8:1205-1213
73. White JR, Thompson DT, Koch KE. et al. AP-2alpha-mediated activation of E2F and EZH2 drives melanoma metastasis. Cancer Research. 2021
74. Yu L, Wei J, Liu P. Attacking the PI3K/Akt/mTOR signaling pathway for targeted therapeutic treatment in human cancer. Seminars in Cancer Biology. 2021
75. Tang R, Zhang Y, Liang C. et al. The role of m6A-related genes in the prognosis and immune microenvironment of pancreatic adenocarcinoma. PeerJ. 2020;8:e9602
76. Zhang C, Samanta D, Lu H. et al. Hypoxia induces the breast cancer stem cell phenotype by HIF-dependent and ALKBH5-mediated m⁶A-demethylation of NANOG mRNA. Proc Natl Acad Sci SA. 2016;113:E2047-E2056
77. Wang X, Han Y, Li J. et al. Multi-omics analysis of copy number variations of RNA regulatory genes in soft tissue sarcoma. Life Sciences. 2021;265:118734
78. Wang Y, Cong R, Liu S. et al. Decreased expression of METTL14 predicts poor prognosis and construction of a prognostic signature for clear cell renal cell carcinoma. Cancer Cell International. 2021;21:46
79. Liao Y, Yuan L, Zhang Z. et al. No Association Between FTO Gene Polymorphisms and Central Nervous System Tumor Susceptibility in Chinese Children. Pharmgenomics Pers Med. 2021;14:109-115
80. Richardson B. Primer: epigenetics of autoimmunity. Nat Clin Pract Rheumatol. 2007;3:521-527
81. Yang G, Wu D, Zeng G. et al. Correlation between miR-126 expression and DNA hypomethylation of CD4+ T cells in rheumatoid arthritis patients. Int J Clin Exp Pathol. 2015;8:8929-8936
82. Strickland FM, Richardson BC. Epigenetics in human autoimmunity. Epigenetics in autoimmunity - DNA methylation in systemic lupus erythematosus and beyond. Autoimmunity. 2008;41:278-286
83. Balada E, Ordi-Ros J, Serrano-Acedo S. et al. Transcript levels of DNA methyltransferases DNMT1, DNMT3A and DNMT3B in CD4+ T cells from patients with systemic lupus erythematosus. Immunology. 2008;124:339-347
84. Congras A, Hoareau-Aveilla C, Caillet N. et al. ALK-transformed mature T lymphocytes restore early thymus progenitor features. Journal Of Clinical Investigation. 2020;130:6395-6408
85. Margueron R, Reinberg D. The Polycomb complex PRC2 and its mark in life. Nature. 2011;469:343-349
86. Guo M, Price MJ, Patterson DG. et al. EZH2 Represses the B Cell Transcriptional Program and Regulates Antibody-Secreting Cell Metabolism and Antibody Production. Journal of Immunology. 2018;200:1039-1052
87. Yong H, Wu G, Chen J. et al. lncRNA MALAT1 Accelerates Skeletal Muscle Cell Apoptosis and Inflammatory Response in Sepsis by Decreasing BRCA1 Expression by Recruiting EZH2. Mol Ther Nucleic Acids. 2020;19:97-108
88. Tumes DJ, Onodera A, Suzuki A. et al. The polycomb protein Ezh2 regulates differentiation and plasticity of CD4(+) T helper type 1 and type 2 cells. Immunity. 2013;39:819-832
89. Mosmann TR, Cherwinski H, Bond MW. et al. Two types of murine helper T cell clone. I. Definition according to profiles of lymphokine activities and secreted proteins. Journal of Immunology. 1986;136:2348-2357
90. Watkins SK, Zhu Z, Watkins KE. et al. Isolation of immune cells from primary tumors. J Vis Exp. 2012:e3952.
91. Shi C, Pamer EG. Monocyte recruitment during infection and inflammation. Nature Reviews Immunology. 2011;11:762-774
92. Olingy CE, Dinh HQ, Hedrick CC. Monocyte heterogeneity and functions in cancer. J Leukoc Biol. 2019;106:309-322
93. Hanna RN, Cekic C, Sag D. et al. Patrolling monocytes control tumor metastasis to the lung. Science. 2015;350:985-990
94. Silvestre-Roig C, Fridlender ZG, Glogauer M. et al. Neutrophil Diversity in Health and Disease. Trends in Immunology. 2019;40:565-583
95. Ng LG, Ostuni R, Hidalgo A. Heterogeneity of neutrophils. Nature Reviews Immunology. 2019;19:255-265
96. Chatfield SM, Thieblemont N, Witko-Sarsat V. Expanding Neutrophil Horizons: New Concepts in Inflammation. Journal of Innate Immunity. 2018;10:422-431
97. Garley M, Jabłońska E. Heterogeneity Among Neutrophils. Arch Immunol Ther Exp (Warsz). 2018;66:21-30
98. Rosales C. Neutrophil: A Cell with Many Roles in Inflammation or Several Cell Types? Frontiers in Physiology. 2018;9:113
Author contact
![]() Corresponding authors: Co-correspondence to Jun Weng & Yi Gao. Jun Weng (PH.D), Department of Hepatobiliary Surgery II, Guangdong Provincial Research Center for Artificial Organ and Tissue Engineering, Guangzhou Clinical Research and Transformation Center for Artificial Liver, Institute of Regenerative Medicine, ZhuJiang Hospital, Southern Medical University, Guangzhou, Guangdong Province, China. State Key Laboratory of Organ Failure Research, Southern Medical University, Guangzhou, China. E-mail: 362593672com; ORCID: 0000-0003-0792-1526. Yi Gao (PH. D), Department of Hepatobiliary Surgery II, Guangdong Provincial Research Center for Artificial Organ and Tissue Engineering, Guangzhou Clinical Research and Transformation Center for Artificial Liver, Institute of Regenerative Medicine, ZhuJiang Hospital, Southern Medical University, Guangzhou, Guangdong Province, China. State Key Laboratory of Organ Failure Research, Southern Medical University, Guangzhou, China. Tel: +86-20-6278256; Fax: +86-20-61643207; E-mail: drgaoycom; ORCID: 0000-0003-3525-0133.
Corresponding authors: Co-correspondence to Jun Weng & Yi Gao. Jun Weng (PH.D), Department of Hepatobiliary Surgery II, Guangdong Provincial Research Center for Artificial Organ and Tissue Engineering, Guangzhou Clinical Research and Transformation Center for Artificial Liver, Institute of Regenerative Medicine, ZhuJiang Hospital, Southern Medical University, Guangzhou, Guangdong Province, China. State Key Laboratory of Organ Failure Research, Southern Medical University, Guangzhou, China. E-mail: 362593672com; ORCID: 0000-0003-0792-1526. Yi Gao (PH. D), Department of Hepatobiliary Surgery II, Guangdong Provincial Research Center for Artificial Organ and Tissue Engineering, Guangzhou Clinical Research and Transformation Center for Artificial Liver, Institute of Regenerative Medicine, ZhuJiang Hospital, Southern Medical University, Guangzhou, Guangdong Province, China. State Key Laboratory of Organ Failure Research, Southern Medical University, Guangzhou, China. Tel: +86-20-6278256; Fax: +86-20-61643207; E-mail: drgaoycom; ORCID: 0000-0003-3525-0133.