Impact Factor ISSN: 1449-2288
- Issue 12; 2026
- Issue 11; 2026
- Issue 10; 2026
- Issue 9; 2026
- Issue 8; 2026
- Volume 22; 2026
- Past Issues
- Advance Articles
- Editorial Board
- Cover Images
- Index & Coverage
- Cover Suggestion
- Special Issues
Introduction
Materials and methods
Results
Discussion
Supplementary Material
Acknowledgements
References

 Global reach, higher impact
Int J Biol Sci 2022; 18(8):3390-3404. doi:10.7150/ijbs.69833 This issue Cite
Research Paper
Dynamics of the gut-liver axis in rats with varying fibrosis severity
Hongyan Xiang, Zongyi Liu, Huanyu Xiang, Dejuan Xiang, Shuang Xiao, Jing Xiao, Wei Shen, Peng Hu, Hong Ren, Mingli Peng ![]()
Key Laboratory of Molecular Biology for Infectious Diseases (Ministry of Education), Institute for Viral Hepatitis, Department of Infectious Diseases, The Second Affiliated Hospital, Chongqing Medical University, Chongqing 400010, China.
Received 2021-12-7; Accepted 2022-4-22; Published 2022-5-9
Abstract

The classic carbon tetrachloride (CCl4)-induced liver injury model is widely used to study the pathogenesis of fibrosis and evaluate anti-fibrosis drugs. Here, we investigated the dynamic changes in the gut microbiota, bile acids (BAs) and the gut barrier over different fibrosis severities in a CCl4-based model. 16S rDNA sequencing demonstrated that the beneficial taxon Lactobacillus was always underrepresented, and pathogens including Escherichia_Shigella, Clostridium_sensu_stricto_1, Colidextribacter, and Lachnospiraceae_UCG_010 were significantly overrepresented across liver fibrosis severities. Gut dysbiosis was more severe at the early stage of liver injury and advanced stage of fibrosis. An ultra-performance liquid chromatography-tandem mass spectrometry (UPLC-MS/MS) analysis revealed that with the progress of fibrosis, unconjugated BAs in faeces were significantly decreased and conjugated BAs in serum were significantly increased. The FXR-SHP signalling pathway in the liver and ileum was statistically repressed in the fibrosis groups. Determination of lipopolysaccharide (LPS) and fluorescein isothiocyanate (FITC)-dextran levels in plasma showed that the intestinal barrier remained relatively intact in the advanced fibrosis stage. The advances in knowledge of the gut-liver axis provided by this study yield new insights for application in research and drug evaluation.
Keywords: gut-liver axis, liver fibrosis, gut microbiota, bile acid, gut barrier
Introduction
The gut-liver axis refers to the anatomical and functional relationship between the liver and the intestine. The gut microbiota, microbial metabolites and bile acids (BAs) are the main signals in the axis, while the gut mucosal and vascular barriers provide an environment for the interactions between the gut and the liver [1]. The gut-liver axis has been demonstrated to be involved in the pathogenesis of prevalent liver diseases, such as alcohol-associated liver disease (ALD), nonalcoholic fatty liver disease (NAFLD), cholestatic liver diseases, and hepatocellular carcinoma (HCC), affecting the degree of hepatic inflammation, steatosis, fibrosis/cirrhosis and complications of cirrhosis [2, 3].
Disruption of the gut-liver axis is the pathophysiological basis for many chronic liver diseases (CLDs). The main features of a disrupted gut-liver axis include an altered intestinal microbiota, changes in luminal levels of BAs, and gut barrier damage [4]. Dysregulation of the gut microbiota is the cornerstone of gut-liver axis disruption in CLDs, which could result in subsequent alterations in the levels of gut metabolites (secondary BAs, ethanol, and trimethylamine) and intestinal barrier dysfunction [4, 5]. Gut dysbiosis-related metabolism, especially BA alteration, contributes to alcohol-associated injury [6]. Alterations in microbiota composition and bacterial overgrowth challenge a hyperpermeable intestinal barrier with an overload of pathogen-associated molecular patterns (PAMPs) or metabolites such as trimethylamine in NAFLD, which elicit liver inflammation [1, 7]. Patients with cirrhosis have revealed reduced bacterial diversity and a shift in family structure towards greater abundances of potentially pathogenic taxa such as Enterococcaceae and Staphylococcaceae and lower abundances of beneficial autochthonous taxa such as Lachnospiraceae and Ruminococcaceae [1]. Intestinal BA flow is reduced in patients with cirrhosis, which in turn aggravates the intestinal flora disorder and changes in BA composition, ultimately suppressing intestinal FXR signalling, which compromises mucus and antimicrobial peptide synthesis and gut-vascular barrier integrity [8, 9].
Due to the gradual clarification of the crosstalk between the gut-liver axis and liver disease, interventions targeting components of the gut-liver axis such as intestinal content, the intestinal microbiome and the intestinal mucosa, to treat chronic liver injury are the future trends [10, 11]. Currently, the classic animal model for evaluating anti-fibrotic drugs is the carbon tetrachloride (CCl4)-induced liver injury model, which has characteristics similar to those of the human liver fibrosis process caused by toxic damage [12, 13]. However, the changes in the gut-liver axis in this model itself across a range of fibrosis severity remain unclear. Here, this study aimed to explore the dynamic changes in the gut-liver axis, including the intestinal microbiota, BAs, and the gut barrier, at different fibrosis stages in CCl4-treated rats. The advances in knowledge of the gut-liver axis provided by this study yield new insights for application in research and drug evaluation.
Materials and methods
Reagents and antibodies
Antibodies against alpha-smooth muscle actin (α-SMA, ab124964), collagen I (COL1A1, ab260043), cytochrome P450 family 8 subfamily B member 1 (CYP8B1, ab191910), and goat anti-rabbit IgG (ab6712) were purchased from Abcam Inc. (Cambridge, UK); Antibodies to cytochrome P450 family 7 subfamily A member 1 (CYP7A1, A10615), farnesoid X receptor (FXR, A12788), small heterodimer partner (SHP, A1836), glyceraldehyde-3-phosphate dehydrogenase (GAPDH, AC033), and goat anti-mouse IgG (AS003) were purchased from ABclonal Inc.(Wuhan, China). Taurine bile salt (TCA, T8510) and taurine (T8420) were purchased from Solarbio (Beijing, China). Fibroblast growth factor 15 (FGF15) ELISA Kit was purchased from Uscn Life Science (CEL154Ra, Wuhan, China). 4-kDa fluorescein isothiocyanate (FITC)-dextran was purchased from Sigma (Aldrich, St. Louis, MO, United States). Tachypleus amoebocyte lysate was purchased from Xiamen Bioendo Technology Co., Ltd. (Fujian, China). Carbon tetrachloride, olive oil, and chloral hydrate were purchased from Macklin Biochemical Co., Ltd. (Shanghai, China). All the reagents were of analytical quality.
Animal study and sample collection
Male Sprague-Dawley (SD) rats at 6 weeks of age and weighing 140-160 g were purchased from the Animal Center of Chongqing Medical University. The rats were housed in standard cages with free access to water and food on a 12:12 h light-dark cycle in a temperature-and humidity-controlled environment. Specific pathogen-free (SPF) rats were randomly allocated to the normal control (NC) and CCl4 groups. Liver fibrosis was induced by intraperitoneal administration of CCl4 (50% CCl4 in olive oil at 1 ml/kg) twice per week for 12 weeks in the CCl4 group, while the control group rats received only olive oil (0.5 ml/kg) in the same manner.
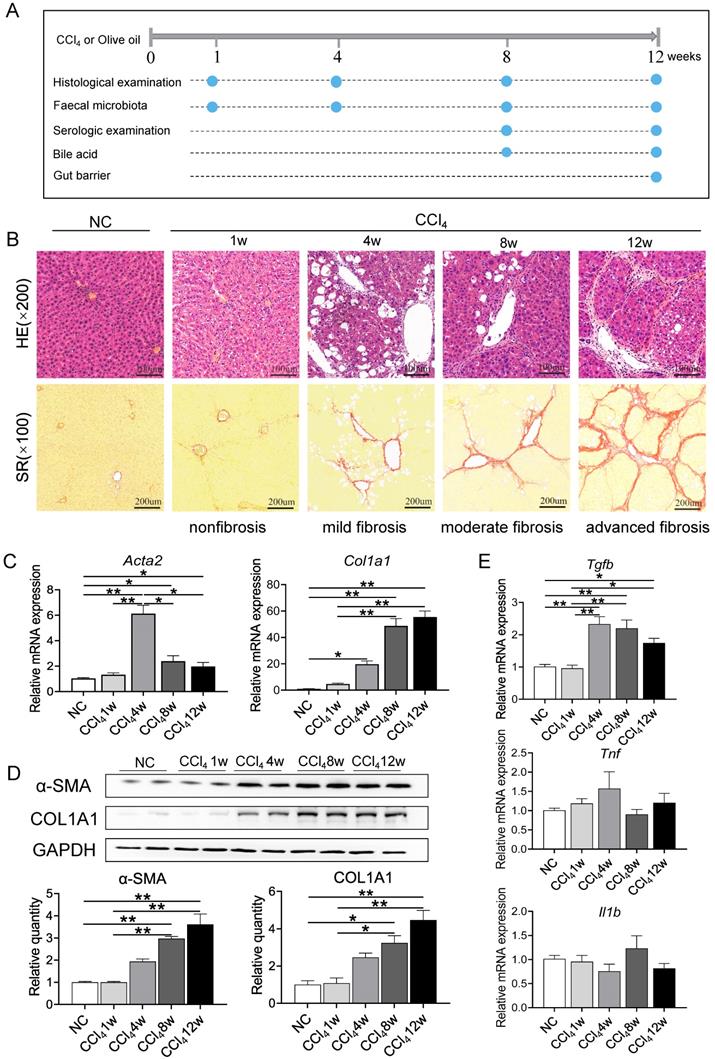
Faecal samples from the same rats were collected at 4 different time points at 1, 4, 8 and 12 weeks. The specimens were gathered at a fixed time point (approximately 9 am) on a clean bench, snap-frozen in liquid nitrogen and then stored at -80 °C until use. Rats were sacrificed by intraperitoneal injection of 10% chloral hydrate (3 ml/kg) mainly at 8 or 12 weeks. The animal experimental design is shown in Figure 1A. All experimental procedures were reviewed and approved by the Chongqing Medical University Ethics Committee.
Liver injury and fibrosis were induced successfully by CCl4. (A) Animal experimental design. (B) Representative images of HE staining (original magnification × 200) and SR staining (original magnification × 100) of liver sections from the NC and CCl4 groups. (C-D) mRNA and protein levels of ACTA2 and COL1A1 in fibrosis progression. (E) Gene expression of inflammatory factors in fibrosis progression. Each value is expressed as the mean ± SEM. NC, normal control group; CCl4, CCl4-treated group; HE, haematoxylin-eosin; SR, Sirius red; Acta2 /α-SMA, actin alpha 2, smooth muscle; Col1a1/COL1A1, collagen type I alpha 1 chain; GAPDH, glyceraldehyde-3-phosphate dehydrogenase; Tgfb, transforming growth factor beta, Tnf, tumor necrosis factor; Il1b, interleukin 1 beta. *p<0.05, **p<0.01.
Biochemical analysis
Blood was collected by cardiac puncture, and serum was obtained after centrifugation of the blood at 3000 rpm for 10 min at 4 °C. Alanine aminotransferase (ALT), aspartate aminotransferase (AST), albumin (ALB), alkaline phosphatase (ALP), total bile acid (TBa), total bilirubin (TBili), and direct bilirubin (DBili) were detected by a biochemical automatic analyzer at the Clinical Laboratory of the Second Affiliated Hospital of Chongqing Medical University.
Histopathology
Paraformaldehyde-fixed and paraffin-embedded liver and ileum samples were sectioned and stained with haematoxylin-eosin (HE) to observe lesions, and collagen deposition was detected by staining with Sirius red (SR). The morphological changes were examined by a digital slide scanner and slide viewer software (Pannoramic DESK and Case Viewer 2.4, 3D Histech, Hungary). Liver fibrosis was categorized into 4 stages according to the Ishak score [14]: nonfibrosis (Ishak score 0), mild fibrosis (Ishak score 1-2), moderate fibrosis (Ishak score 3-4), and advanced fibrosis (Ishak score 5-6). The integrity of the ileal epithelium was blindly assessed by two senior pathologists following previously described criteria [15].
Quantitative PCR and Western blot analysis
Total RNA was extracted using an RNA Pure Total RNA Fast Isolation Kit (BioTeke, China) following the manufacturer's instructions. For each sample, 1 μg of total RNA was reverse transcribed using a PrimeScript RT Reagent Kit with gDNA Eraser (TAKARA, Japan) to produce cDNA. Gene expression was measured by qPCR with a CFX Connect™ Real-Time PCR System (Bio-Rad, USA) using the forward and reverse primers shown in Table S1. Data were analyzed using the 2-ΔΔCt method, with GAPDH as the reference marker.
Total protein was extracted from pieces of liver tissues using a whole cell lysis assay (KeyGen Biotech, Jiangsu, China). Protein concentration was determined by the BCA Protein Assay Kit (KeyGen Biotech, Jiangsu, China). Quantified proteins were separated on SDS-PAGE and transferred to PVDF membranes (Millipore Corporation, USA). After blocking by 5% milk, membranes were incubated with primary antibodies against α-SMA (dilution 1:5000), COL1A1 (dilution 1:3000), CYP7A1 (dilution 1:1000), CYP8B1 (dilution 1:1000), FXR (dilution 1:1000), and SHP (dilution 1:1000) at 4 °C overnight. Anti-GAPDH (dilution 1:5000) was probed as an internal control. Then, membranes were washed with TBST and incubated with the secondary antibodies for 2 h at room temperature. Protein bands were visualized by using ECL (Advansta, USA). Levels of target protein band densities were analyzed with a ChemicDoc™ MP Imaging System (Bio-Rad).
Intestinal microbiota analysis
The intestinal microbiota in 84 stool samples from the 4 time points for the two groups was sequenced at Novogene Co., Ltd. (Beijing, China). DNA was extracted by the cetyltrimethylammonium bromide (CTAB) method, and 16S ribosomal RNA genes were amplified using primers (341F 5'-CCTAYGGGRBGCASCAG-3' and 806R 5'-GGACTACNNGGGTATCTAAT-3') [18] with barcodes. Sequencing libraries were generated using a TruSeq® DNA PCR-Free Sample Preparation Kit (Illumina, USA) following the manufacturer's recommendations. Operational taxonomic units (OTUs) were clustered with a 97% similarity cut-off using Uparse software (Uparse v7.0.1001), and a total of 3588 OTUs, including 2 kingdoms, 20 phyla, 274 genera, and 171 species, were included in the subsequent analysis.
Bacterial richness and diversity within groups were evaluated by α diversity through 4 indexes: Shannon, Simpson, Chao1 and ACE using QIIME (version 1.7.0). Microbial community structure and distribution across groups were evaluated by principal coordinate analysis (PCoA) on weighted UniFrac distance metrics using QIIME software (version 1.9.1), and the difference was calculated by analysis of molecular variance (AMOVA) using mothur (version 1.33.3). Differentially abundant taxa among groups were identified by the linear discriminant analysis (LDA) effect size (LEfSe) method using LEfSe software (version 1.0), and an LDA score > 3 was set as the discrimination threshold.
Bile acid analysis
Faeces and serum from representative normal rats and CCl4-treated rats at the moderate and advanced fibrosis stages were selected for BA determination at Novogene Co., Ltd. (Beijing, China). One hundred milligrams of faeces was resuspended in liquid nitrogen and then added to 0.9 ml of water to prepare a 10-times diluted sample followed by a gradient of 20-times and 200-times dilution. One hundred microliters of serum or pre-diluted faeces suspension was homogenized with 300 or 500 μL of acetonitrile/methanol (8:2) containing mixed internal standards. After centrifugation, protein precipitation, the supernatant was collected and further analyzed for BA concentration using a UPLC-MS/MS system (ExionLC™ AD UHPLC-QTRAP 6500+, AB SCIEX Corp, Boston, MA, USA). Separation was performed on an Agela Venusil MP C18 column (2.1×100 mm, 2.5 μm) at 50 °C. The mobile phase, consisting of 0.1% formic acid in water and acetonitrile, was delivered at a flow rate of 0.50 ml/min. The results are expressed as nanograms of BA per gram of stool and nanograms of BA per milliliter of serum.
Faecal BSH activity assay
Bile salt hydrolase (BSH) activity was measured by determining the amount of amino acids liberated from conjugated bile salts as previously described with several modifications [16]. Briefly, total protein extract was prepared from 50 mg of faecal samples in 250 ul of RIPA by sonication. Protein concentrations were determined with a BCA protein assay kit (keyGEN, Jiangsu, China). Incubation was carried out by adding 10 ul of faecal protein supernatant, 10 ul of TCA (10 mM), and 10ul of paraffin oil to 180 ul of PBS. After a 30 min incubation at 37 °C, reactions were stopped by adding 200ul trichloroacetic acid. Then the mixture was centrifuged and 50 ul of supernatant was added to 950 ul ninhydrin reagent (250 ul of 15% ninhydrin, 600 ul of glycerol, 100 ul of 0.5 M citrate buffer). The preparation was vortexed and boiled for 15 min. After subsequent cooling, the absorbance at 570 nm was determined using taurine as standard.
FGF15 ELISA
Serum FGF15 was quantified by an ELISA kit following the manufacturer's protocol.
Intestinal permeability measurement
FITC-dextran assay
FITC-dextran levels were measured according to a previously described study, with slight modification [17]. Briefly, after rats under anesthesia (10% chloral hydrate 3 ml/kg, intraperitoneally), a midline laparotomy incision was performed, and a 10-cm segment of the distal ileum was isolated between silk ties. A solution of 1 ml of PBS containing 20 mg of 4-kDa FITC-dextran was injected into the lumen of the isolated intestinal segment. The bowel was returned to the abdominal cavity, and the abdomen was covered by sterile gauze, which was wetted with a saline solution at 37 °C. After 30 min, blood was collected by cardiac puncture, and plasma was obtained by centrifugation. Plasma fluorescence was measured at an excitation/emission wavelength of 485 nm/535 nm in a multimode microplate reader to calculate the concentration of FITC-dextran in the blood.
Plasma lipopolysaccharide (LPS) assay
Plasma LPS quantification was performed using tachypleus amoebocyte lysate according to the manufacturer's protocol. Briefly, blood was placed in endotoxin removal heparinized Eppendorf tubes and centrifuged at 3000 rpm for 2 min at 4 °C. Next, 0.1 ml of plasma supernatant was added to 0.9 ml of blood sample treatment fluid. Then, a standard solution was prepared and diluted to 0.1, 0.05, 0.025 and 0.01 EU/mL. Next, tachypleus amoebocyte lysate was added, and the sample was vortexed and then incubated at 37 °C for 35 min. Subsequently, the chromogenic substrate was added, and the sample was vortexed and incubated at 37 °C for 6 min. Finally, azo reagent was added, the sample was vortexed and allowed to stand for 5 min, and the absorbance was read at 545 nm.
Statistical analysis
Data are expressed as the mean ± SEM unless otherwise stated. Statistical analyses were performed by SPSS (IBM SPSS 26.0) between groups and displayed by GraphPad Prism (version 8.0.2.). The dynamic alteration of the gut microbiota among the 4 fibrosis stages was analyzed by the Friedman test. The correlations between the relative abundance of the microbiome constituents and ALT, AST and ALP levels were evaluated by Spearman's test. Comparisons of 16S rDNA sequencing and BA analysis not mentioned above were conducted using nonparametric statistics. Other parameters, such as body weight, biological indicators, and mRNA expression with a normal distribution and homogeneity of variance, were evaluated by Student's t test; otherwise, they were evaluated by the Mann-Whitney U test. P values were corrected by the Benjamini-Hochberg method for multiple comparisons, and P<0.05 was considered statistically significant.
Results
Characteristics of CCl4-induced liver fibrosis
With respect to the characterization of biochemical and histological changes associated with injury, inflammation, and fibrosis, CCl4-induced liver fibrosis and cirrhosis models mirror the pattern of human fibrosis and cirrhosis caused by toxic damage [12, 13]. As shown in Figure 1A, rats either received twice-weekly intraperitoneal injection of CCl4 or olive oil alone as a control for 12 weeks. Intoxication with CCl4 resulted in slower weight gain of rats in the model group at each sampling point (Figure S1A). The ratio of liver mass to body weight was significantly higher in CCl4-administered rats than in control rats at week 8 and week 12 (Figure S1B). In addition, ALT, AST, ALP activity and TBa, DBili, and TBili levels in the CCl4 groups were significantly increased compared to control groups, and CCl4-treated rats had a lower serum ALB level than the control rats at the two sampling points (Figure S1C).
Liver samples were stained with HE and SR to evaluate histopathologic changes and tissue fibrosis. Figure 1B shows that liver tissue from control rat exhibited normal cellular architecture and normal collagen distribution. Liver specimens from rats injected with CCl4 for 1, 4, 8 and 12 weeks exhibited different pathological changes and fibrosis degrees. Liver tissue from the CCl4 group at week 1 (nonfibrosis, Ishak score 0) demonstrated some cellular damage and centrilobular congestion with no infiltration of inflammatory cells. Repetitive dosing of CCl4 resulted in hepatocytic fatty degeneration and extension of fibres in the central vein and portal area at week 4 (mild fibrosis, Ishak score 1-2), bridging hepatic fibrosis at week 8 (moderate fibrosis, Ishak score 3-4) and extensive collagen deposition and pseudolobular formation at week 12 (advanced fibrosis/cirrhosis, Ishak score 5-6). The severity of fibrosis was positively associated with further CCl4 injections, progressing from no obvious fibre deposition at week 1 to nodule formation or cirrhosis at week 12.
To further confirm the degree of fibrosis, expression levels of genes related to hepatic stellate cells (HSCs) activation (actin alpha 2, smooth muscle, Acta2; transforming growth factor beta cytokines, Tgfb; tumor necrosis factor, Tnf; interleukin 1 beta, Il1b) and ECM production (collagen type I alpha 1 chain, Col1a1) and protein levels of α-SMA and COL1A1 were detected during liver fibrosis. Compared to normal control and nonfibrosis condition, Acta2 was significantly upregulated since week 4 (mild fibrosis stage), with a consistent trend of change with Tgfb (Figures 1C, 1E). Repeated administration of CCl4 caused a gradual elevation of Col1a1 mRNA expression and protein levels of COL1A1 and α-SMA, confirming the progression of liver fibrosis (Figure 1D). However, there was no significant difference in the gene expression of inflammatory factors Tnf and Il1b between the normal control group and CCl4-treated groups (Figure 1E).
Gut microbiota profile at different fibrosis stages
To explore the alteration of the gut microbiota at different fibrosis stages, we compared the gut microbiota composition between the two groups at the same time points. PCoA plots showed that samples with nonfibrosis, mild fibrosis and advanced fibrosis were separated from their corresponding normal controls (Figures 2A-2B, 2D, Table S2), while samples with moderate fibrosis mixed together with normal control samples (Figure 2C, Table S2, AMOVA p=0.23).
Comparison of gut microbiota compositions between the normal control groups and fibrosis groups. (A-D) PCoA plots of microbial communities at weeks 1, 4, 8 and 12. PCoA based on weighted_UniFrac distance was tested with AMOVA, and the samples at week 8 were mixed together, while obvious differences were observed at weeks 1, 4 and 12 between the two groups (n=10-12). (E-H) Cladogram exhibiting distinctive gut microbiome profiles from the phylum to the species level from inside to outside. Yellow circles represent taxa that did not differ between the two groups. Green and red circles represent distinctive microbiota constituents in the normal control and CCl4 groups, respectively. The size of the circle depicts the relative abundance. p_, phylum; c_, class; o_, order; f_, family.
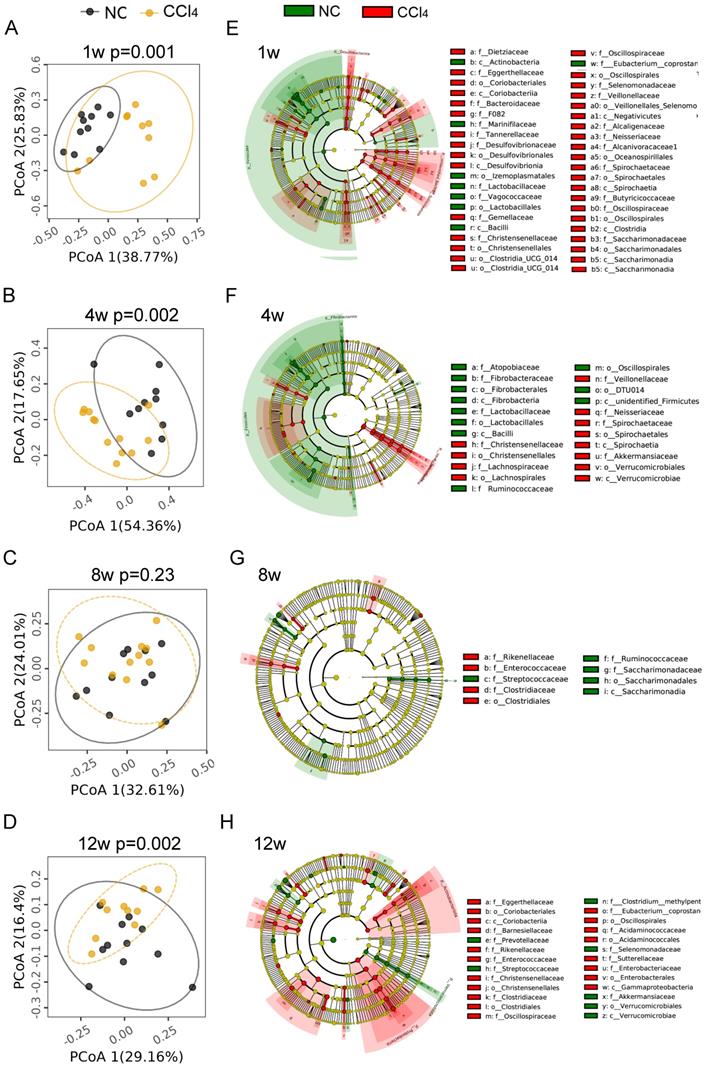
Although there was no difference in gut microbial diversity or richness between the control and the liver injury groups at the four different fibrosis stages (Figures S2A-B), the abundance of gut microbiota at different phylogenetic levels remained significantly different between the two groups. As shown in Figures 2E-2H, microbial cladograms exhibited distinctive gut microbiome profiles from the phylum to the species levels at the 4 fibrosis stages. Before the formation of liver fibrosis (nonfibrosis), the most significant changes in gut microbiota were in Desulfovibrio (Desulfobacterota), Treponema (Spirochaetota) and Lactobacillus (Firmicutes), with changes from the genus level to the phylum level. Among them, the relative abundance of genera Desulfobacterota and Treponema increased in the liver injury group, and the relative abundance of Lactobacillus decreased (Figure 2E, Table S3). At the mild fibrosis stage, the relative abundance of Treponema and Akkermansia (Verrucomicrobiota) significantly increased, while the relative abundance of Lactobacillus and Fibrobacter (Fibrobacterota) decreased (Figure 2F, Table S3). For the moderate fibrosis stage, genera Rikenellaceae_RC9_gut_group, Clostridium_sensu_stricto_1, Enterococcus and Lachnospiraceae_UCG_010 were increased, while Streptococcus, Ruminococcus and Candidatus_Saccharimonas were decreased (Figure 2G, Table S3). At this stage, gut microbiota differences were mainly noted at low phylogenetic levels like genus and species, indicating that gut dysbiosis was alleviated. At the advanced fibrosis stage, Actinobacteriota, Proteobacteria and Verrucomicrobiota were the most changed taxa (Figure 2H, Table S3). The increase in the abundance of potentially pathogenic Enterobacteriaceae (Proteobacteria) and Eggerthellaceae (Actinobacteriota) and the decrease in the abundance of beneficial Akkermansiaceae (Verrucomicrobiota) implicated that dysbiosis deteriorated again. As liver fibrosis progressed, the profile of the dysregulated microbiota varied generally, but Lactobacillus at different phylogenetic levels were consistently underrepresented in fibrosis groups (Figures 2E-2H, Table S3). The relative abundance of Lactobacillus_murinus was reduced over the four fibrosis stages, other Lactobacillus species like Lactobacillus_intestinalis, Lactobacillus_johnsonii, Lactobacillus_reuteri, Lactobacillus_sp_KC38 and Lactobacillus_faecis was significantly reduced at the nonfibrosis and/or mild fibrosis stages (Table S3).
Dynamics of the characteristic gut microbiome over the evolution of liver fibrosis
To investigate the temporal development of the gut microbiota in the process of liver fibrosis, faecal samples from 4 different time points (weeks 1, 4, 8 and 12; equivalent to 7, 10, 14, and 18 weeks of age in rats) were analyzed. PCoA plots showed that samples were basically clustered together at different time points, but differences still existed between any two time points (Figure S2C, Table S2), suggesting that gut microbiome community in the same environment changes slightly during development. The gut microbiota at week 1 in the CCl4 group showed high variability, reflecting gut microbiota susceptibility to short-term environment exposure (Figure S2C). In normal rats, gut microbiota diversity and richness continued to increase with age, peaking at approximately 14 weeks of age (at week 8) and then remaining stable (Figure S2D). However, in the presence of liver fibrosis, gut microbiota diversity increased with age, and the diversity at 18 weeks (week 12) was significantly higher than the previous three time points, indicating a delay in community stability (Figure S2D). Gut microbiota richness remained relatively stable in CCl4-treated rats compared to that in normal rats (Figure S2E).
At the phylum level, both the control group and CCl4 group were dominated by Firmicutes (means of 52% and 36%, respectively), Bacteroidota (29% and 32%, respectively), Spirochaetota (7% and 14%, respectively) and Proteobacteria (3% and 5%, respectively) (Figure 3A, Table S4). Firmicutes and Proteobacteria exhibited distinctive temporal changes in the relative abundance between the two groups. The relative abundance of Firmicutes remained relatively stable in control rats over time, whereas it increased in CCl4-treated rats throughout the progression of liver fibrosis. The relative abundance of Proteobacteria was higher at week 1 in normal rats but higher at nonfibrosis and advanced fibrosis stages in CCl4-treated rats (Figure 3A, Table S4). At the genus level, the relative abundance of Lactobacillus showed a decreasing trend in the normal control groups, while that showed an increasing trend in the CCl4 treatment groups. Although the relative abundance of Lactobacillus attempted to increase under fibrosis conditions, it was consistently lower than that under normal conditions (Figure 3B, Table S5). Changes in the relative abundance of other phyla and genera were shown in Table S4 and Table S5.
Temporal development of the gut microbiota in the normal control and the fibrosis groups. (A) Temporal development of the major phyla (n=10-12). (B) Temporal development of the major genera (n=10-12). (C) Temporal development of distinctive gut microbiota (overrepresented in liver injury groups) over liver fibrosis (n=6). (D) Temporal development of distinctive gut microbiota (underrepresented in liver injury groups) over liver fibrosis (n=6). The same color represents the same numbered rat # the genus was increased in the fibrosis group, * the genus was decreased in the fibrosis group compared to that in the normal control group. The alteration of the gut microbiota among the four fibrosis stages was analyzed by the Friedman test.
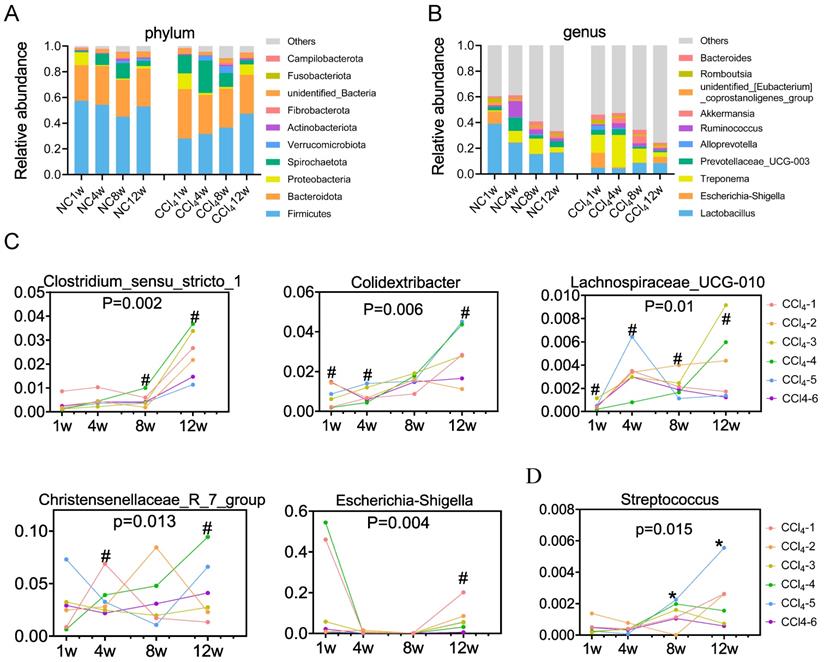
Compared to those in the control group, genera Clostridium_sensu_stricto_1, Colidextribacter, Lachnospiraceae_UCG_010, Christensenellaceae_R_7_group and Escherichia_Shigella were generally overrepresented in the liver injury group, further enriched in the advanced fibrosis stage (Figure 3C). Streptococcus was underrepresented in the moderate and advanced fibrosis stages, despite an increasing trend from the mild fibrosis to the advanced fibrosis stage (Figure 3D). Spearman correlation tests demonstrated that relative abundances of Clostridium_sensu_stricto_1, Escherichia_Shigella and Lachnospiraceae_UCG_010 were positively associated with serum ALT, AST and ALP levels (Figure S3A). Relative abundances of Christensenellaceae_R_7_group and Colidextribacter were positively associated with the ALT level (Figure S3A). Relative abundance of Streptococcus was found to be negatively associated with serum ALT, AST and ALP levels (Figure S3B).
Faecal unconjugated BAs decreased and serum conjugated BAs increased in liver fibrosis progression
BAs are the link between the gut and the liver and play important roles in bidirectional communication. We detected BAs in faeces and serum at the moderate and advanced hepatic fibrosis stages. With the progression of liver fibrosis, the total BA level in faeces decreased, while that in serum increased (Figures 4A, 4E). Advanced fibrosis resulted in the lowest faecal secondary BA levels, unconjugated BA levels and unconjugated/conjugated BA ratio compared to those in the moderate fibrosis and the control condition (Figures 4B, 4D). Among individual BAs, lithocholic acid (LCA), deoxycholic acid (DCA), hyodeoxycholic acid (HDCA), 12-ketolithocholic acid (12-ketolLCA) and ursodeoxycholic acid (UDCA) were significantly reduced in faeces with the progression of liver fibrosis (Figure 4C).
Faecal and serum BA profiles (faecal n=6 per group, serum n=4 per group). (A) Faecal total BA levels. (B) Faecal secondary BA and unconjugated BA levels. (C) HDCA, LCA, DCA, 12-ketoLCA, and UDCA decreased significantly in the liver fibrosis groups. (D) The ratio of unconjugated BAs to conjugated BAs in faeces. (E) Serum total BA levels. (F-H) Composition of serum BAs in the normal control, the moderate fibrosis stage, and the advanced fibrosis stage. (I) The ratio of conjugated BAs to total BAs in serum. (J) Comparison of individual BA between the normal control group and the fibrosis groups, * representing difference compared to the normal control group. (K) Faecal BSH activity. Data are expressed as the mean ± SEM. BA(s), bile acid(s); uncon/con BAs, unconjugated BAs/conjugated BAs; CA, cholic acid; β-MCA, beta-muricholic acid; α-MCA, alpha-muricholic acid; GUDCA, glycoursodeoxycholic acid; CDCA, chenodeoxycholic acid; UDCA, ursodeoxycholic acid; HDCA, hyodeoxycholic acid; DCA, deoxycholic acid; 12-ketoLCA, 12-ketolithocholic acid; 7-ketoLCA, 7-ketolithocholic acid; CDCA-3Glu, chenodeoxycholic acid-3-β-D-glucuronide; 3-DHCA, 3-dehydrocholic acid; LCA, lithocholic acid; isoLCA, isolithocholic acid; TCA, taurocholic acid; T-α-MCA, tauro-alpha-muricholic acid; GCA, glycocholic acid hydrate; THDCA, taurohyodeoxycholic acid; GCDCA, glycochenodeoxycholic acid; TCDCA, taurochenodeoxycholic acid; GDCA, glycodeoxycholic acid; TDCA, taurodeoxycholic acid; GLCA, glycolithocholic acid; TLCA, taurolithocholic acid; BSH, bile salt hydrolase. *p<0.05, **p<0.01.
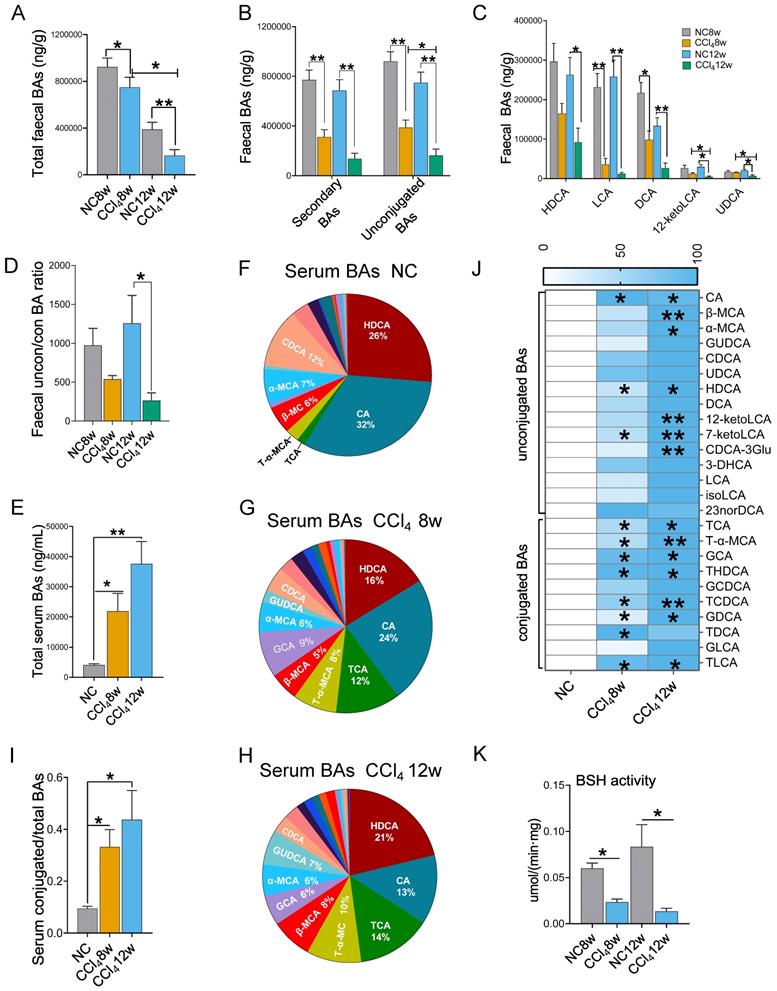
Serum BAs were dominated by unconjugated BAs (Figures 4F-4H). However, in the presence of liver fibrosis, the ratio of conjugated BAs increased (Figure 4I), among which tauro-alpha-muricholic acid (T-α-MCA) and taurocholic acid (TCA) revealed the most significant elevations (Figures 4F-4H)). As fibrosis aggravated, all serum levels of individual BAs tended to elevate, with a particularly significant elevation in conjugated BAs (Figure 4J).
BSH is responsible for converting conjugated BAs to unconjugated BAs in the intestine [18]. We found that BSH activity was significantly decreased in fibrosis groups (Figure 4K). This result was consistent with the changes in BA profile: a decrease in unconjugated BAs in faeces and an increase in conjugated BAs in serum.
Regulation of BAs by enterohepatic circulation during fibrosis
To further explore the mechanism of the changes in BA levels across fibrosis severities, we evaluated molecular changes in BA synthesis and regulation at the gene and protein levels. The mRNA expression levels of key enzymes in classical or alternative BA synthesis pathways, Cyp7a1 and cytochrome P450 family 7 subfamily B member 1 (Cyp7b1), were significantly increased in the moderate liver fibrosis stage and tended to increase in the advanced fibrosis stage. The mRNA levels of Cyp8b1 and cytochrome P450, family 27, subfamily a, polypeptide 1 (Cyp27a1) were significantly decreased in the fibrosis groups. Hepatic mRNA expression of Fxr and Shp was significantly downregulated in rats with moderate and advanced fibrosis. Consistent with the gene expression trend, higher CYP7A1 and lower CYP8B1, FXR, and SHP protein levels were observed in the liver fibrosis groups (Figure 5A). These results indicate that BA synthesis was increased in liver fibrosis.
Protein and mRNA expression associated with BA synthesis and BA transporters at weeks 8 and 12 in the liver and ileum (protein n=4, mRNA n=6-8). (A) Regulation of BA synthesis in the liver. (B-C) mRNA expression of BA transporters in the liver and ileum. (D) mRNA expression of Fxr, Shp and Fgf15 in the ileum. (E) Serum FGF15 protein level. Data are expressed as the mean ± SEM. Fxr /FXR, farnesoid X receptor; Shp/SHP, small heterodimer partner; Cyp7a1/CYP7A1, cytochrome P450 family 7 subfamily A member 1; Cyp8b1/CYP8B1, cytochrome P450 family 8 subfamily B member 1; Cyp27a1, cytochrome P450, family 27, subfamily a, polypeptide 1; Cyp7b1, cytochrome P450 family 7 subfamily B member 1; Bsep, bile-salt export pump; Mrp2, multidrug-resistance-associated protein 2; Ibabp, ileal BA binding protein; Ostα/β, Organic solute transporter subunit α/β; Fgf15/FGF15, fibroblast growth factor 15. *p<0.05, **p<0.01.
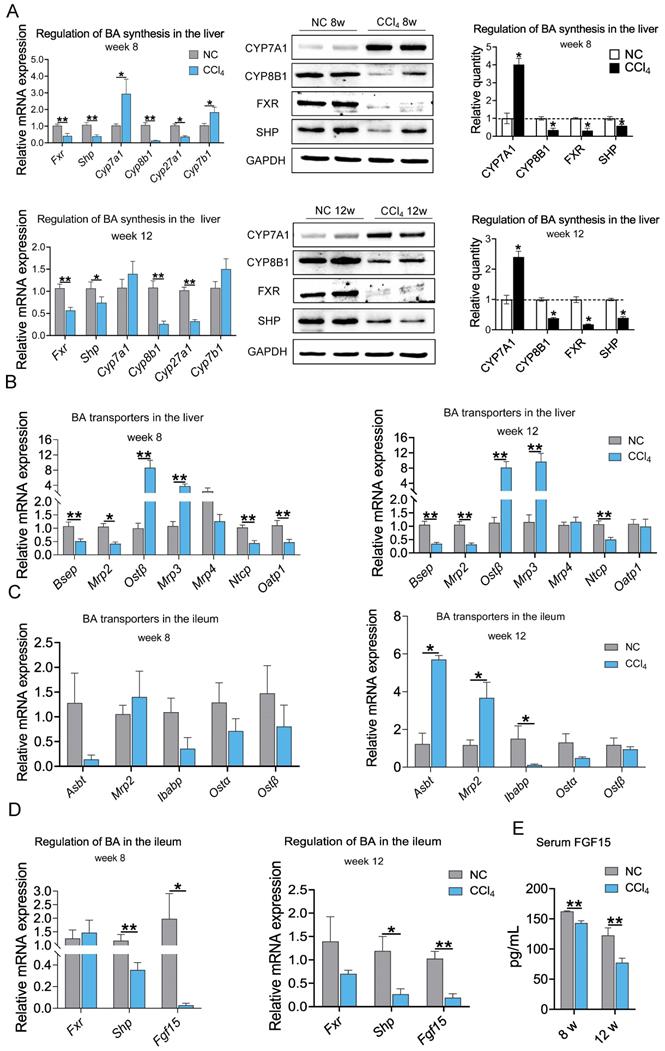
In addition to BA biosynthesis, a variety of hepatic and intestinal membrane transporters play critical roles in maintaining BA homeostasis. Hepatic mRNA expression levels of bile-salt export pump (Bsep), multidrug-resistance-associated protein 2 (Mrp2), and Na+-taurocholate cotransporting protein (Ntcp) were significantly decreased in both the moderate and advanced fibrosis groups. mRNA expression of organic anion-transporting polypeptide 1 (Oatp1) was decreased in moderate fibrosis but showed no difference in advanced fibrosis. Organic solute transporter subunit β (Ostβ) and Mrp3 mRNA levels were increased, while the mRNA level of Mrp4 was not altered in liver fibrosis conditions (Figure 5B). Down-regulation of genes responsible for the excretion of BAs into the bile canaliculi (Bsep and Mrp2) and the recycling of BAs to the liver (Ntcp and Oatp1) and up-regulation of genes responsible for the excretion of BAs into the circulation (Ostβ and Mrp3) resulted in a decrease in BAs excretion into the intestinal and an increase in BAs entering the circulation. At the moderate fibrosis stage, the mRNA levels of ileal BA transporters, including sodium-dependent BA transporter (Asbt), Mrp2, ileal BA binding protein (Ibabp), Ostα and Ostβ, were not significantly changed. Asbt and Mrp2 expression was increased, and Ibabp expression was decreased significantly in advanced fibrosis (Figure 5C). The ileal FXR-FGF15 pathway was suppressed with downregulation of Shp and Fgf15 expression (Figure 5D), which resulted in a significant reduction in circulating FGF15 protein levels in the fibrosis groups (Figure 5E). These results suggest that BA synthesis increased while BA excretion into the intestine decreased during hepatic fibrosis.
The gut barrier remained intact in advanced hepatic fibrosis
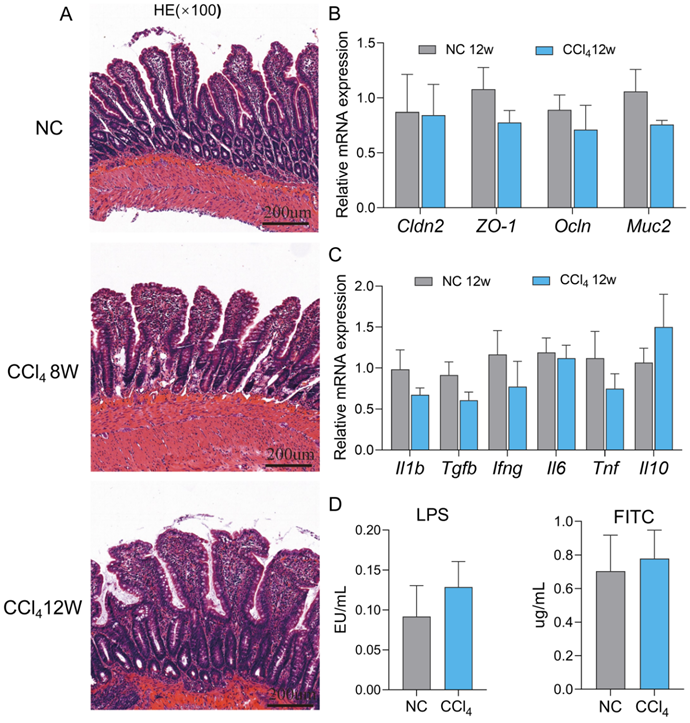
Dysfunction of the physical barrier contributes to the development of diseases in the liver [19], and we evaluated the integrity of the ileal epithelium in the advanced fibrosis group. No significant degeneration of epithelial cells, villus blunting or submucosal inflammation in terminal ileum histology were observed in the moderate and advanced fibrosis groups compared to the normal control group (Figure 6A). In accordance with the histology results, the expression of the typical tight junctions of claudin-2 (Cldn2), zonula occludens1 (ZO-1), and occludin (Ocln) and small intestinal mucus protein mucin 2 (Muc2) at the mRNA levels remained unchanged in the advanced fibrosis group (Figure 6B). Similarly, the mRNA levels of the inflammatory factors Il1b, Tgfb, interferon gamma (Ifng), interleukin 6 (Il6), Tnf and interleukin 10 (Il10) also did not differ significantly between the control group and advanced fibrosis group (Figure 6C). Although the plasma LPS and FITC levels in the advanced fibrosis group tended to increase, the difference was not statistically significant (Figure 6D). Gene expression of inflammatory factors and barrier proteins in the colon also showed the same trend as that in the ileum (Figure S4). These results implied that the gut barrier remained relatively intact in rats with advanced fibrosis induced by intraperitoneal injection of CCl4 in our experiment settings.
Assessment of ileal permeability at the advanced fibrosis stage. (A) Representative images of HE staining (original magnification × 100) of the ileum in the normal control, moderate and advanced fibrosis groups. (B-C) Gene expression of barrier proteins and inflammatory factors in the ileum (n=4-6). (D) Plasma FITC and LPS levels (n=6). Each value is expressed as the mean ± SEM. Cldn2, claudin-2; ZO-1, zonula occludens1; Ocln, occludin; Muc2, mucin 2; LPS, lipopolysaccharides; FITC, fluorescein isothiocyanate-dextra.
Discussion
This study investigated the dynamic changes in the gut microbiota, BAs and the gut epithelial barrier across liver fibrosis severities in CCl4-induced rats. We found that the gut microbiota profile changed as fibrosis progressed but was not necessarily positively correlated with the fibrosis degree. As fibrosis progressed, the level of unconjugated BAs in faeces gradually decreased, while the level of conjugated BAs in serum gradually increased. In our experiment settings, we found that the intestinal barrier remained relatively structurally and functionally intact even in advanced liver fibrosis.
Longitudinal study of the faecal microbiota demonstrated that gut microbiota dysbiosis was more severe in the prophase of fibrosis and advanced fibrosis stage than in the mild and moderate fibrosis stages in the CCl4-induced rat model. Opportunistic pathogens such as the taxa Desulfovibrio, Treponema and Eggerthellaceae were significantly overrepresented, while beneficial commensals such as the taxa Lactobacillus and Akkermansia were obviously underrepresented at the early and advanced stages of fibrosis. Desulfovibrio and Eggerthellaceae are thought to promote intestinal inflammation and are widely involved in the aetiology of gastrointestinal diseases [20, 21]. The taxon Enterobacteriaceae has long been considered as a potential diagnostic signature of dysbiosis [22] and is markedly increased in cirrhosis [23]. Healthy promotion of autochthonous Lactobacillus and Akkermansia proliferation plays essential roles in protecting against pathogens and maintaining gut barrier integrity [24-26]. These unfavourable shifts in the gut microbiota may contribute to the initiation and progression of liver fibrosis. In the mild fibrosis stage, there was a compensatory increase in the abundances of beneficial taxa, such as Akkermansia, despite the continuous increase in the abundance of pathogenic bacteria. Gut dysbiosis was alleviated visibly in the moderate fibrosis stage, when the differences in the microbiota between the control group and moderate fibrosis group mainly occurred at the species and genus levels. These results suggest that the disturbed microbiota is capable of reattaining homeostasis to some extent before advanced fibrosis; thus, gut dysbiosis may not parallel the degree of liver fibrosis.
Lactobacillus at different phylogenetic levels was reduced in the fibrosis groups compared to that in their corresponding normal control groups, among which the species Lactobacillus_murinus was the most significantly affected species, showing a declining trend in all the 4 fibrosis stages. Indeed, Lactobacillus has been widely used as probiotics with beneficial effects on liver injury and ameliorating liver fibrosis [27, 28]. Liu Y et al. has further demonstrated that Lactobacillus supplementation prevents liver fibrosis by inhibiting liver BA synthesis through intestinal FXR-FGF15 signalling. Meanwhile, Lactobacillus treatment increases faecal BA excretion through increasing BSH-containing gut bacteria and promotes urine BA excretion through an FXR-independent pathway [29]. Our results further support the view that Lactobacillus may be a distinctive gut biomarker for liver fibrosis and a new target to fight fibrosis.
Most of the differentially abundant gut microbiota constituents remained stable across the development of liver fibrosis; however, the minority of taxa changed in abundance with fibrosis progression. Streptococcus abundance showed an increasing trend at the moderate and advanced fibrosis stages, but its abundance was still significantly lower than that in the control group. Relative abundance of Streptococcus was negatively associated with serum ALT, AST and ALP levels, indicating that the decrease in Streptococcus abundance is an adverse change in liver injury. Clostridium_sensu_stricto_1, Escherichia_Shigella, Lachnospiraceae_UCG_010, Christensenellaceae_R_7_group, and Colidextribacter were more abundant in the advanced fibrosis stage than in the early and middle stages. Christensenellaceae_R_7_group was reported to be beneficial to the intestinal barrier [30, 31], while other gut bacteria have been reported to be involved in intestinal inflammation [32-34] and a variety of liver disorders, including cirrhosis [35, 36]. Moreover, we found a positive correlation of the relative abundances of Clostridium_sensu_stricto_1, Escherichia_Shigella, and Lachnospiraceae_UCG_010 with serum ALT, AST, and ALP levels and of the relative abundances of Christensenellaceae_R_7_group and Colidextribacter with ALT levels. The increase in the abundance of these microbiota may directly injure the liver and promote the occurrence of advanced fibrosis and even the subsequent progression of cirrhosis.
Previous studies have demonstrated that reductions in faecal total BA, secondary BA and unconjugated BA levels parallel the severity of liver fibrosis [37, 38]. Consistently, the concentrations of faecal total BAs, secondary BAs and unconjugated BAs decreased progressively across the normal control condition, moderate fibrosis and advanced fibrosis in our study. Firstly, the hepatic FXR-SHP and intestinal FXR-FGF15 pathways are the primary regulators of BA biosynthesis in enterohepatic circulation. Reduced unconjugated BAs in faeces of rats with advanced fibrosis are mainly LCA and DCA, which are agonists of intestinal FXR [39]. The elevated conjugated BAs in serum were dominated by TCA and T-α-MCA, of which T-α-MCA is an antagonist of FXR [40]. Decreases in LCA and DCA and an increase in T-α-MCA resulted in a significant downregulation of serum FGF15, which ultimately resulted in an increase in hepatic BA synthesis. Secondly, the reduced BSH activity led to the decrease in unconjugated BA levels in faeces and the increase conjugated BA levels in serum from another perspective. Because Firmicutes is rich in BSH [41] and genus Lactobacillus particularly possesses strong BSH activity [42], the reduction in Firmicutes abundance along with that of its affiliated families Lactobacillaceae and Ruminococcaceae, and genera Lactobacillus and Ruminococcus may account for the decrease in BSH activity. Therefore, adverse changes in the gut microbiota altered the BA profiles, which in turn inhibited FXR signalling pathway, ultimately resulting in BA accumulation. An excess of cytotoxic BAs in the liver can lead to liver fibrosis and cirrhosis.
Gut barrier is reported to be disrupted during liver fibrosis [43-46]. However, we did not observe significant gut barrier disruption in our study. Du Plessis J et al. had reported that the intestinal barrier could remain intact in patients with compensatory cirrhosis until decompensated cirrhosis occurred [47], suggesting that the severe liver fibrosis stage is more likely to be accompanied by intestinal barrier disruption. Although we did not detect significant intestinal barrier disruption from multiple perspectives in our study, we still observed a trend of increased intestinal permeability to LPS and FITC at the advanced liver fibrosis stage. Therefore, our results do not contradict previous studies, and the differences may lie in the degree of fibrosis.
Taken together, the main results of the present work are the characterization of the dynamics of the gut-liver axis in the progression of liver fibrosis. To the best of our knowledge, this study is the first attempt to elucidate temporal variation in the gut microbiota constituents and BA levels in the CCl4-induced fibrosis model, which can provide the basis for further mechanistic and interventional studies to prevent or reverse the liver fibrosis phenotype. However, the causal relationship of the gut microbiota, BAs and liver fibrosis is still obscure, and further investigation is needed to clarify the mechanisms involved.
Supplementary Material
Supplementary figures and tables.
Acknowledgements
This work was supported by the National Science and Technology Major Project of China (grant numbers 2017ZX10202203-008, 2017ZX10202203-007, 2018ZX10302206-003) and a pilot project of clinical cooperation between traditional Chinese and western medicine for significant and complicated diseases of National Administration of Traditional Chinese Medicine: hepatic fibrosis.
Authors Contributions
- Conception and design: Mingli Peng and Hongyan Xiang;
- Development of methodology: Hongyan Xiang and Mingli Peng;
- Acquisition of data (provided animals, provided facilities, experiment etc.): Hongyan;
- Xiang, Zongyi Liu, Huanyu Xiang, Dejuan Xiang, Shuang Xiao, Jing Xiao, and Mingli Peng;
- Analysis and interpretation of data (statistical analysis and biostatistics): Hongyan;
- Xiang and Mingli Peng;
- Writing, review, and revision of the manuscript: Hongyan Xiang, Zongyi Liu, Dejuan;
- Xiang, Shuang Xiao, and Mingli Peng;
- Administrative, technical, or material support: Wei Shen, Peng Hu, Hong Ren, and;
- Mingli Peng;
- Study supervision: Wei Shen, Peng Hu, Hong Ren, and Mingli Peng.
Competing Interests
The authors have declared that no competing interest exists.
References
1. Albillos A, de Gottardi A, Rescigno M. The gut-liver axis in liver disease: Pathophysiological basis for therapy. Journal of Hepatology. 2020;72:558-77
2. Tilg H, Cani PD, Mayer EA. Gut microbiome and liver diseases. Gut. 2016;65:2035-44
3. Arab JP, Martin-Mateos RM, Shah VH. Gut-liver axis, cirrhosis and portal hypertension: the chicken and the egg. Hepatol Int. 2018;12:24-33
4. Tripathi A, Debelius J, Brenner DA, Karin M, Loomba R, Schnabl B. et al. The gut-liver axis and the intersection with the microbiome. Nature Reviews Gastroenterology & Hepatology. 2018;15:397-411
5. Seki E, Schnabl B. Role of innate immunity and the microbiota in liver fibrosis: crosstalk between the liver and gut. The Journal of Physiology. 2012;590:447-58
6. Bajaj JS. Alcohol, liver disease and the gut microbiota. Nat Rev Gastroenterol Hepatol. 2019;16:235-46
7. Mouries J, Brescia P, Silvestri A, Spadoni I, Sorribas M, Wiest R. et al. Microbiota-driven gut vascular barrier disruption is a prerequisite for non-alcoholic steatohepatitis development. Journal of Hepatology. 2019;71:1216-28
8. Ridlon JM, Alves JM, Hylemon PB, Bajaj JS. Cirrhosis, bile acids and gut microbiota: unraveling a complex relationship. Gut Microbes. 2013;4:382-7
9. Ikegami T, Honda A. Reciprocal interactions between bile acids and gut microbiota in human liver diseases. Hepatology Research. 2018;48:15-27
10. Wiest R, Albillos A, Trauner M, Bajaj JS, Jalan R. Targeting the gut-liver axis in liver disease. Journal of Hepatology. 2017;67:1084-103
11. Tranah TH, Edwards LA, Schnabl B, Shawcross DL. Targeting the gut-liver-immune axis to treat cirrhosis. Gut. 2021;70:982-94
12. Yanguas SC, Cogliati B, Willebrords J, Maes M, Colle I, van den Bossche B. et al. Experimental models of liver fibrosis. Arch Toxicol. 2016;90:1025-48
13. Constandinou C, Henderson N, Iredale JP. Modeling liver fibrosis in rodents. Methods Mol Med. 2005;117:237-50
14. Ishak K, Baptista A, Bianchi L, Callea F, De Groote J, Gudat F. et al. Histological grading and staging of chronic hepatitis. J Hepatol. 1995;22:696-9
15. Chiu CJ, McArdle AH, Brown R, Scott HJ, Gurd FN. Intestinal mucosal lesion in low-flow states. I. A morphological, hemodynamic, and metabolic reappraisal. Arch Surg. 1970;101:478-83
16. Tanaka H, Hashiba H, Kok J, Mierau I. Bile salt hydrolase of Bifidobacterium longum-biochemical and genetic characterization. Appl Environ Microbiol. 2000;66:2502-12
17. Hu S, Zhao ZK, Liu R, Wang HB, Gu CY, Luo HM. et al. Electroacupuncture activates enteric glial cells and protects the gut barrier in hemorrhaged rats. World J Gastroenterol. 2015;21:1468-78
18. Khodakivskyi PV, Lauber CL, Yevtodiyenko A, Bazhin AA, Bruce S, Ringel-Kulka T. et al. Noninvasive imaging and quantification of bile salt hydrolase activity: From bacteria to humans. Sci Adv. 2021;7:eaaz9857
19. Chopyk DM, Grakoui A. Contribution of the Intestinal Microbiome and Gut Barrier to Hepatic Disorders. Gastroenterology. 2020;159:849-63
20. Christophersen CT, Morrison M, Conlon MA. Overestimation of the Abundance of Sulfate-Reducing Bacteria in Human Feces by Quantitative PCR Targeting the Desulfovibrio 16S rRNA Gene. Applied and Environmental Microbiology. 2011;77:3544-6
21. Aparicio M, Alba C, Rodríguez JM, Fernández L. Microbiological and Immunological Markers in Milk and Infant Feces for Common Gastrointestinal Disorders: A Pilot Study. Nutrients. 2020;12:634
22. Shin NR, Whon TW, Bae JW. Proteobacteria: microbial signature of dysbiosis in gut microbiota. Trends Biotechnol. 2015;33:496-503
23. Chen Y, Yang F, Lu H, Wang B, Chen Y, Lei D. et al. Characterization of fecal microbial communities in patients with liver cirrhosis. Hepatology. 2011;54:562-72
24. Williams NT. Probiotics. Am J Health Syst Pharm. 2010;67:449-58
25. Fine RL, Mubiru DL, Kriegel MA. Friend or foe? Lactobacillus in the context of autoimmune disease. Adv Immunol. 2020;146:29-56
26. Wang L, Tang L, Feng Y, Zhao S, Han M, Zhang C. et al. A purified membrane protein from Akkermansia muciniphila or the pasteurised bacterium blunts colitis associated tumourigenesis by modulation of CD8+ T cells in mice. Gut. 2020;69:1988-97
27. Santos AA, Afonso MB, Ramiro RS, Pires D, Pimentel M, Castro RE. et al. Host miRNA-21 promotes liver dysfunction by targeting small intestinal Lactobacillus in mice. Gut Microbes. 2020;12:1840766
28. Hammes TO, Leke R, Escobar TDC, Fracasso LB, Meyer FS, Andrades M. et al. Lactobacillus rhamnosusGG reduces hepatic fibrosis in a model of chronic liver disease in rats. Nutr Hosp. 2017;34:702-9
29. Liu Y, Chen K, Li F, Gu Z, Liu Q, He L. et al. Probiotic Lactobacillus rhamnosus GG Prevents Liver Fibrosis Through Inhibiting Hepatic Bile Acid Synthesis and Enhancing Bile Acid Excretion in Mice. Hepatology. 2020;71:2050-66
30. Hu Y, Chen F, Ye H, Lu B. Integrative analysis of the gut microbiome and metabolome in a rat model with stress induced irritable bowel syndrome. Sci Rep. 2021;11:17596
31. Xie J, Yu R, Qi J, Zhang G, Peng X, Luo J. Pectin and inulin stimulated the mucus formation at a similar level: An omics-based comparative analysis. J Food Sci. 2020;85:1939-47
32. Zhou Y, Shan G, Sodergren E, Weinstock G, Walker WA, Gregory KE. Longitudinal analysis of the premature infant intestinal microbiome prior to necrotizing enterocolitis: a case-control study. PLoS One. 2015;10:e0118632
33. Fu CY, Li LQ, Yang T, She X, Ai Q, Wang ZL. Autoinducer-2 May Be a New Biomarker for Monitoring Neonatal Necrotizing Enterocolitis. Front Cell Infect Microbiol. 2020;10:140
34. Coffey MJ, Nielsen S, Wemheuer B, Kaakoush NO, Garg M, Needham B. et al. Gut Microbiota in Children With Cystic Fibrosis: A Taxonomic and Functional Dysbiosis. Sci Rep. 2019;9:18593
35. Shen F, Zheng RD, Sun XQ, Ding WJ, Wang XY, Fan JG. Gut microbiota dysbiosis in patients with non-alcoholic fatty liver disease. Hepatobiliary Pancreat Dis Int. 2017;16:375-81
36. Milosevic I, Vujovic A, Barac A, Djelic M, Korac M, Radovanovic Spurnic A. et al. Gut-liver axis, gut microbiota, and its modulation in the management of liver diseases: a review of the literature. International Journal of Molecular Sciences. 2019;20:395
37. Wang X, Chen L, Wang H, Cai W, Xie Q. Modulation of bile acid profile by gut microbiota in chronic hepatitis B. J Cell Mol Med. 2020;24:2573-81
38. Kakiyama G, Pandak WM, Gillevet PM, Hylemon PB, Heuman DM, Daita K. et al. Modulation of the fecal bile acid profile by gut microbiota in cirrhosis. J Hepatol. 2013;58:949-55
39. Jia W, Xie G, Jia W. Bile acid-microbiota crosstalk in gastrointestinal inflammation and carcinogenesis. Nat Rev Gastroenterol Hepatol. 2018;15:111-28
40. Wahlstrom A, Sayin SI, Marschall HU, Backhed F. Intestinal Crosstalk between Bile Acids and Microbiota and Its Impact on Host Metabolism. Cell Metab. 2016;24:41-50
41. Winston JA, Theriot CM. Diversification of host bile acids by members of the gut microbiota. Gut Microbes. 2020;11:158-71
42. Tannock GW, Dashkevicz MP, Feighner SD. Lactobacilli and bile salt hydrolase in the murine intestinal tract. Appl Environ Microbiol. 1989;55:1848-51
43. Xue X, Wu J, Ding M, Gao F, Zhou F, Xu B. et al. Si-Wu-Tang ameliorates fibrotic liver injury via modulating intestinal microbiota and bile acid homeostasis. Chin Med. 2021;16:112
44. Zhang W, Gan D, Jian J, Huang C, Luo F, Wan S. et al. Protective Effect of Ursolic Acid on the Intestinal Mucosal Barrier in a Rat Model of Liver Fibrosis. Front Physiol. 2019;10:956
45. Zhang Z, Zhang Q, Li F, Xin Y, Duan Z. Contributions of HO-1-Dependent MAPK to Regulating Intestinal Barrier Disruption. Biomol Ther (Seoul). 2021;29:175-83
46. Wang C, Ma C, Fu K, Gong LH, Zhang YF, Zhou HL. et al. Phillygenin Attenuates Carbon Tetrachloride-Induced Liver Fibrosis via Modulating Inflammation and Gut Microbiota. Front Pharmacol. 2021;12:756924
47. Du Plessis J, Vanheel H, Janssen CE, Roos L, Slavik T, Stivaktas PI. et al. Activated intestinal macrophages in patients with cirrhosis release NO and IL-6 that may disrupt intestinal barrier function. J Hepatol. 2013;58:1125-32
Author contact
![]() Corresponding author: Mingli Peng, Key Laboratory of Molecular Biology for Infectious Diseases (Ministry of Education), Institute for Viral Hepatitis, Department of Infectious Diseases, The Second Affiliated Hospital, Chongqing Medical University, Chongqing 400010, China. E-mail: Peng_minglicqmu.edu.cn.
Corresponding author: Mingli Peng, Key Laboratory of Molecular Biology for Infectious Diseases (Ministry of Education), Institute for Viral Hepatitis, Department of Infectious Diseases, The Second Affiliated Hospital, Chongqing Medical University, Chongqing 400010, China. E-mail: Peng_minglicqmu.edu.cn.