Impact Factor ISSN: 1449-2288
- Issue 12; 2026
- Issue 11; 2026
- Issue 10; 2026
- Issue 9; 2026
- Issue 8; 2026
- Volume 22; 2026
- Past Issues
- Advance Articles
- Editorial Board
- Cover Images
- Index & Coverage
- Cover Suggestion
- Special Issues
Introduction
Materials and methods
Results
Discussion
Conclusions
Abbreviations
Supplementary Material
Acknowledgements
References

 Global reach, higher impact
Int J Biol Sci 2024; 20(10):3972-3985. doi:10.7150/ijbs.93349 This issue Cite
Research Paper
KMT2D mutations promoted tumor progression in diffuse large B-cell lymphoma through altering tumor-induced regulatory T cell trafficking via FBXW7-NOTCH-MYC/TGF-β1 axis
Qing-Xiao Liu1,2†, Yue Zhu1†, Hong-Mei Yi2†, Yi-Ge Shen1†, Li Wang1, Shu Cheng1, Peng-Peng Xu1, Hai-Min Xu2, Lu-Ting Zhou2, Yao-Hui Huang1, Chuan-Xin Huang3, Di Fu1, Meng-Meng Ji1 ![]() , Chao-Fu Wang2
, Chao-Fu Wang2 ![]() , Wei-Li Zhao1,4
, Wei-Li Zhao1,4 ![]()
1. Shanghai Institute of Hematology, State Key Laboratory of Medical Genomics, National Research Center for Translational Medicine at Shanghai, Ruijin Hospital, Shanghai Jiao Tong University School of Medicine, Shanghai 200025, China.
2. Department of Pathology, Ruijin Hospital, Shanghai Jiao Tong University School of Medicine, Shanghai 200025, China.
3. Department of Immunobiology and Microbiology, Shanghai Institute of Immunology, Shanghai Jiao Tong University School of Medicine, Shanghai 200025, China.
4. Pôle de Recherches Sino-Français en Science du Vivant et Génomique, Laboratory of Molecular Pathology, Shanghai 200025, China.
†Qing-Xiao Liu, Yue Zhu, Hong-Mei Yi and Yi-Ge Shen contributed equally to this work.
Received 2023-12-9; Accepted 2024-7-6; Published 2024-7-15
Abstract

Histone methyltransferase KMT2D is one of the most frequently mutated genes in diffuse large B-cell lymphoma (DLBCL) and has been identified as an important pathogenic factor and prognostic marker. However, the biological relevance of KMT2D mutations on tumor microenvironment remains to be determined. KMT2D mutations were assessed by whole-genome/exome sequencing (WGS/WES) in 334 patients and by targeted sequencing in 427 patients with newly diagnosed DLBCL. Among all 761 DLBCL patients, somatic mutations in KMT2D were observed in 143 (18.79%) patients and significantly associated with advanced Ann Arbor stage and MYC expression ≥ 40%, as well as inferior progression-free survival and overall survival. In B-lymphoma cells, the mutation or knockdown of KMT2D inhibited methylation of lysine 4 on histone H3 (H3K4), downregulated FBXW7 expression, activated NOTCH signaling pathway and downstream MYC/TGF-β1, resulting in alterations of tumor-induced regulatory T cell trafficking. In B-lymphoma murine models established with subcutaneous injection of SU-DHL-4 cells, xenografted tumors bearing KMT2D mutation presented lower H3K4 methylation, higher regulatory T cell recruitment, thereby provoking rapid tumor growth compared with wild-type KMT2D via FBXW7-NOTCH-MYC/TGF-β1 axis.
Keywords: diffuse large B-cell lymphoma, KMT2D, regulatory T cells, FBXW7, NOTCH, MYC, TGF-β1
Introduction
Diffuse large B-cell lymphoma (DLBCL) is a molecularly heterogeneous entity of non-Hodgkin lymphoma with variations in genetic alterations, leading to considerable differences in clinical course and response to immunochemotherapy [1]. Two-thirds of DLBCL patients are curable with standard R-CHOP (rituximab plus cyclophosphamide, doxorubicin, vincristine, and prednisone), while the remaining patients are refractory or relapsed from immunochemotherapy, urging targeted therapeutic approaches to be further investigated [2].
With the development of next-generation sequencing technologies, remarkable progress has been made to illustrate the oncogenic mechanisms in DLBCL progression [3]. Epigenetic gene alterations are major pathogenic factors of DLBCL [1]. Among these genes, the most frequently mutated gene KMT2D (also known as MLL2/MLL4) encodes a highly conserved protein that catalyzes the methylation of lysine 4 on histone H3 (H3K4) [4]. The enzymatic function of KMT2D depends on a cluster of C-terminal conserved domains, including a PHD domain, two FY-rich motifs (FYRC and FYRN) and a catalytic SET domain [5]. Most KMT2D mutations are nonsense or frameshift mutations, which are likely to confer loss of KMT2D function and diminished global H3K4 methylation [1]. Lack of functional KMT2D promotes lymphomagenesis in murine models and inactivation of KMT2D activates oncogenic signaling pathways such as NOTCH, RAS, and ERK [4, 6, 7].
Tumor microenvironment facilitates malignant cell escape from immune cells and subsequently provokes tumor progression in DLBCL [8, 9]. Multiple mechanisms lead to immunosuppressive conditions, including impaired functions of effector T and natural killer cells, as well as induction of regulatory T (Treg) cells, myeloid-derived suppressor cells, and tumor-associated macrophages [10, 11]. Particularly, Treg cells play an essential role in immune homeostasis [12, 13], dividing by natural Treg cells developed in the thymus and inducing Treg cells differentiation from naïve CD4+ T cells at the periphery [14, 15]. Tumor induced Treg cell trafficking into microenvironment ensures efficient immune response. However, the potential effect of KMT2D mutations on tumor microenvironment remains to be determined in DLBCL. Here we performed the genomic and transcription analysis in a large cohort of DLBCL patients and further revealed the effect of KMT2D mutations on lymphoma microenvironment. Meanwhile, underlying molecular mechanisms of KMT2D mutations on tumor-induced Treg cell trafficking were investigated both in vitro and in vivo.
Materials and methods
Patients
In all, 761 patients with newly diagnosed DLBCL were included in this study. Two experienced pathologists (YHM and WCF) established histological diagnosis according to the World Health Organization classification. All patients were treated with R-CHOP-based immunochemotherapy. The treatment response was evaluated according to the International Workshop Criteria. The Hospital Review Board approved the study with informed consent obtained following the Declaration of Helsinki.
Cell lines and reagents
B-lymphoma cell line SU-DHL-4 (obtained from American Type Culture Collection, Manassas, VA, USA) and U-2932 (obtained from Deutsche Sammlung von Mikroorganismen und Zellkulturen, Braunschweig, Lower Saxony Land, Germany) were grown in Roswell Park Memorial Institute (RPMI)-1640 medium, supplemented with 10% heat-inactivated fetal bovine serum and 1% penicillin/streptomycin (15140122, Gibco, Carlsbad, CA, USA) in a humidified atmosphere containing 95% air-5% CO2 at 37°C. γ-secretase inhibitor (inhibitor of the NOTCH signaling pathway, GSI-I, S1575) and MYC inhibitor (S7153) were purchased from Selleck (Houston, TX, USA).
DNA sequencing
Tumor samples of 761 patients were analyzed for gene mutations using whole genome sequencing/whole exome sequencing (WGS/WES) or targeted sequencing. WGS (n=109) was performed on frozen tumor tissue. WES (n=225) was performed on frozen tumor tissue and formalin-fixed paraffin-embedded tumor tissue quality-controlled by agarose gel electrophoresis. Targeted sequencing (n=427) was performed on frozen tumor tissue. Mutation frequencies per gene and mutation signatures showed no significant difference in the results for WGS, WES and targeted sequencing.
RNA sequencing
Total RNA was extracted from tumor samples of 402 DLBCL patients. RNA was purified using Ribo-Zero rRNA Removal Kits (Illumina). RNA concentration and integrity were verified using NanDrop and Agilen 2100 Bioanalyzer, respectively. RNAs libraries were constructed with TruSeq RNA Library Preparation Kit (Illumina). The concentration and the quality of libraries were controlled by Qubit and BioAnalyzer 2100 system. The paired-end sequencing was performed on Illumina HiSeq Sequencer. After 3' adaptor-trimming and removing low-quality reads, high quality trimmed reads were aligned to the reference genome (UCSC hg19). Pathway enrichment analysis was performed based on the differentially expressed mRNAs through the user tutorials of Cytoscape referring to Kyoto Encyclopedia of Genes and Genomes (KEGG) databases. Gene Set Enrichment Analysis (GSEA) was performed using the BROAD Institute GSEA software.
Cell transfection
For Vector, KMT2Dwt, KMT2DC5092R, KMT2DG5182fs, KMT2DW5395X, KMT2DR5432Q, KMT2Dkd and Scramble transfection, purified plasmids pGV358/GFP/Puro (Vector), pGV358/GFP/Puro-KMT2D (NM-003482, residues 4839-5537, containing SET domain, wild-type, KMT2DC5092R, KMT2DG5182fs, KMT2DW5395X and KMT2DR5432Q), pGV248/GFP/Puro (Scramble), pGV248/GFP/Puro-sh KMT2D were transfected into packages HEK-293T cells using lipofectamine 2000 (11668019, Invitrogen, Carlsbad, CA, USA) according to the manufacturer's protocol. The supernatant fraction of HEK-293T cell cultures was then condensed to a viral concentration of approximately 2 × 10⁸ transducing units/ml. The lentiviral particles were incubated with SU-DHL-4 or U-2932 cells for 72h with addition of polybrene (8μg/ml). The stably transduced clones were selected by green fluorescence protein using flow cytometry or puromycin treatment for two weeks. The shRNA sequences of KMT2D were listed in Table. S1.
Western blot
Cells were lysed in 200μl lysis buffer (0.5M Tris-HCl, pH 6.8, 2mM EDTA, 10% glycerol, 2% SDS and 5% β-mercaptoethanol). Protein lysates (20μg) were electrophoresed on 10% SDS polyacrylamide gels and transferred to nitrocellulose membranes. Membranes were blocked with 5% non-fat dried milk and incubated overnight at 4°C with appropriate antibodies, followed by a horseradish peroxidase-conjugated secondary antibody. The immunocomplexes were visualized using a chemiluminescence phototope-horseradish peroxidase Kit (Cell Signaling Technologies, Danvers, MA, USA). Primary antibodies included H3K4me3 (ab8580, Abcam, Cambridge, United Kingdom), FBXW7 (28424-1-AP, Proteintech), NICD (ab8925, Abcam), MYC (ab32072, Abcam), TGF-β1 (ab215715, Abcam). Histone 3 (17168, Proteintech) and β-Actin (ab8226, Abcam) were used to ensure equivalent loading of protein. Horseradish peroxidase-conjugated secondary antibodies against goat anti-mouse-IgG and goat anti-rabbit-IgG were from Cell Signaling Technologies.
Immunohistochemistry and immunofluorescence assay
Immunohistochemistry was performed on 5μm-paraffin sections with an indirect immunoperoxidase method using antibodies against MYC (1:500, ab32072, Abcam), H3K4me3 (1:1000, ab8580, Abcam), intracellular portions of NOTCH1 (NICD, 1:200, ab8925, Abcam) and Foxp3 (1:500, ab20034, Abcam). H3K4me3 and NICD expression levels were scored based on the percentage of positive cells. For Foxp3, immunoreactivity in > 0% of cells was defined as positive [16]. Immunofluorescence assay of H3K4me3 was performed on acetone-fixed cells, using rabbit anti-H3K4me3 as primary antibodies and Alexa Fluor 594-conjugated goat polyclonal anti-rabbit IgG-H&L (ab150080, Abcam) as the secondary antibody. Nuclei were counterstained with DAPI.
Quantitative real-time PCR (RT-PCR)
Total mRNA was extracted using Trizol reagent and reverse transcribed using a PrimeScript RT Reagent Kit with gDNA Eraser for quantitative RT-PCR (RR047A, TaKaRa, Japan). Quantitative RT-PCR was performed by SYBR Premix Ex TaqTM II (RR820A, TaKaRa) and ABI ViiA7 (Applied Biosystems, Bedford, MA, USA) with primers against TGF-β1 and FBXW7. Relative quantification was calculated using the 2-∆∆CT methods. The primers were listed in Table. S2.
Chromatin immunoprecipitation (ChIP)
Nuclear extracts were prepared from 2 × 10⁷ cells per sample. Rabbit anti-human H3K4me3 antibody (ab8580, Abcam) was used for immunoprecipitation, and normal IgG (3900, Cell Signaling Technologies) was referred as negative control. ChIP primers of FBXW7 genes were used as previously reported [17], which were designed to detect promoter fragments near transcription start sites. ChIP-enriched chromatin was used for real-time PCR with SYBR Premix Ex TaqTM II, normalizing to input.
B-lymphoma cell co-culture
Co-culture of SU-DHL-4 or U-2932 cells with PBMCs was conducted by a 0.4μm pore polycarbonate membrane and 6.5mm inserts (Corning, Sunnyvale, CA, USA). SU-DHL-4 and U-2932 cells transfected with Vector, KMT2Dwt, KMT2DC5092R, KMT2DG5182fs, KMT2DW5395X, KMT2DR5432Q, Scramble, and KMT2Dkd were cultured at 2 × 10⁵ cells/ml in the upper chamber, while PBMCs at 1 × 10⁶ cells/ml (1:5 ratio) in the lower chamber. Cell viability was assessed by CCK8. After 72h co-culture, we measured its absorbance at 450nm by spectrophotometry. All cells were maintained in RPMI-1640 medium supplemented with 10% heat-inactivated fetal bovine serum and 1% penicillin/streptomycin.
Single-cell RNA sequencing
Tumor samples of six DLBCL patients were collected for single-cell RNA sequencing analysis. Tumor samples were placed in separate containers containing Tissue Storage Solution (Miltenyi Biotec) and transported in regular ice to the laboratory immediately. Tumor samples were separated into small pieces mechanically and dissociated into single-cells after enzymatic digestion at 37 ℃. After filtering with a 40-µm strainer and washing once with PBS, cells were cryopreserved in liquid nitrogen before the scRNA-seq experiment. For the scRNA-seq experiment, cells were thawed and washed immediately, and further processed with Dead cell removal kit (Miltenyi Biotec). The preparation of the single-cell suspensions, synthesis of complementary DNA and gene expression libraries were performed according to the manufacturer's instructions using Chromium single cell 3' Kit v2 (10x Genomics) in 2 patients, and Chromium single cell 5' Kit v2 (10x Genomics) in 4 patients. The 3' gene expression libraries were sequenced on Novaseq 6000 (Illumina) and 5' gene expression libraries on MGI-2000 sequencer.
Reading the raw data by the Read10X function in the seurat package (4.0.2) [18]. The data filtering criteria were: minimum number of cells was 3, minimum number of genes tested was 300, and the percentage of mitochondrial gene expression was less than 5%. The data were first normalized by LogNormalize method, and the top 1500 genes with large intercellular variation coefficients were extracted by FindVariableFeatures function. The normalized count matrix is linearly transformed ("scaling") by the ScaleData function to normalize the data: 1) shifting the expression of each gene so that the average expression between cells is 0; 2) scaling the expression of each gene so that the difference between cells to 1. The normalized expression matrix was subjected to PCA downscaling using the RunPCA function.
The distribution of p-values for each PC was calculated using the JackStraw function. Significant PCs would have lower p-values, and the appropriate PC values were filtered. The above descended data were clustered by t-distributed stochastic neighbor embedding (tSNE) algorithm, and the differential gene analysis was performed by FindAllMarkers function for each subpopulation to filter Marker genes. The subpopulations were annotated according to marker genes by SingleR package (1.4.1) [19], in which the annotation comparison data set was HumanPrimaryCellAtlasData, and the similarities and differences of cell numbers between cancer and normal groups were counted after subpopulation annotation. The expression matrices of T cells from patients with or without KMT2D mutations were extracted separately and merged by merge function. The differential expression genes of T cells were calculated by FindAllMarkers function. The screening criteria for differentially expressed genes were P value < 0.05.
Flow cytometry
Antibodies used for cell labeling of Treg cells were as followed: BV421 anti-CD4 (562424, BD Biosciences), BV786 anti-CD25 (563701, BD Biosciences), PE anti-Foxp3 (560046, BD Biosciences). Flow cytometry data were collected by a FACS Calibur cytometer (BD Biosciences) and analyzed by FlowJo software.
Luciferase report assay
Total cDNA from HEK-293T cells was used to amplify the promoter (-1914 to +79 bp) of TGF-β1, forward primer: 5′-GCCCGCAACATATAGATGAGGACGGTGGCCCAGCCC-3′; reverse primer: 5′-CTATATGTTGCGGGCTCCGAGGGGGGTC-3′. After digestion with BamHI and EcoRI, PCR products were ligated into the GM-4629: PGL3-basic vector and confirmed by DNA sequencing. HEK-293T cells were seeded in 24-well plates and co-transfected with 250ng of MYC, 250ng promoter (-1914 to +79 bp) luciferase reporter construct and 50μl luciferase reporter. Cells were collected 24h after transfection, using the Cell Lysis Buffer (100μl per well) provided as part of the Dual-Luciferase Reporter Assay System Kit (Promega, Madison, WI, USA). Firefly and Renilla luciferase activities were examined by the Dual-Luciferase Reporter Assay System and detected by a Centro XS3 LB960 Luminometer (Berthold, Bad Wildbad, Germany).
Mice
NOD-PrkdcscidIl2rgem1/Smoc (M-NSG) immune deficient female mice were used in this study, which purchased from Shanghai Model Organisms, ages 6 to 8 weeks at experiment initiation. M-NSG mice were injected subcutaneously with KMT2Dwt and KMT2DR5432Q SU-DHL-4 cells (1 × 10⁷ cells) and human PBMC intravenously (5 × 10⁶ cells). Tumor volumes were measured twice a week and human CD45 (hCD45) were measured after 3 weeks to confirm that humanized PBMCs were established. TGF-β inhibitor (purchased from Selleck, SB431542) was injected intraperitoneally in KMT2DR5432Q mice at a dose of 10mg/kg per week, 7 days after tumor cell injection. Tumor volumes were calculated at 0.5 × a (length) × b (width)2. Animals were used according to the protocols approved by the Shanghai Rui Jin Hospital Animal Care and Use Committee.
Statistical analysis
The baseline characteristics of patients were measured by χ2 test. Progression-free survival (PFS) was calculated from the date when treatment began to the date when the disease progression was recognized or the date of last follow-up. Overall survival (OS) was measured from the date of diagnosis to the date of death or last follow-up. Univariate hazard estimates were generated with unadjusted Cox proportional hazards models. Survival functions were estimated using the Kaplan-Meier method and compared by the log-rank test. Experimental results were calculated as the mean ± standard deviation from three separate experiments. The student t-test was applied to compare two normally distributed groups and Mann-Whitney U test to compare which did not conform to normal distribution. All statistical analysis was carried out using Statistical Package for the Social Sciences (SPSS, 26.0) software or GraphPad Prism 8 software. Statistical significance was defined as p < 0.05.
Results
KMT2D mutations contributed to tumor progression and aberrant tumor microenvironment in DLBCL
A total of 761 patients with newly diagnosed DLBCL were analyzed by WGS/WES and targeted sequencing, including 618 patients with wild-type KMT2D (KMT2Dwt) and 143 patients with KMT2D mutations (KMT2Dmut). The clinical characteristics of these patients were summarized in Table 1. KMT2Dmut patients were significantly associated with advanced Ann Arbor stage (III-IV, p=0.003) and MYC expression ≥ 40% (p=0.015), as compared to KMT2Dwt patients. The median follow-up time was 38.4 months (range: 0.3-118.1 months). Inferior progression-free survival (PFS) and overall survival (OS) were presented in KMT2Dmut patients (p=0.018, Figure 1A and p=0.010, Figure 1B). Moreover, inferior OS was observed in KMT2Dmut patients with age > 60 years, elevated serum lactate dehydrogenase (LDH), International Prognostic Index (IPI) 3-5, non-germinal center B-cell-like (GCB) subtype, extranodal involvement ≤ 1 and MYC expression ≥ 40% (p=0.008, p=0.019, p=0.045, p=0.002, p=0.013 and p=0.004, respectively, Figure 1C). Inferior PFS was observed in KMT2Dmut patients with age > 60 years, ECOG score > 1, IPI 3-5, non-GCB subtype, extranodal involvement ≤ 1, MYC expression ≥ 40% and BCL2 expression < 50% (p=0.012, p=0.008, p=0.028, p=0.012, p=0.030, p=0.033 and p=0.040, respectively, Supplementary Figure 1). KMT2Dmut patients presented higher incidence of MYC expression ≥ 40%, as compared to KMT2Dwt patients (p=0.015, Figure 1D).
Clinical characteristics of the patients with DLBCL (n=761)
| Characteristics | KMT2Dwt (n=618) | KMT2Dmut (n=143) | p value | |
|---|---|---|---|---|
| Gender | ||||
| Male | 378 (45.0%) | 64 (44.8%) | 0.961 | |
| Female | 340 (55.0%) | 79 (55.2%) | ||
| Age | ||||
| ≤ 60 | 349 (56.5%) | 92 (64.3%) | 0.211 | |
| > 60 | 268 (43.4%) | 51 (35.7%) | ||
| ECOG score | ||||
| ≤ 1 | 565 (91.4%) | 123 (86.6%) | 0.078 | |
| >1 | 53 (8.6%) | 19 (13.4%) | ||
| Ann Arbor stage | ||||
| I-II | 349 (56.5%) | 62 (43.4%) | 0.003 | |
| III-IV | 269 (43.5%) | 80 (55.9%) | ||
| Serum LDH | ||||
| Normal | 328 (53.2%) | 71 (49.7%) | 0.449 | |
| Elevated | 289 (46.8%) | 72 (50.3%) | ||
| IPI | ||||
| 0-2 | 437 (70.7%) | 92 (64.3%) | 0.136 | |
| 3-5 | 181 (29.3%) | 51 (35.7%) | ||
| Cell of origin (Hans) | ||||
| GCB | 241 (39.0%) | 56 (39.2%) | 0.997 | |
| Non-GCB | 373 (60.4%) | 86 (60.1%) | ||
| Extranodal involvement | 0.871 | |||
| ≤ 1 | 447 (72.6%) | 104 (73.2%) | ||
| > 1 | 169 (27.4%) | 38 (26.8%) | ||
| MYC Expression | ||||
| < 40% | 347 (67.0%) | 71 (55.5%) | 0.015 | |
| ≥ 40% | 171 (33.0%) | 57 (44.5%) | ||
| BCL2 Expression | ||||
| < 50% | 233 (42.2%) | 48 (36.1%) | 0.198 | |
| ≥ 50% | 319 (57.8%) | 85 (63.9%) | ||
KMT2D mutations contributed to tumor progression and aberrant tumor microenvironment in diffuse large B-cell lymphoma (DLBCL). (A). PFS (progression free survival) curves of KMT2Dwt and KMT2Dmut DLBCL patients. (B). OS (overall survival) curves of KMT2Dwt and KMT2Dmut DLBCL patients. (C). Forest plot of univariate analysis on overall survival (OS) of selected subgroups. (D). Immunohistochemistry study of MYC in tumor samples of DLBCL patients with or without KMT2D mutations. (E). TIP analysis showing association of Treg cell gene signatures with KMT2D mutations in DLBCL patients.
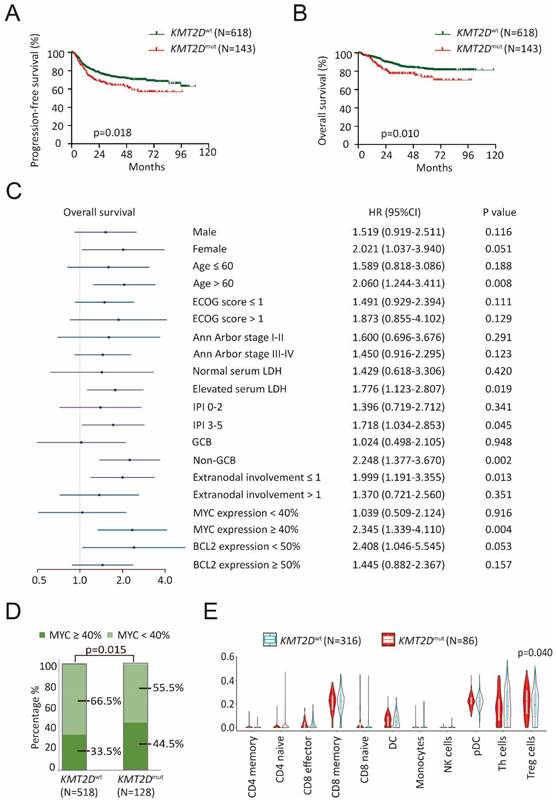
To explore the potential role of KMT2D mutations on tumor microenvironment, RNA sequencing was performed on 402 patients, including 86 patients with KMT2D mutations and 316 patients with wild-type KMT2D. Within several innate and adaptive immune cell subsets, Treg cell infiltration was significantly associated with KMT2D mutations (p=0.040, Figure 1E), as revealed by tracking tumor immunophenotype (TIP) analysis [20]. Meanwhile, gene sets that present immunologic cells were employed in GSEA (Molecular signatures database C7: immunologic signature gene sets). Indeed, comparing KMT2Dmut with KMT2Dwt patients, significant activation of Treg cells was observed by GSEA (Supplementary Figure 2) [21].
KMT2D mutations inhibited H3K4 methylation and induced Treg cells with tumor microenvironment
The possible structure-function relationship of the mutants was addressed using crystal structure of the protein encoded by KMT2D (PDB 4Z4P). For example, KMT2D C5092 is Zinc-coordinating cysteine on PHD domain, C5092R affected KMT2D binding to methylated histones and other nuclear proteins. KMT2D G5182fs and W5395X caused premature termination of translation, resulting in functional haploinsufficiency. KMT2D R5432Q reduced methyltransferase activity by disordering the SET-I region stability causing H3K4me docking into binding channel difficulty, as compared to wild-type KMT2D (Figure 2A and Supplementary Figure 3). To determine the biological function of KMT2D mutations, germinal center B-cell (GCB) DLBCL cell line (SU-DHL-4) and activated B-cell (ABC) DLBCL cell line (U-2932) were engineered to express a fragment of KMT2D (amino acid 4839-5537, containing SET domain for wild-type, KMT2DC5092R, KMT2DG5182fs, KMT2DW5395X and KMT2DR5432Q) protein. KMT2Dwt, KMT2DC5092R, KMT2DG5182fs, KMT2DW5395X and KMT2DR5432Q, as well as shRNA to knockdown KMT2D (KMT2Dkd) were established and transfected into SU-DHL-4 and U-2932 cells. KMT2D encodes a highly conserved protein that catalyzes the methylation of lysine 4 on histone H3 (H3K4) [6]. Compared with Vector or Scramble cells, the trimethylation of lysine 4 on histone H3 (H3K4me3) levels were decreased in KMT2DC5092R, KMT2DG5182fs, KMT2DW5395X, KMT2DR5432Q, or KMT2Dkd SU-DHL-4 and U-2932 cells, as revealed by western blot (Figure 2B). Representative immunofluorescence assay of H3K4me3 expression was shown in KMT2DR5432Q and KMT2Dkd SU-DHL-4 cells. Nuclei were counterstained with DAPI. Fluorescence intensity of H3K4me3 represents protein expression level.
KMT2D mutations inhibited H3K4 methylation and induced Treg cells. (A). Cartoon representation of KMT2D (PDB 4Z4P). The cofactor byproduct S-adenosyl-L-homocysteine (SAH) and mutations (R5432Q, E5445A, G5449S and S5499R) are shown as sticks. The coordinated Zn2+ ion shown as a sphere. The H3K4me binding channel is indicated as gray oval (left panel). Cartoon representation of SET-I. The orientation of the SET-I region is important for KMT2D activation, as SET-I and Post-SET domains anchor H3K4me substrate promoting its proximity to the SAH and active sites. The position of β-sheet 4 and 6 are stabilized by R5432, E5458 and H5459, R5432 forms salt bridges with E5458, H5459 assisted the salt bridge stability. R5432Q mutation disordered the SET-I region stability causing H3K4me docking into binding channel difficulty. Consequently, R5432Q mutation shown reduced methyltransferase activity compared with wild-type (right panel). (B). Protein expression of H3K4me3 detected in Vector, KMT2Dwt, KMT2DC5092R, KMT2DG5182fs, KMT2DW5395X, KMT2DR5432Q, Scramble, KMT2Dkd1, KMT2Dkd2 of SU-DHL-4 and U-2932 cells by western blot. H3 was used as loading controls. (C). Immunofluorescence assay of H3K4me3 in tumor samples of KMT2Dwt, KMT2DR5432Q, Scramble and KMT2Dkd1of SU-DHL-4 cells. (D, E). Immunohistochemistry study of H3K4me3 (D) and Foxp3 (E) in tumor samples of DLBCL patients with and without KMT2D mutations.
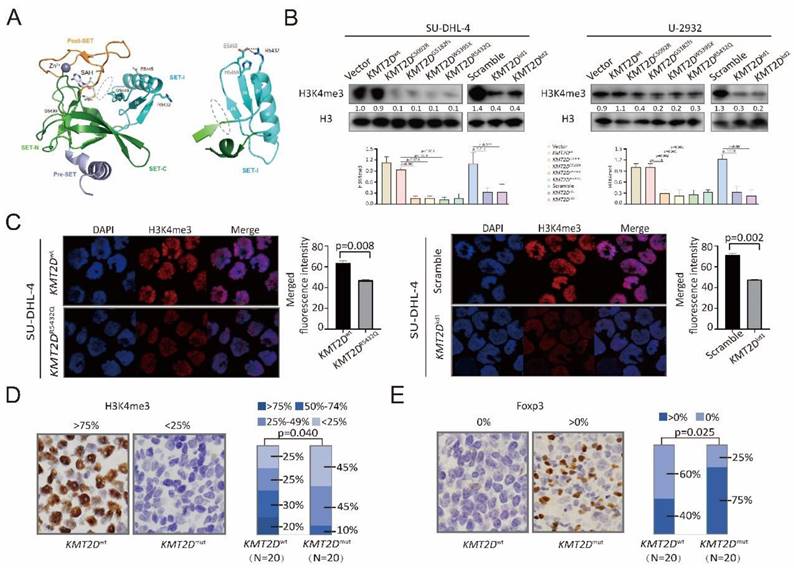
According to the merged fluorescence intensity of DAPI and H3K4me3, the H3K4me3 expression in KMT2DR5432Q and KMT2Dkd SU-DHL-4 cells was higher than KMT2Dwt and Scramble SU-DHL-4 cells (Figure 2C). In consistence with in vitro data, a lower percentage of nuclear H3K4me3-positive cells was observed in tumor samples of KMT2Dmut patients than those of KMT2Dwt patients (p=0.040, Figure 2D). Higher levels of Treg cells, characterized by Foxp3-positive cells, were observed in tumor samples of KMT2Dmut patients than those of KMT2Dwt patients (p=0.025, Figure 2E). Therefore, KMT2D mutations were biologically functional and related to alterations in tumor-induced Treg cells in DLBCL.
KMT2D mutations downregulated FBXW7 and activated NOTCH/MYC signaling
To determine the possible effects of KMT2D mutations on signaling transduction, RNA sequencing was performed on 402 patients, and differentially expressed genes were analyzed by KEGG. Modulations of multiple signaling pathways were identified (Figure 3A), particularly NOTCH signaling pathway (p < 0.001, Figure 3B). A higher percentage of intracellular portions of NOTCH1 (NICD)-positive cells were observed in tumor samples of KMT2Dmut patients than those of KMT2Dwt patients (p=0.044, Figure 3C), indicating the link of KMT2D mutations with NOTCH signaling activation. Among genes associated with NOTCH signaling pathway, MYC is the most important downstream target gene [22]. As revealed by RNA sequencing, KMT2Dmut patients presented with increased MYC and NOTCH1 expression (p=0.004, Figure 3D and p=0.049, Figure 3E). MYC expression showed positive linear correlation with NOTCH1 expression (p=0.006, Supplementary Figure 4A).
KMT2D mutations inhibited FBXW7 and activated NOTCH/MYC cascade. (A). Pathway enrichment analysis of DLBCL patients with or without KMT2D mutations according to the Kyoto Encyclopedia of Genes and Genomes (KEGG) database. (B). Gene Set Enrichment Analysis (GSEA) enriched differentially expressed genes in NOTCH signaling pathway with or without KMT2D mutations. Enrichment scores were listed with p-value. NES, normalized enrichment score; FDR, false discovery rate. (C). Immunohistochemistry study of intracellular portions of NOTCH1 (NICD) in tumor samples of DLBCL patients with or without KMT2D mutations. (D). Normalized mRNA expression of MYC in tumor samples of DLBCL patients with or without KMT2D mutations as revealed by RNA sequencing. (E). Normalized mRNA expression of NOTCH1 in tumor samples of DLBCL patients with or without KMT2D mutations as revealed by RNA sequencing. (F). Genes associated with NOTCH signaling pathway calculated based on rank metric score from GSEA in KMT2Dmut DLBCL patients, as compared to KMT2Dwt DLBCL patients. (G). Occupancies of H3K4me3 in the proximal promoter areas of FBXW7 in KMT2Dwt, KMT2DR5432Q, KMT2Dkd and Scramble SU-DHL-4 cells by chromatin immunoprecipitation (ChIP) assay. (H). Protein expression of FBXW7, NICD and MYC in KMT2DC5092R, KMT2DG5182fs, KMT2DW5395X, KMT2DR5432Q, KMT2Dkd1 and KMT2Dkd2 SU-DHL-4 cells, as compared to KMT2Dwt or Scramble cells by western blot. β-actin was used as a loading control. (I). Protein expression of NICD and MYC in KMT2DR5432Q and KMT2Dkd SU-DHL-4 cells by western blot with and without NOTCH inhibitor (γ-secretase inhibitor, GSI-I, 50μm) treatment for 48h. β-actin was used as a loading control.
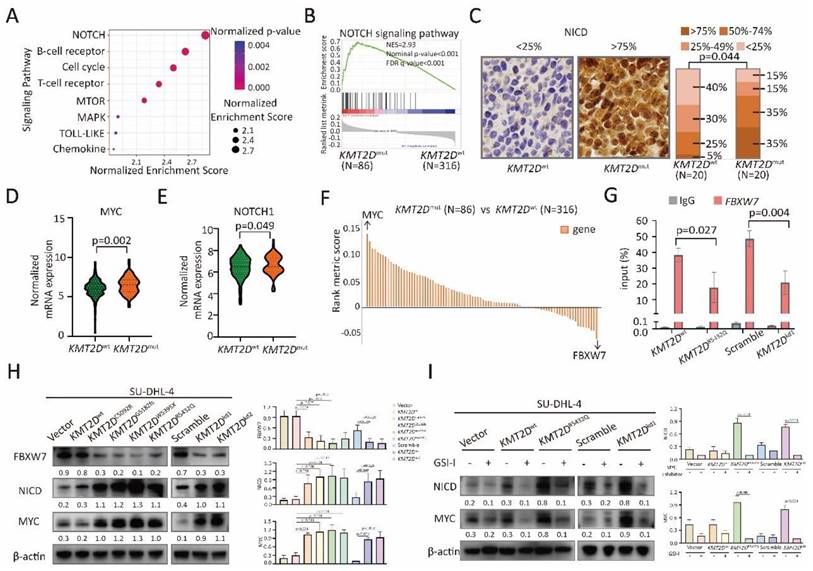
Among genes associated with NOTCH signaling pathway (Figure 3F), FBXW7 is a critical NOTCH suppressor and negatively regulates NOTCH cascade through downregulation of NICD [11]. As expected, compared with KMT2Dwt patients, FBXW7 expression decreased in KMT2Dmut patients (p=0.043, Supplementary Figure 4B). By quantitative RT-PCR, KMT2DR5432Q and KMT2Dkd resulted in significantly decreased expression of FBXW7 in SU-DHL-4 and U-2932 cells (Supplementary Figure 4C). ChIP assay showed lower occupancies of H3K4me3 in the proximal promoter areas of FBXW7 in KMT2DR5432Q and KMT2Dkd SU-DHL-4 cells than those in KMT2Dwt and scramble SU-DHL-4 cells (Figure 3G). In consistent with ChIP assay, FBXW7 were downregulated, while NICD and MYC were upregulated in KMT2DC5092R, KMT2DG5182fs, KMT2DW5395X, KMT2DR5432Q and KMT2Dkd cells by western blot (Figure 3H). Besides, we used NOTCH inhibitor (γ-secretase inhibitor, GSI-I) to treat SU-DHL-4 cells. As a consequence of NICD downregulation by GSI-I, MYC expression was reduced in KMT2DR5432Q and KMT2Dkd SU-DHL-4 cells (Figure 3I). Together, these data suggested that KMT2D mutations downregulated FBXW7 and activated NOTCH/MYC signaling.
KMT2D mutations promoted tumor-induced Treg cell trafficking via upregulation of TGF-β1
KMT2DR5432Q and KMT2Dkd induced a significantly increase in cell growth when co-cultured with peripheral blood mononuclear cells (PBMCs), as compared to Vector or Scramble cells, indicating that proliferation of B-lymphoma cells was influenced by the tumor microenvironment (Figure 4A). In order to explore the tumor microenvironmental change in KMT2Dmut patients, we performed single-cell RNA sequencing on 6 DLBCL patients, including 3 KMT2Dmut patients and 3 KMT2Dwt patients. Different cluster represented Treg cells, as well as B cells, T cells (non-Treg cells), and monocytes (Figure 4B and 4C). The number of Treg cells was increased in KMT2Dmut patients, as compared to KMT2Dwt patients. No difference was observed in other type of cells (Figure 4D).
KMT2D mutations promoted Treg cell trafficking. (A). The viability of KMT2DR5432Q SU-DHL-4 cells (left panel) and KMT2Dkd (right panel) when co-cultured with peripheral blood mononuclear cells (PBMCs) at 1:1 ratio or 1:5 ratio for 72 hours. *p < 0.05 comparing with Vector or Scramble SU-DHL-4 cells. (B, C). Main sub-clones shown by t-distributed stochastic neighbor embedding (tSNE) mapping of KMT2Dwt and KMT2Dmut DLBCL patients. Fractions of relative proportions of main sub-clones. (D). Fractions of relative proportions of sub-clones. (E). Pathway enrichment analysis of Treg cells in KMT2Dmut or KMT2Dwt patients according to KEGG database. (F). Main sub-clones shown by tSNE mapping of KMT2Dwt, KMT2DR5432Q SU-DHL-4 cells, co-cultured with PBMCs of 1:5 ratio for 72h. (G). Fractions of relative proportions of PBMC sub-clones. (H). Flow cytometry analysis of Treg cells markers (CD25 and Foxp3) in PBMCs, co-cultured with KMT2Dwt, KMT2DR5432Q, Scramble, KMT2Dkd SU-DHL-4 and U-2932 cells for 72h.
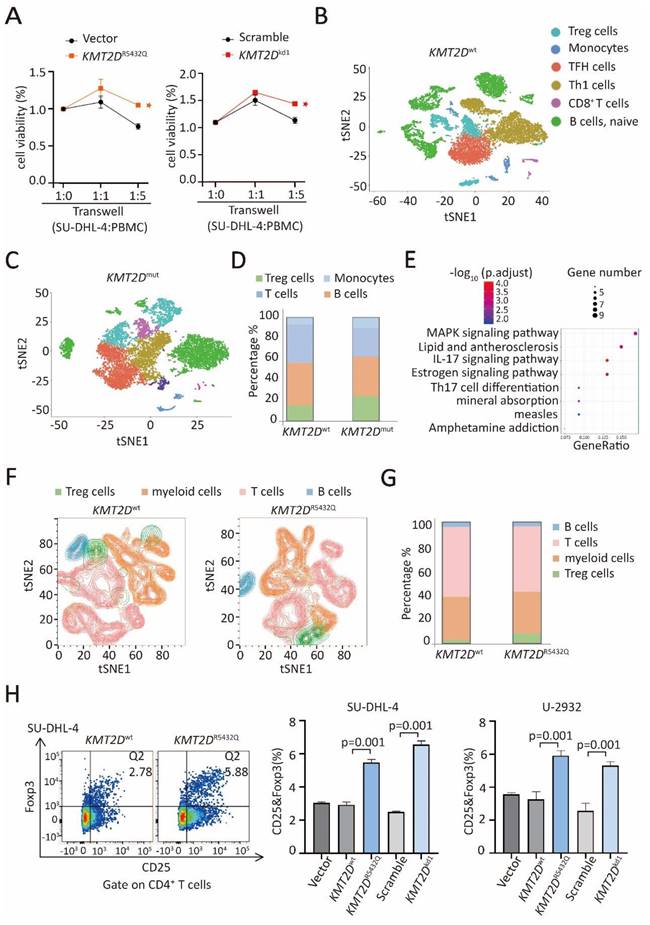
KEGG pathway enrichment of differently expressed gene of Treg cells in KMT2Dmut patients revealed significant MAPK pathway activation (Figure 4E). Given that Treg cells were significantly increased in KMT2Dmut patients by RNA sequencing and single-cell sequencing, we performed multiple color flowcytometry analysis in SU-DHL-4 cells co-cultured with PBMCs, different clusters represented Treg cells, B cells, T cells (excluding Treg cells) and myeloid cells (Figure 4F). In the co-culture system, the number of CD4+Foxp3+ Treg cells was increased in KMT2DR5432Q SU-DHL-4 cells, as compared to KMT2Dwt cells, without difference observed in other type of cells (Figure 4G). Next, we performed flow cytometry analysis in SU-DHL-4 and U-2932 cells, KMT2DR5432Q and KMT2Dkd induced a significantly high level of CD25+Foxp3+ Treg cells than KMT2Dwt or Scramble cells, when co-cultured with PBMCs (Figure 4H).
TGF-β1 and IL-10 are essential in Treg cell trafficking in tumor microenvironment [12, 23]. Comparing with KMT2Dwt patients, TGF-β1 expression was increased in KMT2Dmut patients (p=0.001, Figure 5A), while IL-10 remained unchanged (Supplementary Figure 5). By quantitative RT-PCR (Figure 5B), KMT2DR5432Q and KMT2Dkd resulted in significantly increased TGF-β1 expression at transcriptional level.
KMT2D mutations promoted Treg cell trafficking via TGF-β1 axis. (A). Normalized mRNA expression of TGF-β1 in tumor samples of DLBCL patients with or without KMT2D mutations as revealed by RNA sequencing data. (B). Relative gene expression of TGF-β1 in KMT2DR5432Q and KMT2Dkd SU-DHL-4 and U-2932 cells, as compared to KMT2Dwt or Scramble cells by quantitative real-time PCR (RT-PCR). (C). Protein expression of TGF-β1 in KMT2DC5092R, KMT2DG5182fs, KMT2DW5395X, KMT2DR5432Q, KMT2Dkd1 and KMT2Dkd2 SU-DHL-4 and U-2932 cells, as compared to KMT2Dwt or Scramble cells by western blot. β-actin was used as a loading control. (D). Luciferase reporter assay in HEK-293T cells indicated the luciferase activity after the co-transfection with c-Myc wild-type and mutant. (E). Protein expression of MYC and TGF-β1 in KMT2DR5432Q and KMT2Dkd SU-DHL-4 cells by western blot with and without MYC inhibitor (50μm) treatment for 48h. β-actin was used as a loading control. (F). Flow cytometry analysis of Treg cells markers (CD25 and Foxp3) in PBMCs, co-cultured with KMT2DR5432Q or KMT2Dkd SU-DHL-4 cells with or without MYC inhibitor treatment (50μm) for 72h.
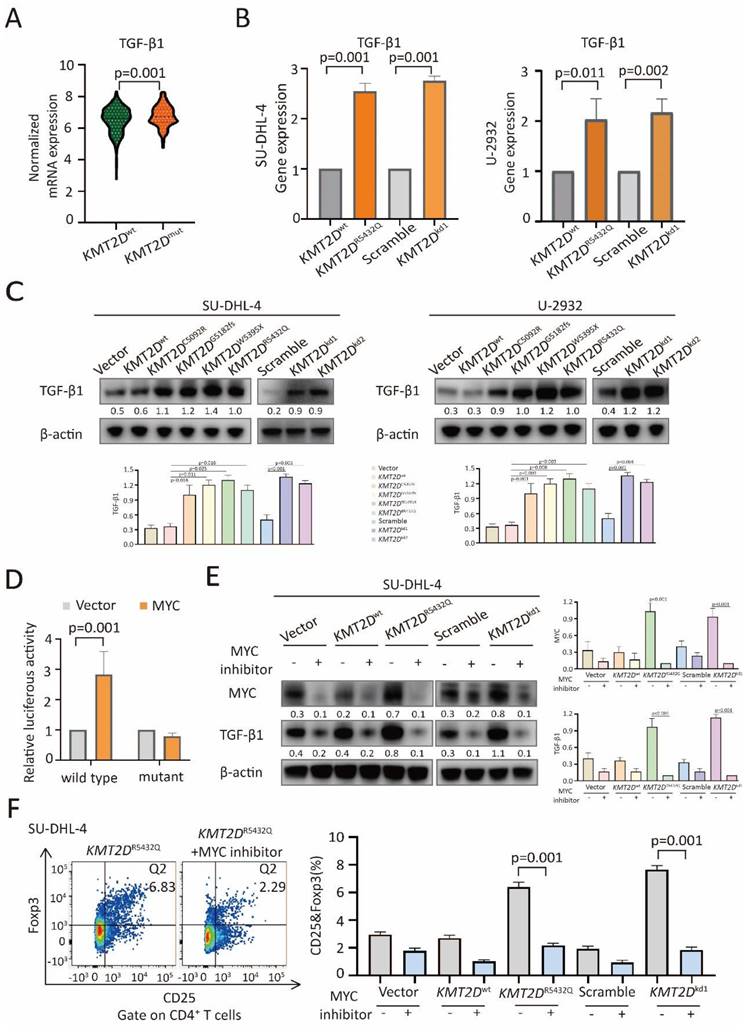
In consistent with RT-PCR assay, TGF-β1 was upregulated in KMT2DC5092R, KMT2DG5182fs, KMT2DW5395X, KMT2DR5432Q and KMT2Dkd cells at protein level by western blot (Figure 5C). The transcription factor MYC can bind with the promoter region of TGF-β1 [24, 25]. As revealed by luciferase reporter assay, MYC positively regulated the transcriptional activity of the TGF-β1 promoter region (-133 to -127) [24] in HEK-293T cells (Figure 5D), suggesting that MYC targeted TGF-β1 through this binding site. To determine the role of NOTCH/MYC signaling in TGF-β1 upregulation and Treg cell trafficking, we used MYC inhibitor to treat SU-DHL-4 cells. As a consequence of MYC downregulation by MYC inhibitor, TGF-β1 expression was reduced in both KMT2DR5432Q and KMT2Dkd cells by western blot (Figure 5E). Correspondingly, Treg cells were decreased upon MYC inhibitor treatment by flow cytometry analysis (Figure 5F). Together, our data demonstrated that KMT2D mutations induced NOTCH-MYC activation, as well as MYC-dependent TGF-β1 secretion, and resulted in tumor induced-Treg cell trafficking.
KMT2D mutations promoted tumor-induced Treg cell trafficking via FBXW7-NOTCH-MYC/TGF-β1 axis in PBMC-transferred NOD-scid murine models
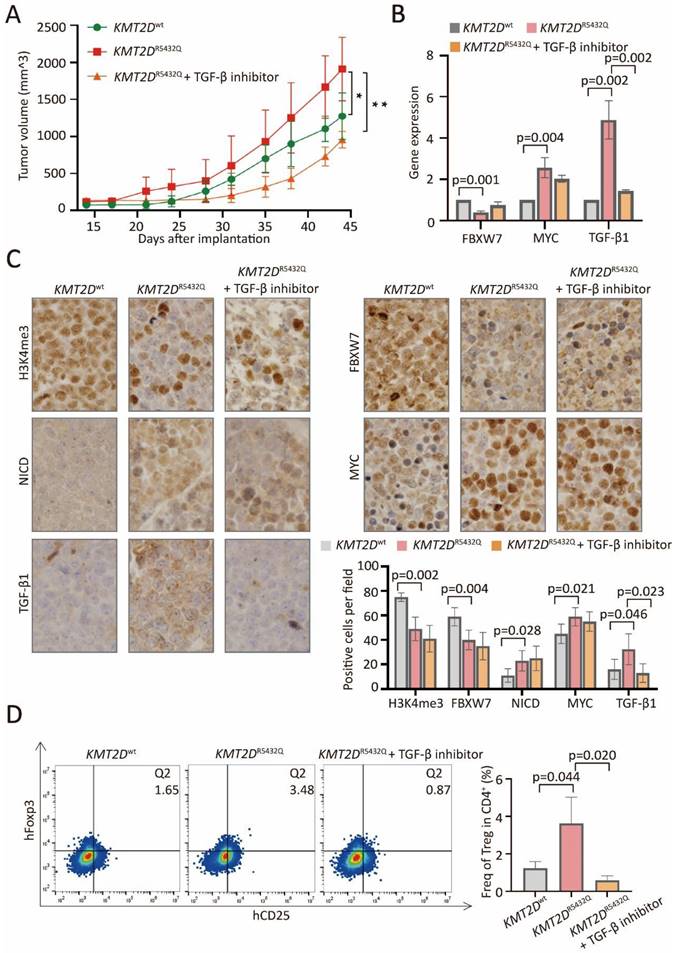
In PBMC-transferred M-NSG murine models established with subcutaneous injection of SU-DHL-4 cells, the tumor size formed in mice with KMT2DR5432Q were significantly increased, as compared to KMT2Dwt, which could be counteracted by TGF-β inhibitor (Figure 6A). Downregulated expression of FBXW7, upregulated expression of MYC and TGF-β1 were detected in KMT2DR5432Q murine models by quantitative RT-PCR (Figure 6B). Downregulated protein expression of H3K4me3 and FBXW7, upregulated expression of NICD, MYC and TGF-β1 were detected in KMT2DR5432Q murine models by immunohistochemistry (Figure 6C). Upregulation of TGF-β1 could be reversed by TGF-β inhibitor. Flow cytometry analysis showed increased amounts of tumor-induced Treg cells in KMT2DR5432Q murine models, which could also be interacted by TGF-β inhibitor (Figure 6D).
KMT2D mutations promoted tumor-induced Treg cell trafficking via FBXW7-NOTCH/MYC/TGF-β1 axis in PBMC-transferred M-NSG murine models. (A). Tumor volume of murine models injected subcutaneously with KMT2DR5432Q SU-DHL-4 cells. Error bars represent SD (n = 5). *p < 0.05; **p < 0.01; comparing with those of KMT2Dwt SU-DHL-4 cells. (B). RT-PCR of FBXW7, MYC and TGF-β1 in KMT2Dwt, KMT2DR5432Q and TGF-β inhibitor-treated KMT2DR5432Q murine models. (C). Immunohistochemical assay of H3K4me3, FBXW7, NICD, MYC and TGF-β1 in KMT2Dwt, KMT2DR5432Q and TGF-β inhibitor-treated KMT2DR5432Q murine models. (D). Flow cytometry analysis of Treg markers (CD25 and Foxp3) in KMT2Dwt, untreated KMT2DR5432Q and TGF-β inhibitor-treated KMT2DR5432Q murine models.
Discussion
KMT2D mutations were highly recurrent in DLBCL and significantly associated with poor clinical outcomes. Here we provided further clinical evidence that dysregulation of histone methylation was important tumorigenic event in DLBCL. Functionally, KMT2D mutations occur early during tumorigenesis in DLBCL by inhibiting global H3K4 methylation, perturbing the expression of tumor suppressor genes that control B-cell activating pathways [4, 26]. In B-lymphoma cells and in tumor samples of DLBCL patients, we showed that KMT2D mutations decreased H3K4me3, downregulated tumor suppressor gene FBXW7 [27], and more importantly, activated downstream NOTCH/MYC signaling, which are critically involved in DLBCL [28]. Indeed, KMT2D contains multiple N-terminal phosphodegrons required to promote interaction with FBXW7, which could control proteasome-mediated degradation of oncoproteins particularly as NOTCH [27, 29]. As downstream effectors of NOTCH signaling pathway [30, 31], MYC was correspondingly upregulated in a NOTCH-dependent manner. As similar mechanism of action, loss of function of KMT2D inhibits tumor suppressor genes DNMT3A and BCL6, upregulates NOTCH pathway, and induces medulloblastoma in murine models [6].
During T-cell lymphomagenesis, KMT2D mutations were also identified as a prognostic marker through altering the stability of the activator complex, affecting the expression of tumor suppressor genes and NOTCH signaling pathway [32]. Together, KMT2D mutations promoted tumor progression by regulating FBXW7-NOTCH-MYC axis in DLBCL.
KMT2D deficiency affects expression of a specific set of genes significantly associated with immune signaling pathways, including Treg cell differentiation [26, 33]. Recent study has shown that KMT2Dmut cells exhibit increased protein turnover and IFN-γ-stimulated antigen presentation across multiple cancer types. KMT2Dmut liver cancer is characterized by increased immune infiltration such as CD45+ immune cells, CD4+ T cells, and macrophages [34]. We revealed, both in vitro and in vivo, that KMT2D mutations induced B-lymphoma cell proliferation, with the presence of tumor microenvironment. Single-cell RNA sequencing further confirmed that KMT2D mutations increased Treg cell trafficking in DLBCL. Tumor-induced Treg cells [14] contributed to tumor progression by expressing not only a plethora of genes with well-established immune suppressive function, but also genes that support a committed Foxp3+ Treg phenotype [35]. To our knowledge, this is the first report on the impact of KMT2D mutations on Treg cells, suggesting an alternative mechanism of epigenetic alterations on tumor microenvironment in DLBCL.
Treg cells within tumor microenvironment could suppress immunosurveillance function to promote lymphoma progression [36, 37]. The NOTCH signaling pathway and downstream effector MYC are critically involved in Treg cell recruiting activity and function [38, 39]. Experimentally, MYC could accelerate TGF-β1 transcription and promote oral squamous cell carcinoma tumorigenesis [24]. TGF-β1 is a potent immunosuppressive cytokine and stimulates the differentiation of Treg cells [40, 41]. TGF-β receptor inhibitor SB431542 significantly reduced Treg cells and the tumor burden in fibrosarcoma-bearing mice [42]. Here we found that tumor cell growth and tumor-induced Treg cell trafficking were increased in KMT2Dmut DLBCL, which could be subsequently counteracted by TGF-β inhibitor. Our data demonstrated the NOTCH-MYC/TGF-β1 axis as an important mechanism of tumor progression related to tumor-induced Treg cells in DLBCL. Considering that the NOTCH inhibitor has an off-target effect and is toxic if applied systemically, designing a more effective way to target TGF-β1 can be a feasible immunomodulatory intervention for DLBCL treatment.
Conclusions
In conclusion, mutations of histone methylation gene KMT2D may modulate tumor-induced Treg cell trafficking via the FBXW7-NOTCH-MYC/TGF-β1 axis. Aberrant histone methylation on tumor microenvironment can be considered as an alternative mechanism of tumor progression in DLBCL.
Abbreviations
ChIP: Chromatin immunoprecipitation
DLBCL: diffuse large B-cell lymphoma
GSEA: Gene Set Enrichment Analysis
KEGG: Kyoto Encyclopedia of Genes and Genomes
NICD: intracellular portions of NOTCH1
OS: overall survival
PFS: progression-free survival
PBMC: peripheral blood mononuclear cell
RT-PCR: quantitative real-time PCR
Treg cells: regulatory T cells
tSNE: t-distributed stochastic neighbor embedding
WGS/WES: whole-genome/exome sequencing
Supplementary Material
Supplementary figures and tables.
Acknowledgements
This study was supported, in part, by research funding from the National Natural Science Foundation of China (81830007 and 82130004), Clinical Research Plan of Shanghai Hospital Development Center (SHDC2020CR1032B), Chang Jiang Scholars Program, Shanghai Municipal Education Commission Gaofeng Clinical Medicine Grant Support (20152206 and 20152208), Multicenter Clinical Research Project by Shanghai Jiao Tong University School of Medicine (DLY201601), Innovative research team of high-level local universities in Shanghai, and the Samuel Waxman Cancer Research Foundation and the Science and Technology Commission of Shanghai Municipality (21ZR1440100).
We gratefully appreciate the efforts and contributions of Dr. Peter Liao for English editing.
Data access statement
All data needed to evaluate the conclusions in the paper are present in the paper and/or the Table. S3. Additional data related to this paper may be requested from the authors. The data of WES/WGS, RNA sequencing, and single-cell RNA sequencing generated in this study are available in NODE (https://www.biosino.org/node) under project OEP001143 or through the URL: https://www.biosino.org/node/project/detail/OEP001143.
Ethics approval and consent to participate
This study has been approved by the ethics committee of Ruijin Hospital, Shanghai Jiao Tong University School of Medicine (Shanghai, China), and the study was conducted in accordance with the Declaration of Helsinki. Written informed consent was obtained from all patients before this study.
Author contributions
ZWL, WCF and JMM conceived this project and supervised all the experiments. LQX designed and performed the molecular biology, protein chemistry, and cell culture experiments. LQX, ZY, YHM and SYG analyzed the data and drafted the manuscript. XPP, XHM and ZLT are responsible for sample collection. HYH, FD, CS and WL performed bioinformatic analyses. All authors read and approved the final manuscript.
Competing Interests
The authors have declared that no competing interest exists.
References
1. Miao Y, Medeiros LJ, Li Y. et al. Genetic alterations and their clinical implications in DLBCL. Nat Rev Clin Oncol. 2019;16:634-652
2. Wang L, Li LR, Young KH. New agents and regimens for diffuse large B cell lymphoma. J Hematol Oncol. 2020;13:175
3. Pasqualucci L, Dalla-Favera R. Genetics of diffuse large B-cell lymphoma. Blood. 2018;131:2307-2319
4. Zhang J, Dominguez-Sola D, Hussein S. et al. Disruption of KMT2D perturbs germinal center B cell development and promotes lymphomagenesis. Nat Med. 2015;21:1190-1198
5. Shilatifard A. The COMPASS family of histone H3K4 methylases: mechanisms of regulation in development and disease pathogenesis. Annu Rev Biochem. 2012;81:65-95
6. Dhar SS, Zhao D, Lin T. et al. MLL4 Is Required to Maintain Broad H3K4me3 Peaks and Super-Enhancers at Tumor Suppressor Genes. Mol Cell. 2018;70:825-841.e826
7. Ji MM, Huang YH, Huang JY. et al. Histone modifier gene mutations in peripheral T-cell lymphoma not otherwise specified. Haematologica. 2018;103:679-687
8. Autio M, Leivonen SK, Brück O. et al. Immune cell constitution in the tumor microenvironment predicts the outcome in diffuse large B-cell lymphoma. Haematologica. 2021;106:718-729
9. Kotlov N, Bagaev A, Revuelta MV. et al. Clinical and Biological Subtypes of B-cell Lymphoma Revealed by Microenvironmental Signatures. Cancer Discov. 2021;11:1468-1489
10. Tanaka A, Sakaguchi S. Regulatory T cells in cancer immunotherapy. Cell Res. 2017;27:109-118
11. Huang YH, Cai K, Xu PP. et al. CREBBP/EP300 mutations promoted tumor progression in diffuse large B-cell lymphoma through altering tumor-associated macrophage polarization via FBXW7-NOTCH-CCL2/CSF1 axis. Signal Transduct Target Ther. 2021;6:10
12. Wing JB, Tanaka A, Sakaguchi S. Human FOXP3(+) Regulatory T Cell Heterogeneity and Function in Autoimmunity and Cancer. Immunity. 2019;50:302-316
13. Togashi Y, Shitara K, Nishikawa H. Regulatory T cells in cancer immunosuppression - implications for anticancer therapy. Nat Rev Clin Oncol. 2019;16:356-371
14. Kanamori M, Nakatsukasa H, Okada M. et al. Induced Regulatory T Cells: Their Development, Stability, and Applications. Trends Immunol. 2016;37:803-811
15. Li C, Jiang P, Wei S. et al. Regulatory T cells in tumor microenvironment: new mechanisms, potential therapeutic strategies and future prospects. Mol Cancer. 2020;19:116
16. Guo XY, Zhang GH, Wang ZN. et al. A novel Foxp3-related immune prognostic signature for glioblastoma multiforme based on immunogenomic profiling. Aging (Albany NY). 2021;13:3501-3517
17. Lin H, Ma N, Zhao L. et al. KDM5c Promotes Colon Cancer Cell Proliferation Through the FBXW7-c-Jun Regulatory Axis. Front Oncol. 2020;10:535449
18. Hao Y, Hao S, Andersen-Nissen E. et al. Integrated analysis of multimodal single-cell data. Cell. 2021;184:3573-3587.e3529
19. Aran D, Looney AP, Liu L. et al. Reference-based analysis of lung single-cell sequencing reveals a transitional profibrotic macrophage. Nat Immunol. 2019;20:163-172
20. Xu L, Deng C, Pang B. et al. TIP: A Web Server for Resolving Tumor Immunophenotype Profiling. Cancer Res. 2018;78:6575-6580
21. Haribhai D, Lin W, Edwards B. et al. A central role for induced regulatory T cells in tolerance induction in experimental colitis. J Immunol. 2009;182:3461-3468
22. Sanchez-Martin M, Ferrando A. The NOTCH1-MYC highway toward T-cell acute lymphoblastic leukemia. Blood. 2017;129:1124-1133
23. Raffin C, Vo LT, Bluestone JA. T(reg) cell-based therapies: challenges and perspectives. Nat Rev Immunol. 2020;20:158-172
24. Zhao W, Cui Y, Liu L. et al. Splicing factor derived circular RNA circUHRF1 accelerates oral squamous cell carcinoma tumorigenesis via feedback loop. Cell Death Differ. 2020;27:919-933
25. Zhang Y, Wang S, Lai Q. et al. Cancer-associated fibroblasts-derived exosomal miR-17-5p promotes colorectal cancer aggressive phenotype by initiating a RUNX3/MYC/TGF-β1 positive feedback loop. Cancer Lett. 2020;491:22-35
26. Ortega-Molina A, Boss IW, Canela A. et al. The histone lysine methyltransferase KMT2D sustains a gene expression program that represses B cell lymphoma development. Nat Med. 2015;21:1199-1208
27. Yeh CH, Bellon M, Nicot C. FBXW7: a critical tumor suppressor of human cancers. Mol Cancer. 2018;17:115
28. Karube K, Enjuanes A, Dlouhy I. et al. Integrating genomic alterations in diffuse large B-cell lymphoma identifies new relevant pathways and potential therapeutic targets. Leukemia. 2018;32:675-684
29. Saffie R, Zhou N, Rolland D. et al. FBXW7 Triggers Degradation of KMT2D to Favor Growth of Diffuse Large B-cell Lymphoma Cells. Cancer Res. 2020;80:2498-2511
30. Herranz D, Ambesi-Impiombato A, Palomero T. et al. A NOTCH1-driven MYC enhancer promotes T cell development, transformation and acute lymphoblastic leukemia. Nat Med. 2014;20:1130-1137
31. Ntziachristos P, Lim JS, Sage J. et al. From fly wings to targeted cancer therapies: a centennial for notch signaling. Cancer Cell. 2014;25:318-334
32. Khanam T, Sandmann S, Seggewiss J. et al. Integrative genomic analysis of pediatric T-cell lymphoblastic lymphoma reveals candidates of clinical significance. Blood. 2021;137:2347-2359
33. Placek K, Hu G, Cui K. et al. MLL4 prepares the enhancer landscape for Foxp3 induction via chromatin looping. Nat Immunol. 2017;18:1035-1045
34. Wang G, Chow RD, Zhu L. et al. CRISPR-GEMM Pooled Mutagenic Screening Identifies KMT2D as a Major Modulator of Immune Checkpoint Blockade. Cancer Discov. 2020;10:1912-1933
35. Xydia M, Rahbari R, Ruggiero E. et al. Common clonal origin of conventional T cells and induced regulatory T cells in breast cancer patients. Nat Commun. 2021;12:1119
36. Farinha P, Al-Tourah A, Gill K. et al. The architectural pattern of FOXP3-positive T cells in follicular lymphoma is an independent predictor of survival and histologic transformation. Blood. 2010;115:289-295
37. Yang ZZ, Novak AJ, Stenson MJ. et al. Intratumoral CD4+CD25+ regulatory T-cell-mediated suppression of infiltrating CD4+ T cells in B-cell non-Hodgkin lymphoma. Blood. 2006;107:3639-3646
38. Harb H, Benamar M, Lai PS. et al. Notch4 signaling limits regulatory T-cell-mediated tissue repair and promotes severe lung inflammation in viral infections. Immunity. 2021;54:1186-1199.e1187
39. Saravia J, Zeng H, Dhungana Y. et al. Homeostasis and transitional activation of regulatory T cells require c-Myc. Sci Adv. 2020;6:eaaw6443
40. Chen W, Ten Dijke P. Immunoregulation by members of the TGFβ superfamily. Nat Rev Immunol. 2016;16:723-740
41. Batlle E, Massagué J. Transforming Growth Factor-β Signaling in Immunity and Cancer. Immunity. 2019;50:924-940
42. Premkumar K, Shankar BS. TGF-βR inhibitor SB431542 restores immune suppression induced by regulatory B-T cell axis and decreases tumour burden in murine fibrosarcoma. Cancer Immunol Immunother. 2021;70:153-168
Author contact
![]() Corresponding authors: Wei-Li Zhao, Email: zhao.weilicom, Chao-Fu Wang, Email: wangchaofucom and Meng-Meng Ji, Email: jimengmeng025com, Shanghai Institute of Hematology, State Key Laboratory of Medical Genomics, Department of Pathology, Shanghai Rui Jin Hospital, 197 Rui Jin Er Road, Shanghai 200025, China. Tel: 0086-21-64370045, Fax: 0086-21-64743206.
Corresponding authors: Wei-Li Zhao, Email: zhao.weilicom, Chao-Fu Wang, Email: wangchaofucom and Meng-Meng Ji, Email: jimengmeng025com, Shanghai Institute of Hematology, State Key Laboratory of Medical Genomics, Department of Pathology, Shanghai Rui Jin Hospital, 197 Rui Jin Er Road, Shanghai 200025, China. Tel: 0086-21-64370045, Fax: 0086-21-64743206.