Impact Factor ISSN: 1449-2288
- Issue 12; 2026
- Issue 11; 2026
- Issue 10; 2026
- Issue 9; 2026
- Issue 8; 2026
- Volume 22; 2026
- Past Issues
- Advance Articles
- Editorial Board
- Cover Images
- Index & Coverage
- Cover Suggestion
- Special Issues
Introduction
Methods
Results
Discussion
Abbreviations
Supplementary Material
Acknowledgements
References

 Global reach, higher impact
Int J Biol Sci 2025; 21(4):1478-1496. doi:10.7150/ijbs.103428 This issue Cite
Research Paper
FTO-induced APOE promotes the malignant progression of pancreatic neuroendocrine neoplasms through FASN-mediated lipid metabolism
Jinhao Chen1,2*, Mujie Ye1*, Danyang Gu1*, Ping Yu1*, Lin Xu1, Bingyang Xue1, Lijun Yan1, Feiyu Lu1, Chunhua Hu1, Yanling Xu1, Xiaoting Shi1, Lingyi Chen1, Yan Wang3,4 ![]() , Jianan Bai1
, Jianan Bai1 ![]() , Ye Tian1
, Ye Tian1 ![]() , Qiyun Tang1
, Qiyun Tang1 ![]()
1. Department of Geriatric Gastroenterology, Neuroendocrine Tumor Center, Jiangsu Province Hospital, The First Affiliated of Nanjing Medical University, Institute of Neuroendocrine Tumor, Nanjing Medical University, Nanjing, China.
2. Center for Biomarker Discovery and Validation, National Infrastructures for Translational Medicine (PUMCH), Institute of Clinical Medicine, Peking Union Medical College Hospital, Chinese Academy of Medical Science & Peking Union Medical College, Beijing, China.
3. Digestive Endoscopy, Jiangsu Province Hospital, The First Affiliated Hospital of Nanjing Medical University, China.
4. Department of Gastroenterology, The Friendship Hospital of Ili Kazakh Autonomous Prefecture, Ili State 835000, China.
* These authors contributed equally.
Received 2024-9-9; Accepted 2025-1-1; Published 2025-1-27
Abstract

N6-methyladenosine (m6A) is considered the most prevalent RNA epigenetic regulator in cancer. FTO, an m6A demethylase, has been implicated in contributing to the progression of various cancers by up-regulating the expression of multiple oncogenes. However, studies exploring its impact on lipid metabolism in cancer, especially in pNENs, remain scarce. In this study, we demonstrated that FTO was up-regulated in pNENs and played a critical role in tumor growth and lipid metabolism. Mechanistically, we discovered that FTO over-expression increased the expression of APOE in an m6A-IGF2BP2-dependent manner, leading to dysregulation of lipid metabolism. Furthermore, we found APOE could activate the PI3K/AKT/mTOR signaling pathway, thereby enhancing lipid metabolism and proliferative capabilities, by orchestrating the state of FASN ubiquitination. In conclusion, our study reveals the FTO/IGF2BP2/APOE/FASN/mTOR axis as a mechanism underlying aberrant m6A modification in lipid metabolism and provides new insights into the molecular basis for developing therapeutic strategies for pNENs treatment.
Keywords: pancreatic neuroendocrine neoplasms, N6-methyladenosine(m6A), FTO, APOE, lipid metabolism
Introduction
Neuroendocrine neoplasms (NENs) are a heterogeneous group of tumors originating from neuroendocrine cells, occurring in various organs, including the lungs, digestive tract, and pancreas [1]. Among gastroenteropancreatic neuroendocrine neoplasms in Asian countries, pNENs are the most common type, accounting for 34.9-38.6% of cases and with an incidence rate of 1.01 per 100,000 individuals [2,3]. Although pNENs constitute only 2-5% of all pancreatic cancers, their annual incidence (> 6%) is increasing more rapidly than any other histological subtype [4]. Surgery remains the primary and potentially curative treatment for pNENs [5]. However, high recurrence rates, up to 48%, have been reported following curative resection [6]. The five-year survival rate post-surgery ranges between 65 and 86% [7,8]. The management of pNENs involves a multidisciplinary approach, including surgical intervention, somatostatin analogs, molecularly targeted therapies, peptide receptor radionuclide therapy, and cytotoxic chemotherapy [9]. Over the years, although the significance of multidisciplinary treatments has grown for effectively controlling tumor development, the availability of molecularly targeted therapies specifically designed for pNENs is currently limited compared to other cancer types, highlighting the need for novel therapeutic targets.
Cellular proliferation is a hallmark of pNENs and cancer in general, requiring enhanced macromolecular biosynthesis to meet structural and energy demands [10]. Tumor cells also adapt to environment stressors, such as hypoxia and reactive oxygen species, through extensive metabolic reprogramming [11]. While the Warburg effect, increased fatty acid uptake, and elevated de novo lipid synthesis are well-documented in other cancers [12], the metabolic remodeling underlying pNENs progression, particularly in lipid metabolism, remains largely unexplored.
Epigenetic modifications, including DNA methylation, histone acetylation, and m6A RNA modification, play crucial roles in tumor metabolic reprogramming [13]. N6-methyladenosine (m6A) is the most prevalent internal RNA modification [14], dynamically regulated by the methyltransferases “writers”, demethylases “erasers”, and “readers”. For instance, the key components of the methyltransferase complex, Methyltransferase-like 3 (METTL3), Methyltransferase-like 14 (METTL14), and Wilms' tumor 1-associated protein (WTAP), are responsible for m6A installation [15]. Conversely, Fat mass and obesity associated protein (FTO) [16] and α-ketoglutarate-dependent dioxygenase alkB homolog 5 (ALKBH5) [17] function as erasers, removing m6A removal to maintain a dynamic balance. Additionally, readers, such as YTHDF1-3 [18], YTHDC1 [19], Insulin-like growth factor 2 mRNA-binding proteins (IGF2BPs) [20], and the heterogeneous nuclear ribonucleoprotein (HNRP) protein family [21], recognize and interpret m6A modifications. Not only amounting studies have underscored the essential role of m6A modification in different diseases, the interaction between m6A and remodeling of metabolic has also been reported. For instance, in colorectal cancer, METTL3/LDHA axis-induced glucose metabolism could overcome 5-FU resistance to promote tumor development [22]. In renal cell carcinoma, downregulated METTL14 promoted distal lung metastasis via glycolytic reprogramming [23]. Additionally, LINC00958 regulated by m6A modification increased lipogenesis in hepatocellular carcinoma [24]. Despite the importance of lipid metabolism and its relevance to different diseases, limited research has been reported on the metabolic alterations of pNENs, particularly concerning the specific metabolism between m6A modification and lipid-related pathways.
In this study, we observed elevated FTO expression and its oncogenic effects in pNENs, both in vitro and in vivo. We further demonstrated that FTO enhanced lipid metabolism by regulating the expression of APOE in an m6A-IGF2BP2 dependent manner. Additionally, we identified FASN as a critical regulator of lipid metabolism in pNENs, modulated via APOE in a ubiquitin-dependent manner. These findings elucidate the role of the FTO/IGF2BP2/APOE/FASN axis in pNENs progression and provide a foundation for future therapeutic strategies.
Methods
Cell culture and tissue samples
The QGP-1 cell line, derived from human pancreatic neuroendocrine tumors (pNENs), was obtained from the JCRB cell bank (JCRB0183). The cells were cultured in RPMI 1640 medium supplemented with 10% fetal bovine serum (FBS, Yeasen, Shanghai, China) and 1% penicillin-streptomycin. The BON-1 cell line was gift from Professor Xianrui Yu of Fudan University Shanghai Cancer Center, was cultured in DMEM/F-12 medium supplemented with 10% fetal bovine serum and 1% penicillin-streptomycin. The primary PNET cells, cultured in McCoy's 5A medium, was isolated from patient tissue samples. All cells were incubated in a humidified atmosphere with 5% CO2 at 37 °C. The pNENs and adjacent normal tissues, diagnosed as pNENs by the Pathology Department, were obtained from Jiangsu Province Hospital. All participants provided their consent.
Cell proliferation assays
Cell Count-ing Kit-8 (CCK-8, New Cell & Molecular Biotech), colony formation, and EdU assays were conducted to elevate the proliferation abilities. For the CCK-8 assay, different groups of cells (5000 per well) were seeded in a 96-well plate with 5 replicates and then incubated at 37 °C for 2 h. The absorbance at 450 nm was continuously measured for 4 days. For colony formation assays, different groups of cells (1.0x10⁴ per well) were seeded in a 6-well plate for 14 days. The cells were fixed with 4% paraformaldehyde and stained with crystal violet solution. Each experiment was conducted in triplicate. For the 5-Ethynyl-2'-deoxyuridine (EdU) cell proliferation assay, cells were seeded into 96-well plates with 50 μM EdU for 2h, fixed with 4% paraformaldehyde, permeated with 0.3% Triton X-100, and then stained according to the instructions provided (RiboBio, Guangzhou, China).
Cell migration and invasion assays
Transwell assays were performed in 24-well cell culture plates with 8-μm micropore inserts to examine the ability of migration and invasion. To determine cell migration, the upper chamber was filled with a serum-free medium with 1×10⁵ cells, while the lower chamber was filled with a conditioned culture medium containing 30% FBS. To determine cell invasion, 2 × 10⁵ cells with a serum-free medium were seeded in the upper chamber with 50 μL of Matrigel, while the lower chamber was filled with the same conditioned culture medium. After incubation for 48 h, the invaded cells at the membranes were fixed with 4% paraformaldehyde and stained with 0.5% crystal violet solution.
Lentivirus transfection and stable cell line construction
FTO, APOE, FASN, and IGF2BPs knockdowns, as well as over-expression plasmids, were synthesized by Shanghai Genomeditech Biotech Co. Ltd. Lentivirus packaging was conducted in 293 T cells using PEIMAX treatment (Polysciences, USA). Following infection with concentrated virus and 5 μg/ml polybrene (Genomeditech) for 48 hours, stable transfected cells were selected through treatment with 5 μg/mL puromycin (Yeasen). Western blotting was performed to confirm the efficacy of transfection. Supplementary Table 2 provides a comprehensive list of all targeted shRNAs.
Assays of lipid metabolism
To quantify lipid droplets in cells, Nile red staining was performed. pNENs cells were transfected and seeded in 96-well plates. Once the cells reached 60-80% confluency, they were fixed in 4% paraformaldehyde for 15 minutes. Subsequently, the cells were incubated with Nile Red working fluid for 20 minutes, followed by staining with DAPI (Beyotime, Nantong, China) for 20 minutes at room temperature. Fluorescence intensity imaging of Nile Red and DAPI was acquired using fluorescence microscopy, and the fluorescence intensities were quantified using ImageJ software. The quantification of fatty acids (FAs) was performed using a CheKine™ Micro Free Fat Acid (FFA) Assay Kit (abbkine). Triglyceride and cholesterol contents were measured using EnzyChrom triglyceride and cholesterol kits (Bioassay Systems). All assays were conducted according to the manufacturer's instructions.
Quantitative real time-polymerase chain reaction (qRT-PCR) and RNA-seq
Total RNA was isolated from cells using the trizol reagent (Vazyme, Nanjing, China) according to the manufacturer's protocol and quantified with a Nanodrop 2000. 5 µg of RNA was reverse transcribed to cDNA with the PrimeScript RT Reagent Kit with gDNA Eraser (Yeasen, Shanghai, China). Subsequently, real-time PCR was conducted using ChamQ Universal SYBR qPCR Master Mix according to the manufacturer's instructions. RNA samples for RNA-seq were sequenced by Lianchuan Biotech (Hangzhou, China) and analyzed using the OmicStudio tools available at https://www.omicstudio.cn/tool. The primers used are detailed in Supplementary Table 1.
Protein extraction and western blot analysis
Total cellular proteins were lysed using cold NP40 lysis buffer (Beyotime, China) supplemented with protease inhibitors (Roche, Mannheim, Germany). The protein concentration was quantified using a BCA Protein Assay Kit (Beyotime, China). Subsequently, the samples were separated by 10% SDS-PAGE and transferred onto nitrocellulose membranes, which were then blocked with a blocking buffer. The nitrocellulose membranes were incubated with the appropriate primary antibody overnight, followed by incubation with peroxidase (HRP)-conjugated secondary antibodies for 1 hour. After three washes with TBST, the signals were detected using a chemiluminescence system (Bio-Rad, USA).
Immunofluorescence
Cells were cultured in Confocal dish overnight to achieve a confluency of 60% to 80%. Subsequently, the cells were washed three times with PBS and fixed with 4% paraformaldehyde for 15 minutes. Following that, the cells were incubated with 0.2% Triton X-100 for 15 minutes and blocked with 3% BSA for 60 minutes. After three washes with PBST, the cells were incubated overnight at 4 °C with primary antibodies. The cells were then washed three times with PBST and incubated at room temperature for one hour with secondary antibodies. After three washes with PBST, the cells were incubated with DAPI for 15minutes. The fluorescence intensity was visualized using fluorescence microscopy.
Quantification of global N6-methyladenosine levels
To assess the global level of RNA N6-methyladenosine (m6A), we employed the EpiQuik m6A RNA Methylation Kit (Epigentek, USA) in our study. Initially, total RNA was extracted from cells or tissues using TRIzol reagent. The RNA was then immobilized onto strip wells using the RNA high-binding solution. Subsequently, capture and detection antibodies were added sequentially to each well. Finally, the relative m6A level was determined by measuring the absorbance at a wavelength of 450 nm.
M6a dot assay
Total RNAs from different group were initially denatured by heating at 65 °C for 5 minutes and then transferred onto a nitrocellulose membrane using a Bio-Dot apparatus (Bio-Rad, USA). Subsequently, the membranes were UV cross-linked, blocked, incubated overnight at 4 °C with m6A antibody (Abcam, USA). Following this, the membranes were incubated with peroxidase (HRP)-conjugated secondary antibodies for 1 hour. After 3 washes with PBST, the signals were detected using a chemiluminescence system. To ensure consistency among different groups, a membrane stained with 0.02% methylene blue (MB) in 0.3 M sodium acetate (pH 5.2) was utilized.
Methylated RNA immunoprecipitation sequencing (MeRIP-seq)
The target gene was selected by MeRIP using the MeRIP m6A Kit (Merck Millipore) following the provider's requirements. Total RNA was extracted from FTO knockdown or empty vector QGP-1 cells using Seq-Star Poly(A) mRNA Isolation Kit. Next, the RNA was fragmented and incubated with m6A antibody to deposit APOE. After the concentration of m6A mRNA fragment and construction of the RNA-seq library for sequencing on the Illumina HiSeq 4000 platform, the abundance of FABP5 was tested by qRT-PCR and normalized to the input mRNAs.
Luciferase reporter assays
The wild-type (wt) and mutant (mut) 3′-UTR of APOE were constructed by RiboBio company (Guangzhou, China). Subsequently, different groups of cells were transfected with the luciferase constructs following the manufacturer's protocol. After 48 hours of transfection, luciferase activities were measured using a Dual-Luciferase Reporter Assay Kit (Promega). Each experiment was performed in triplicate.
RNA immunoprecipitation (RIP) assays
The Magna RIP Kit (17-700, Millipore, MA) was used to perform the RNA immunoprecipitation (RIP) assay according to the manufacturer's instructions. In brief, 5 μg of specific antibodies against IGF2BP2, N6-methyladenosine (m6A), and anti-rabbit IgG were incubated with 40 μL magnetic beads. Then, cell lysates containing approximately 2 × 10⁷ cells per sample were added to the antibody-bead mixture. The RNA-protein IP complexes were washed six times to remove any non-specific binding. The RNAs of interest were then extracted and purified from the immunoprecipitated complex for further analysis using quantitative reverse transcription PCR (qRT-PCR). The relative enrichment of the target RNAs was normalized using the input RNA as a control.
CO-IP assays
Briefly, beads were prewashed two times using 1× modified coupling buffer. Subsequently, they were incubated with 5 μg of the specified antibody for a duration of 15 min. Following this, the beads underwent washed three times using 1× modified coupling buffer, and the antibody was crosslinked using 1 ml of disuccinimidyl suberate solution for 30 min. The beads were then subjected to three washes using elution buffer, followed by two washes using IP lysis/wash buffer. The cell lysates were subsequently incubated with the beads for 8 h at 4 °C. On the following day, the beads were washed twice using 1 ml of IP lysis/wash buffer, and finally, a wash with ultrapure water was performed. The bound antigen was eluted and prepared for analysis via western blotting.
FISH assays
Fluorescence in situ hybridization (FISH) assays were conducted using the APOE FISH Probe Mix Kit (RiboBio, Guangzhou, China). In brief, cells were fixed using 4% paraformaldehyde and subsequently treated with proteinase K and permeabilization solution. Prior to hybridization, pre-hybridization was performed at a temperature of 37 °C for a duration of 30 minutes. Subsequently, cells were subjected to hybridization with the fluorescently labeled APOE probe at a temperature of 37 °C overnight. Nuclei were counterstained with DAPI and visualized using a confocal laser microscope.
Mouse xenograft model
A total of 5 × 10⁶ stably transfected QGP-1 cells were subcutaneously injected into the right axilla of female BALB/c nude mice (4-6 weeks old). After a period of 4-5 weeks, the mice were euthanized. Tumor formation and growth were monitored until the experimental endpoint, and tumor volume was calculated using the formula: (width)2 × length/2. The tumors were then either fixed in 4% paraformaldehyde or frozen for further analysis. All animal experiments conducted in this study were approved by the Institutional Animal Care and Use Committee (IACUC) of Nanjing Medical University.
Statistical analysis
Statistical analysis was conducted using GraphPad Prism 8.0 software (GraphPad, Inc., USA). Student's t-test and one-way ANOVA with Tukey's multiple comparisons was employed to compare different groups. All experiments were repeated independently for a minimum of three times, and the results were expressed as means ± standard deviation (SD). The significance of the results was indicated on the figures, with a P-value less than 0.05 (P < 0.05) considered as statistically significant.
Results
FTO is overexpressed in pancreatic neuroendocrine neoplasms
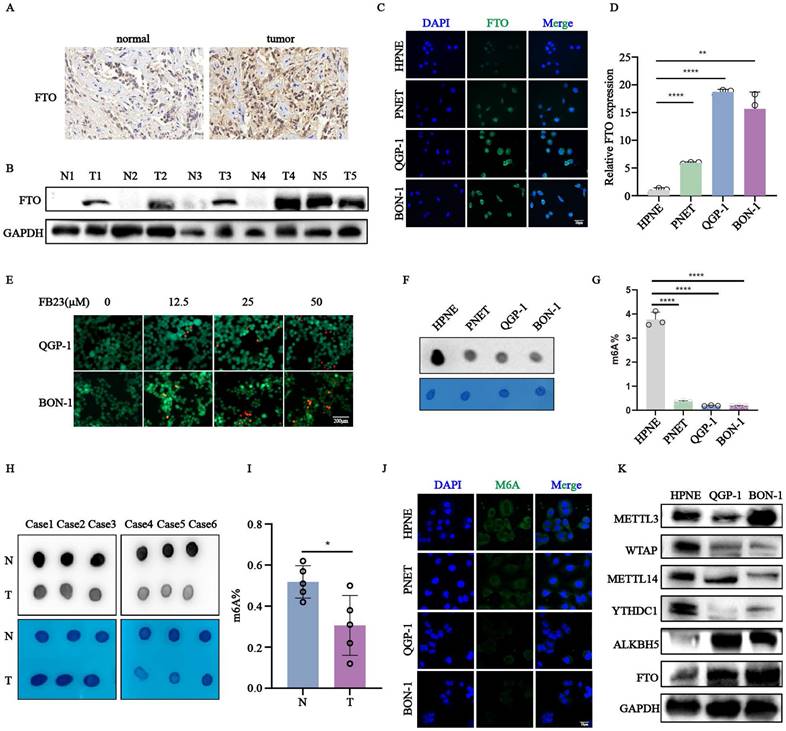
To investigate the role of FTO in pNENs, we first analyzed its expression in tumor and adjacent normal tissues using immunohistochemistry (Fig. 1A). FTO expression was elevated in most tumor samples compared to the corresponding normal adjacent tissues in five paired pNEN samples (Fig. 1B). Consistent with these tissue results, qRT-PCR and immunofluorescence assays showed elevated FTO mRNA and protein expression in pNENs cell lines (PNET, QGP-1, BON-1) compared to normal pancreatic cells (HPNE) (Fig. 1C-D). The treatment of pNENs cells with increasing concentrations(µM) of the FTO inhibitor FB23 resulted in a dose-dependent increase in cell mortality, indicating its anti-cancer effects (Fig. 1E, S1A-B). To determine whether the drug is targeted or toxic, we also treated with FB23 in HPNE cell, which began to exhibit toxic effects in HPNE cells at 100 µM (Fig. S1D). Additionally, global m6A levels were examined by m6A dots experiment in six pairs pNENs samples, revealing significantly lower m6A levels in tumors compared to normal pancreatic cells (Fig. 1H-I). Similar results were observed in pNENs cell lines compared to normal pancreatic cells (Fig. 1F-G,1J). We further elevated the protein expression of m6A regulators, including METTL3, WTAP, METTL14, and YTHDC1, ALKBH5, FTO, confirming the role of the m6A modification in pNENs progression (Fig. 1K). Moreover, the cell mortality was increased as the concentration(µM) of m6A nucleoside increased, indicating the an-cancer effect of m6A modification (Fig. S1C). In addition, we also excluded the influence the of drug toxicity which began to exhibit toxic effects in HPNE cells at 75 µM (Fig. S1D). Collectively, these results highlight the possible indispensable role of FTO-medicated m6A modification in pNENs development.
Increased expression of FTO was observed in pNENs. (A) Representative images of FTO immunohistochemistry staining in pNENs samples were shown. (B) The protein expression of FTO from five pairs of pNENs samples was indicated by western blots (N represents normal tissue, T represents tumor tissue). (C, D) The expression of FTO in pNENs cells (PNET, QGP-1, BON-1) compared to normal pancreatic cells HPNE verified by Immunofluorescence and qRT-PCR. (E) The cell mortality in different concentrations(µM) of cells treated with FTO inhibitor FB23 showed by Calcein AM/PI fluorescein staining. (F) M6A dot assays were performed to examine the amount of m6A in pNEN cells compared to normal pancreatic cells. (G) Global m6A levels in mRNA of pNENs cells and normal pancreatic cells were detected by an m6A quantification kit. (H) M6A dot assays in six pairs of pNENs samples were shown. (I) The percentage of m6A was examined in five pairs of pNENs samples. (J) The expression of m6A in pNENs cells compared to the normal pancreatic cell HPNE was verified by immunofluorescence. (K) The protein expression of m6A writers (METTL3, METTL14, WTAP), erasers (FTO, ALKBH5), and reader (YTHDC1) in pNENs cells (QGP-1, BON-1) compared to normal pancreatic cells HPNE was verified by western blots. *p < 0.01, **p < 0.01, ****p < 0.0001.
FTO knockdown inhibits the malignant behavior of pNENs
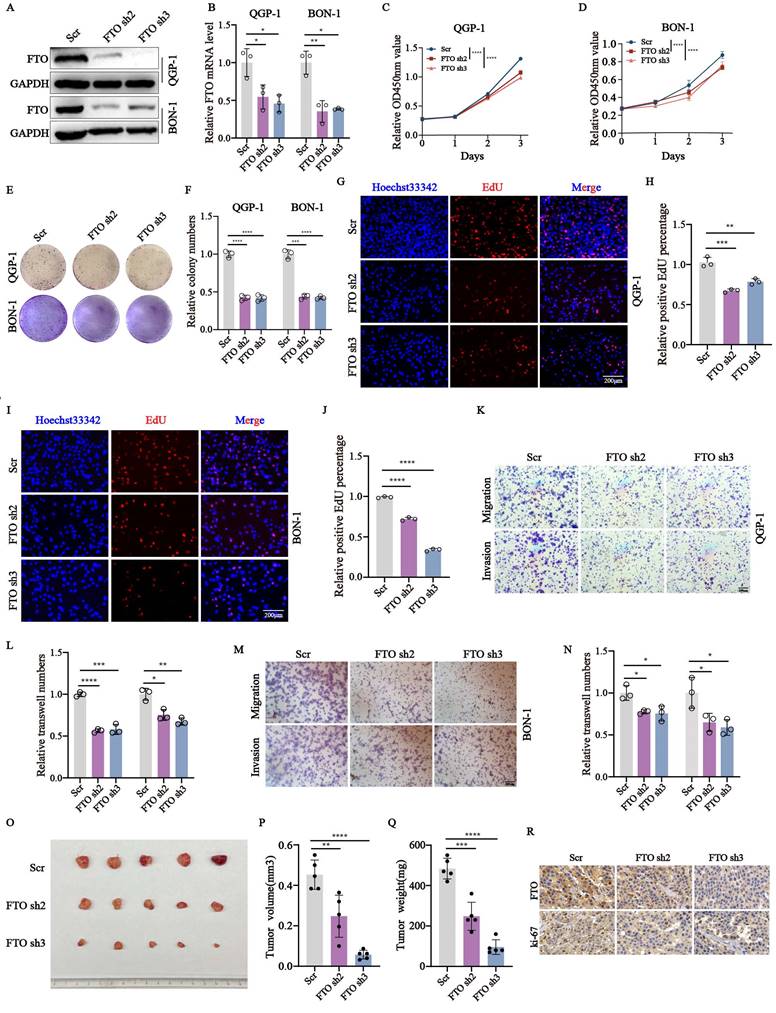
Since FTO has been demonstrated the crucial role plays in the malignant behavior of diverse cancers, we wondered whether FTO is involved in pNENs progression. To elucidate the biological role of FTO in pNENs, FTO knockdown stable cell lines were s. The efficiency of FTO knockdown was confirmed by q-RT-PCR and western blots (Fig. 2A-B). Next, we explored the proliferation rate of FTO knockdown in pNENs. CCK-8 and colony formation assays all indicated that the depletion of FTO markedly inhibited cell proliferation in pNENs cells (Fig. 2C-F). The result of the EdU assay also showed that FTO knockdown suppressed DNA replication activity in pNENs cells (Fig. 2G-J). Furthermore, transwell assays revealed that FTO knockdown inhibited migration and invasion in pNENs cells, as indicated by reduced staining of cells at the bottom of the chamber (Fig. 2K-N). Furthermore, we also established stable FTO overexpression cell lines, which exhibited notably up-regulated FTO mRNA and protein levels in QGP-1 and BON-1 cell lines (Fig. S2A-B). Conversely, ectopic FTO enhanced pNENs proliferation, as demonstrated by CCK8, colony formation, and EdU assay (Fig. S2C-H). Transwell assays also showed increased migration and invasion capacity in pNENs cells with FTO overexpression (Fig. S2I-L). To further investigate the role of FTO in pNENs progression in vivo, xenograft tumor experiments were performed by subcutaneously injecting QGP-1 cells into nude mice. The results indicated that FTO knockdown evidently inhibited pNENs growth, as evidenced by the reduced tumor volume, tumor weight, and immunohistochemical (IHC) staining of ki67 (Fig. 1O-R). Collectively, these data suggest that FTO knockdown inhibits pNENs progression.
FTO knockdown repressed the proliferation, migration, and invasion of pNENs in vitro and in vivo. (A, B) The efficiency of FTO knockdown in QGP-1 and BON-1 cells was verified by qRT-PCR and western blots (Scr represents scramble which means control group with disrupted RNA sequence; Oc represents overexpression control). (C, D) CCK-8 assays were performed to elevate the proliferation rate of cells with FTO knockdown. (E, F) Colony formation assays were conducted in FTO deficiency cells. (G-J) EdU assays were performed to elevate the replication ability in FTO deficiency cells. (K-N) Transwell assays were carried out to examine the effects of FTO knockdown on pNENs cell migration and invasion. (O) Subcutaneous xenograft tumors derived from QGP-1 cells with FTO knockdown and the control group. (P-Q) Tumor volume and tumor weight between FTO-deficient groups and scramble groups. (R) Representative IHC staining images of FTO and ki-67. *p < 0.01, **p < 0.01, ***p < 0.001, ****p < 0.0001.
FTO regulates lipid metabolism pathways
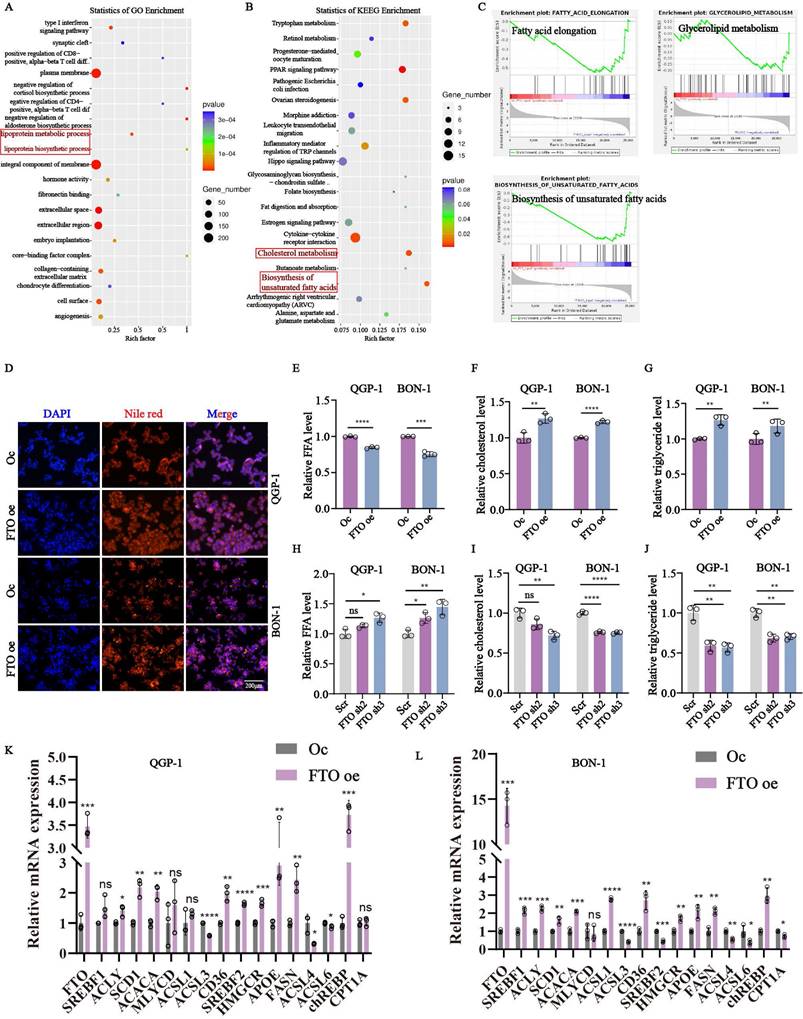
To better characterize how FTO promoted pNENs progression, RNA-seq was performed in FTO knockdown and control cells. Interestingly, two lipid metabolism-related pathways (lipoprotein metabolic process and lipoprotein biosynthetic process, cholesterol metabolism, and biosynthesis of unsaturated fatty acids) were all identified by GO enrichment and KEGG analysis respectively (Fig. 3A-B). As above, lipid metabolism has emerged as an important target for anti-tumor strategies, and its role in pNENs influenced by FTO remains unexplored. Therefore, we focused on unraveling the specific mechanism of FTO on lipid metabolism in pNENs. GSEA analysis revealed that FTO knockdown downregulated pathways involved in fatty acid elongation, biosynthesis of unsaturated fatty acids, and glycerolipid metabolism (Fig. 3C). To further explore the interrelationship between FTO and lipid metabolism, we performed a series of experiments about lipid metabolism. FTO overexpression increased lipid droplet accumulation and reduced free fatty acid content, indicative of enhanced lipid storage and lipolysis (Fig. 3D-E). Total cholesterol and triglyceride levels were also elevated in FTO-overexpressing cells, while FTO knockdown exerted the opposite effects (Fig. 3F-J). Moreover, abnormal lipid metabolism can result from enhanced lipid biosynthesis, decreased lipid catabolism, and increased fatty acid uptake. Further analysis revealed that FTO upregulated key lipid metabolism-related genes, including those involved in fatty acid synthesis (SREBF1, ACLY, SCD1, ACACA, MLYCD, ACSL1, ACSL3, ACLS4, ACSL6, FASN, chREBP), fatty acid uptake (CD36), fatty acid oxidation (CPT1A), cholesterol biosynthesis (SREBF2, HMGCR, APOE) (Fig. 3K,3L). It revealed the majority of molecules related to fatty acid synthesis, fatty acid uptake, and cholesterol biosynthesis are promoted by FTO. However, the molecules related to fatty acid oxidation seem not to be influenced by FTO. These findings underscore the pivotal role of FTO in lipid metabolism regulation in pNENs.
FTO knockdown impaired lipid metabolism of pNENs. Enrichment analysis of (A) GO and (B) KEGG signal pathways. (C) Individual GSEA plots of fatty acid elongation, glycerolipid metabolism, and biosynthesis of unsaturated acids pathway in RNA-seq data from QGP-1 cells with FTO knockdown. (D) LDs (lipid droplets), (E, H) FFA (free fatty acid), (F, I) cholesterol, and (G, J) triglyceride were examined in cells with FTO knockdown and FTO overexpression. (K, L) The relative mRNA expression of lipid-associated genes in cells with FTO overexpression. *p < 0.01, **p < 0.01, ***p < 0.001, ****p < 0.0001.
APOE has been identified as the target gene regulated by FTO
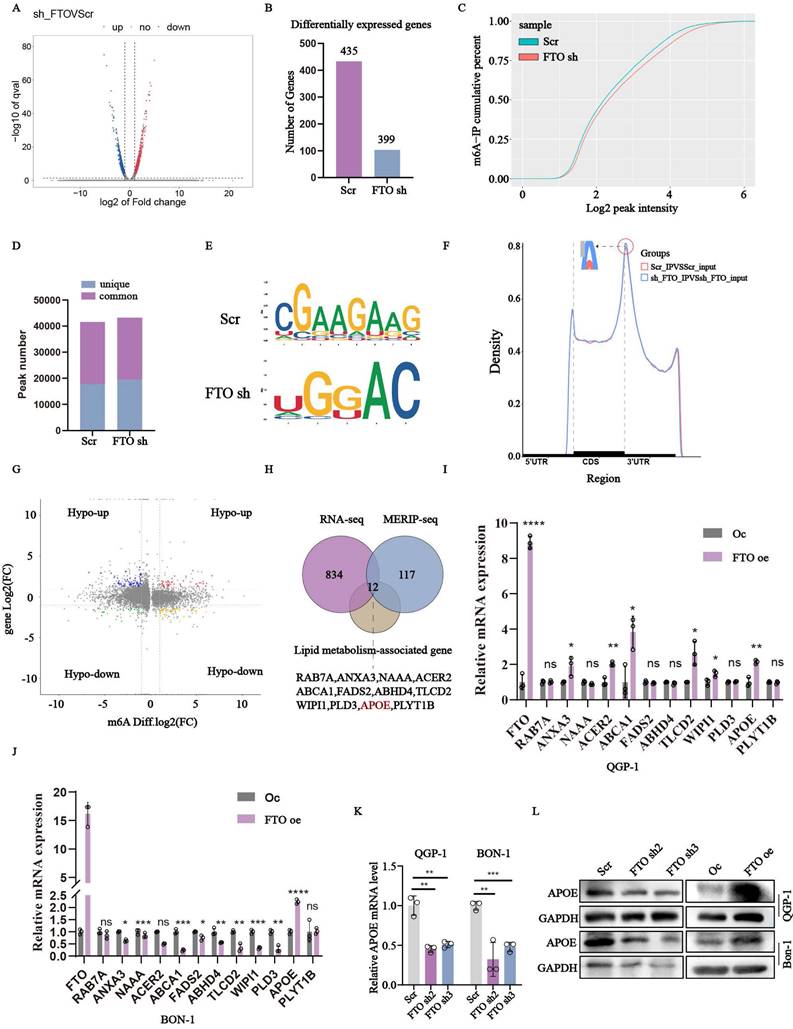
To further elucidate the precise mechanism of FTO in pNENs lipid metabolism, we employed an integrated approach combing transcriptome and epitranscriptome sequencing in stable FTO deficiency QGP-1 cells and corresponding control cells. Transcriptome sequencing revealed significant differences in 834 genes, with 435 genes up-regulated and 399 genes down-regulated, all with a P-value below 0.05 (Fig. 4A-B). The m6A saturation curve further indicated a lower m6A saturation rate in FTO deficient cells (Fig. 4C). MeRIP-seq analysis revealed 17837 unique m6A peaks in the control group, 19459 unique m6A peaks in the sh-FTO group, and 23754 shared m6A peaks in both groups (Fig. 4D). The “CGAAGAAG” and “UGGAC” sequence motif were verified to be highly enriched in m6A-immunoprecipitated RNAs of the control and FTO knockdown cells (Fig. 4E). Because FTO knockdown positively mediates m6A modification, we focused on the mRNA transcripts with these enhanced m6A peaks, which were found to be predominantly localized in the CDS and 3'UTR region (Fig. 4F). Subsequently, Methylated RNA immunoprecipitation (MeRIP) was combined with m6A-specific antibody followed by RNA sequencing to accurately identify downstream targets (Fig. 4G). By comparing the overlapping parts of RNA-seq and MERIP-seq between the control and FTO knockdown, we identified 393 genes with significant differences. Among these genes, we excluded 276 genes with down-regulated m6a levels that were inconsistent with high global m6A levels regulated by FTO knockdown. Ultimately, the remaining twelve genes involved in lipid metabolism were singled out, including RAB7A, ANXA3, NAAA, ACER2, ABCA1, FADS2, ABHD4, TLCD2, WIPI1, PLD3, APOE, PLYT1B (Fig. 4H). To validate these findings, we assessed the mRNA levels of these candidate genes. qRT-PCR analysis revealed that APOE exhibited the most significant alteration in FTO over-expression cells (Fig. 4I-J). Additionally, we confirmed the expression of APOE in FTO knockdown cell lines through qRT-PCR (Fig. 4K). Correspondingly, the protein expression of APOE was also altered in FTO knockdown and overexpression cells (Fig. 4L). Collectively, these results indicated that APOE may serve as a target gene regulated by FTO in the context of PNENs lipid metabolism.
APOE was screened as the important target gene of FTO. (A, B) The differentially expressed genes in FTO-deficient QGP-1 cells compared to the control groups from the results of RNA-seq. (C) The m6A-IP cumulative percent between FTO-deficient QGP-1 cells compared to the control groups shown by the m6A saturation curve from the results of MeRIP-sequencing. (D) The peak profiles in m6A modification in cells with FTO knockdown as shown by MeRIP-sequencing. (E) The most common m6A consensus motif in FTO-deficient groups and the control groups. (F) Distribution of m6A peaks in FTO-deficient groups and the control groups. (G) The volcano plot indicated the distribution of genes both differential (up or down) methylation level and differential (up or down) gene expression levels in FTO-deficient groups and the control groups. (H) Venn diagram showed overlap genes among the significant genes from RNA-seq, the up-regulated methylation levels genes from MeRIP-sequencing, and lipid-associated genes. (I, J) The mRNA expression of the overlap genes between FTO overexpression groups and the control groups. The (K) mRNA and (L) protein expression of APOE in cells with FTO knockdown and overexpression was examined by qRT-PCR and western blots. *p < 0.01, **p < 0.01, ***p < 0.001, ****p < 0.0001.
Overexpression of FTO regulates APOE mRNA expression via an m6A-IGF2BP2-dependent mechanism
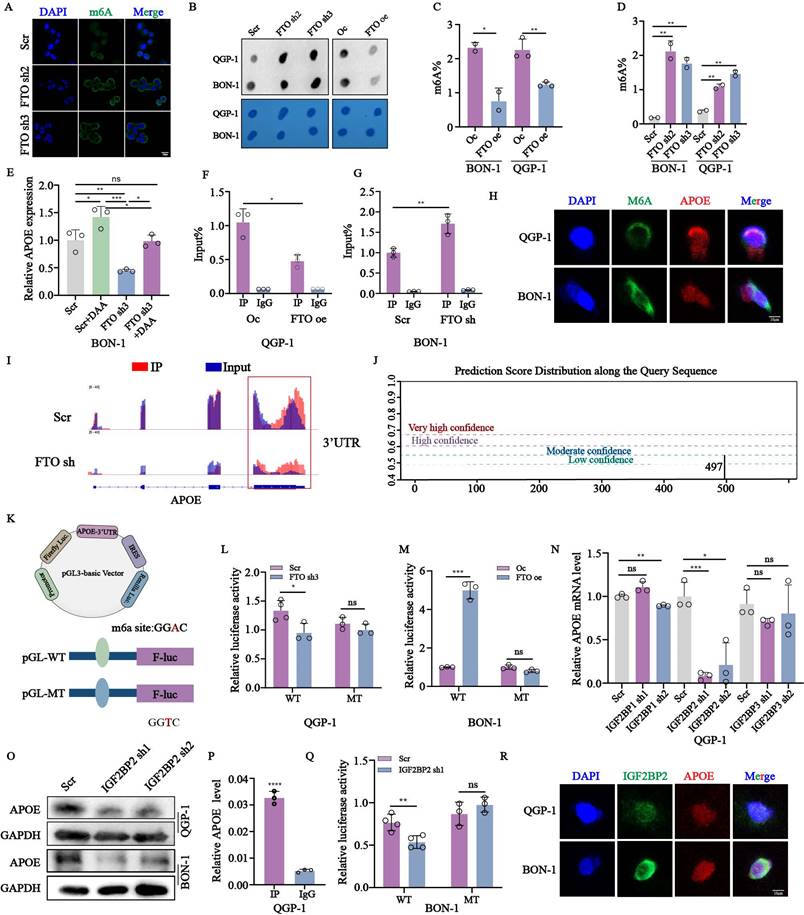
To further insight into the direct mechanism that FTO targets APOE mRNA and whether it depends on the m6A catalytic activity. We first assess the m6A levels in FTO-deficient cells using immunofluorescence (Fig. 5A). M6A dot-blot assays and RNA methylation quantification confirmed increased m6A levels in FTO-deficient cells and reduced levels in FTO-overexpressing cells (Fig. 5B-D). Treatment with the global methylation inhibitor 3-deazaadenosine (DAA) further indicated an inverse relationship between m6A levels and APOE expression (Fig. 5E). RIP assays demonstrated reduced interactions between m6A and APOE in FTO-overexpression cells, with the opposite observed in FTO-deficient cells (Fig. 5F-G). FISH/IF assays indicated cytoplasmic localization of the m6A-APOE combination (Fig. 5H). Using IGV analysis and the SRAMP server, we identified an m6A peak in the APOE 3ʹ untranslated region (UTR) near the stop codon, characterized by a conserved RRACH motif (Fig. 5I-J). To validate this finding, we mutated the GGAC motif to GGTC motif in APOE mRNA. Subsequently, we accurately mapped the location of the m6A peak across the human RNA transcriptome to construct luciferase reporter gene plasmids. The wild-type or mutated 3'-UTR of APOE was inserted downstream of the CDS region of the luciferase to assess the biofunction of m6A peaks. Both plasmids contained the Renilla luciferase (R-luc) gene as an internal reference (Fig. 5K). The results of the dual-luciferase reporter gene assay demonstrated a significant decrease in fluorescence after transfection of nonmutant plasmids in the FTO knockdown QGP-1 cells. Furthermore, there was no significant difference after transfection of mutant plasmids in the FTO knockdown cells (Fig. 5L). Conversely, opposite results were observed in BON-1 cells with FTO overexpression (Fig. 5M). To further explore the impact of m6A readers involved in the FTO-regulated m6A modification on APOE, we employed soft prediction to identify the protein IGF2BPs family. IGF2BP2 was identified as the m6A reader regulating APOE. Knockdown of IGF2BP2 significantly reduced APOE mRNA and protein expression (Fig. 5N-O). RIP and luciferase assays confirmed the interaction between IGF2BP2 and APOE mRNA (Fig. 5P-Q). Collectively, these findings demonstrate that FTO and IGF2BP2 regulate APOE in an m6A-dependent manner.
The expression of APOE was regulated by FTO in an m6A-IGF2BP2 manner. (A)The expression of m6A in QGP-1 cells with FTO knockdown verified by immunofluorescence. (B) M6A dot assays were performed to assay the expression of m6A in FTO knockdown and overexpression cells. (C, D) The amounts of m6A were detected in FTO knockdown and overexpression cells. (E) The relative mRNA expression of APOE in QGP-1 cells treated with DAA. (F, G) RIP assays between m6A and APOE were performed in cells with FTO knockdown and overexpression. (H) FISH/IF assay showed co-localization of APOE mRNA and m6A proteins in the cytoplasm of pNENs cells. (I) The relative abundance of m6A sites along APOE mRNA in QGP-1 cells between FTO-deficient groups and the control groups from the results of MeRIP-seq. (J) The m6A modification sites in mRNA APOE were predicted by the website http://www.cuilab.cn. (K-M) The indicated wild-type (WT) and mutant-type (MUT) of pGL3-based luciferase reporter plasmids were used to examine the transcriptional activity of the APOE gene promoter affected by the m6A. We mutated base sequences of APOE from GGAC to GGTC. The firefly luciferase activity of APOE promoter was detected in QGP-1 cells with FTO knockdown and BON-1 cells with FTO overexpression. (N) The mRNA expression of APOE in QGP-1 cells with IGF2BP1 knockdown, IGF2BP2 knockdown, and IGF2BP3 knockdown was verified by qRT-PCR. (O) The protein expression of the APOE in cells with IGF2BP2 knockdown. (P) RIP assay performed between IGF2BP2 protein and APOE mRNA in QGP-1 cells. (Q) The firefly luciferase activity of APOE promoter was detected in QGP-1 cells with IGF2BP2 knockdown. (R) FISH/IF assay showed co-localization of APOE mRNA and IGF2BP2 protein in the cytoplasm of pNENs cells. *p < 0.01, **p < 0.01, ***p < 0.001, ****p < 0.0001.
APOE restores the malignant behaviors of FTO in pNENs in vitro and in vivo
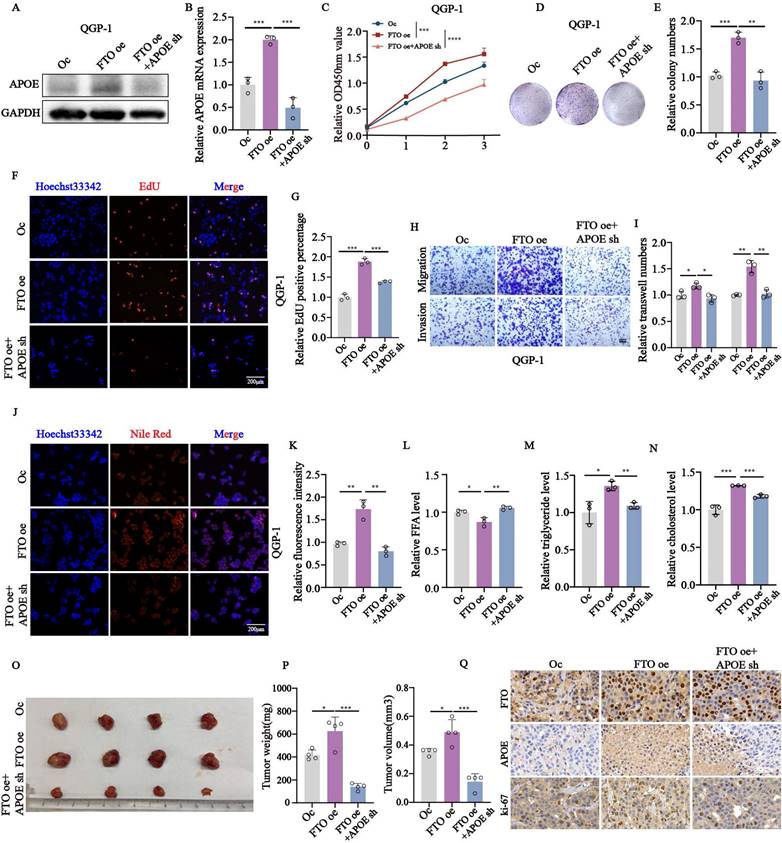
To evaluate the role of APOE in FTO-mediated tumorigenesis, we performed rescue assays in vitro and in vivo in FTO overexpression cell lines with or without APOE knockdown. Initially, we constructed the stable FTO overexpression with APOE knockdown cell lines using lentivirus verified by qPCR and western blots (Fig. 6A-B). APOE knockdown in FTO-overexpressing cells partially rescued proliferation and colony formation (Fig. 6C-E), as well as DNA replication (Fig. 6F-G). Knockdown of APOE also reversed FTO-induced migration and invasion capabilities (Fig. 6H-I). We also examined changes in the related index of lipid metabolism in FTO overexpression cells with or without APOE knockdown. The results showed that the knockdown of APOE reversed the accumulation of lipid droplets, as well as the levels of free fatty acids, triglycerides, and cholesterol influenced by FTO overexpression (Fig. 6J-N). Moreover, consistent with the in vitro results, APOE knockdown obviously weakened the tumor growth promoted by FTO overexpression, as reflected by tumor weight and tumor volume (Fig. 6O-P). Immunohistochemical staining of APOE and ki-67 in QGP-1 cells with FTO overexpression also showed rescue effects by APOE knockdown (Fig. 6Q). These findings suggest that APOE plays an important role in proliferation mediated by FTO in vitro and in vivo.
APOE knockdown partly reversed the effects of FTO overexpression on the proliferation and lipid metabolism of pNENs cells. (A, B) The mRNA and protein expression of APOE in the FTO overexpression cells with APOE knockdown. (C) CCK-8, (D, E) colony formation, and (F, G) EdU assay showed enhanced proliferation ability in QGP-1 cells with FTO overexpression was impaired by APOE knockdown. (H, I) Transwell assay indicated that APOE knockdown restored the ability of migration and invasion of FTO overexpression on QGP-1 cells. (J, K) Nile red assay showed that APOE knockdown reversed the formation of lipid droplets in cells with FTO overexpression. The relative levels of (L) FFA, (M) triglyceride, (N) cholesterol in FTO overexpression cells with APOE knockdown. (O-P) Representative images, tumor volume, and tumor weight of xenografts in the three groups. (Q) IHC staining of FTO, APOE, and ki-67 was performed in the xenografts of three groups. *p < 0.01, **p < 0.01, ***p < 0.001, ****p < 0.0001.
APOE knockdown impairs the proliferation, migration, invasion, and lipid metabolism of pNENs cells
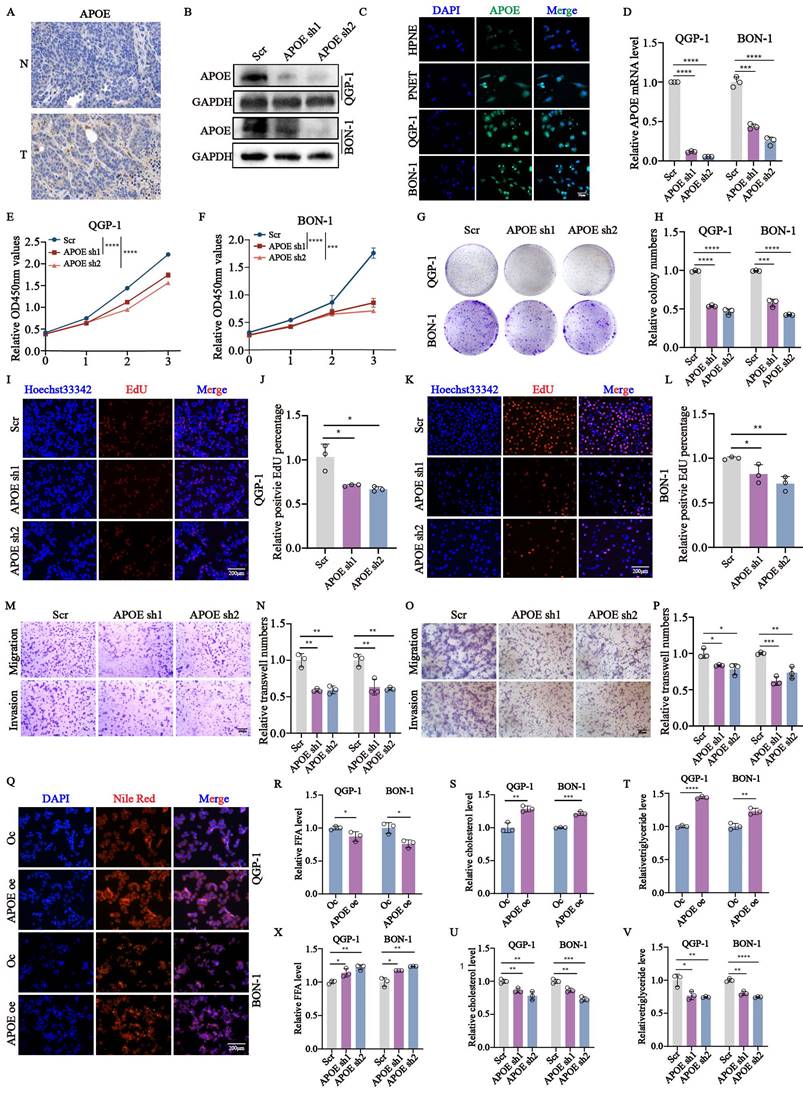
To further investigate the biological functions of APOE in pNENs, we first examined the high expression of APOE in tumor tissues compared to normal tissues by using immunohistochemistry (Fig. 7A). The high expression of APOE was also found in pNENs cells (Fig. 7C). Furthermore, we also validated the mRNA and protein expression of APOE in cells with APOE knockdown (Fig. 7B,7D). Knockdown of APOE significantly reduced proliferation, as demonstrated by CCK-8, colony formation, and EdU assays (Fig. 7E-L). Transwell assays showed that APOE knockdown impaired migration and invasion (Fig. 7M-P). Moreover, we examined changes in the related index of lipid metabolism. The results showed that increased APOE expression led to higher total lipid droplet levels and lower free fatty acid levels (Fig. 7Q-R). The amounts of total cholesterol and triglycerides were also increased in cells with APOE overexpression (Fig. 7S-T). On the contrary, knockdown of APOE also had the opposite effects on pNENs in terms of the amount of free fatty acid, total cholesterol, and triglycerides (Fig. 7X-V). These results highlight APOE's pivotal role in pNEN progression.
APOE knockdown inhibited the proliferation, migration, invasion, and lipid metabolism in pNENs. (A) Representative images of APOE immunohistochemistry staining in pNENs samples were shown. (B) The efficiency of APOE knockdown in pNENs cells was shown by western blots. (C) The expression of APOE in normal pancreatic cell line HPNE and pNENs cell lines PENT, QGP-1, and BON-1 was detected by immunofluorescent imaging. (D) The efficiency of APOE knockdown in pNENs cells was shown by qRT-PCR. The (E, F) CCK-8, (G, H) colony formation, (I-L) EdU assays were used to examine the proliferation ability of cells with APOE knockdown. (M-P) Transwell assays were applied to evaluate the ability of migration and invasion in APOE deficiency cells. (Q) LDs (lipid droplets), (R, X) FFA (free fatty acid), (S, U) total cholesterol, and (T, V) triglyceride were examined in cells with APOE overexpression and knockdown. *p < 0.01, **p < 0.01, ***p < 0.001, ****p < 0.0001.
APOE protects FASN from the ubiquitin-proteasome degradation
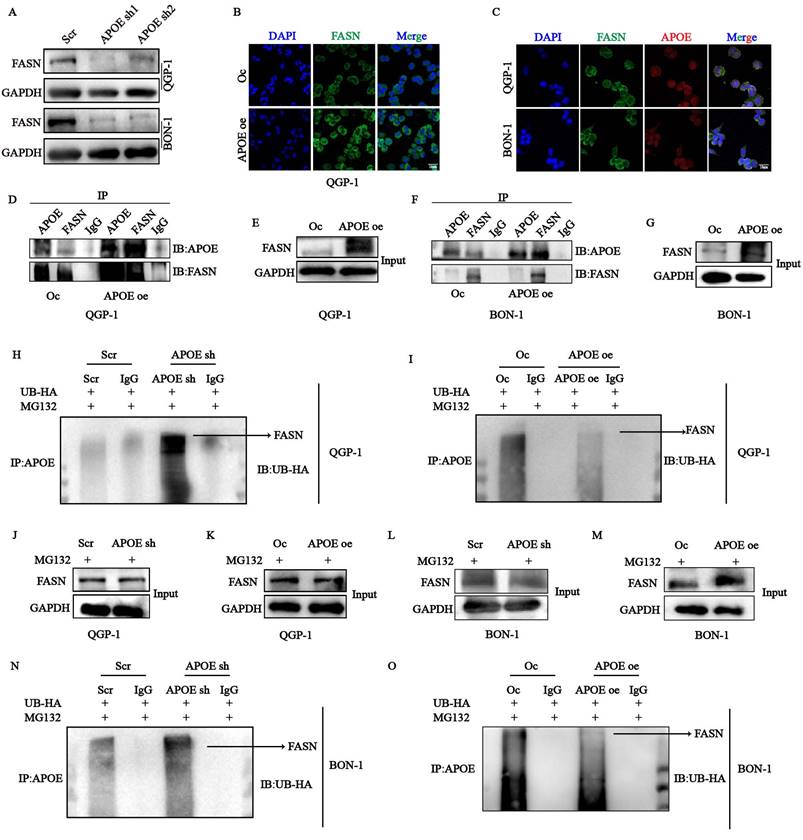
To investigate the underlying regulatory mechanism of APOE in lipid metabolism, we performed mass spectrometry (MS) analysis to identify novel APOE-interacting proteins in QGP-1 cells with APOE overexpression. Among the crucial proteins involved in lipid metabolism, the existence of FASN caught our attention. We first confirmed the decreased protein expression of FASN in cells with APOE knockdown (Fig. 8A). The expression of FASN was also increased in cells with APOE overexpression verified by immunofluorescence (Fig. 8B). We further confirmed the interaction between APOE and FASN through confocal analysis, which showed colocalization of APOE and FASN in the cytoplasm of QGP-1 and BON-1 cells (Fig. 8C). CO-IP assay further demonstrated increased binding between APOE and FASN in cells with APOE overexpression compared to the control cells (Fig. 8D-G). To further elucidate the specific mechanism between APOE and FASN, the protein stability of FASN was examined in cells with APOE overexpression and knockdown. we first conjectured that FASN was regulated by the ubiquitin-proteasome system in the post-translational level. To further examine the ubiquitin-medicated regulation of APOE on FASN, we performed ubiquitination CO-IP. The results suggested that the ubiquitination level of FASN in cells with APOE knockdown increased compared with the level in control cells (Fig. 8H,8J,8N,8L), whereas the ubiquitination level of FASN in cells with APOE overexpression indicated the opposite results (Fig. 8I,8K,8O,8M). The overall data suggest that FASN is an APOE-interacting protein responsible for the regulation of FASN proteostasis.
The stability of FASN was regulated by APOE in a ubiquitination-dependent way. (A) The protein expression of FASN in APOE-deficient cells was verified by western blots. (B) The expression of FASN in cells with APOE overexpression was verified by immunofluorescence (IF). (C) Immunofluorescence assay showed co-localization of APOE and FASN proteins in the cytoplasm of pNENs cells. (D-G) CO-IP assays between APOE and FASN protein were performed in cells with APOE overexpression. (H-K) QGP-1 cells with (H, J) APOE knockdown and (I, K) overexpression were transfected with UB-HA and then treated with MG132 (20µM) for 6h. Cell lysates were co-incubated with APOE and immunoblotting with the indicated antibodies. (L-O) BON-1 cells with (L, N) APOE knockdown and (M, O) overexpression were transfected with UB-HA and then treated with MG132 (20µM) for 6h. Cell lysates were co-incubated with APOE and immunoblotting with the indicated antibodies. *p < 0.01, **p < 0.01, ***p < 0.001, ****p < 0.0001.
FB23 demonstrated anti-tumoral activity alone and in combination with everolimus in pNENs
To investigate the specific signal pathway involved in the development of pNENs. we singled out the PI3K/AKT/mTOR signal pathway for the results of KEGG analysis (Fig. S3A) and the application of the common drugs on pNENs, everolimus, a mTOR inhibitor.
The results of western blots revealed that the crucial proteins involved in the mTOR signal pathway, PI3K, P-AKT, and P-mTOR were all upregulated in cells with FTO overexpression while knockdown of FTO had the opposite results (Fig. 9A-B). In addition, these enhancements could be rescued by APOE knockdown in cells with forced expression of FTO (Fig. 9C). The increase of these crucial proteins by APOE overexpression could also be reversed by FASN knockdown in cells with APOE overexpression (Fig. 9D). Moreover, we also further explore the influence of m6A modification on the PI3K/Akt/mTOR signaling pathway, using methylation inhibitor DAA. It indicated that the existence of DAA could partly rescue the inhibiting effect of FTO knockdown on the signaling pathway (Fig. 9E).
Evaluation of antitumoral activities of FB23-Everolimus combination in pNENs. (A, B) The related protein expression of PI3K/Akt/mTOR signaling pathway was performed by western blotting in pNENs cells with FTO knockdown and overexpression. (C) The related protein expression of PI3K/Akt/mTOR signaling pathway was performed by western blotting in FTO overexpression cells with or without APOE knockdown. (D) The related protein expression of PI3K/Akt/mTOR signaling pathway was performed by western blotting in APOE overexpression cells with or without FASN knockdown. (E) The related protein expression of PI3K/Akt/mTOR signaling pathway was performed by western blotting in FTO deficiency cells treated with DAA. (F) Lipid droplets were detected using Nile red in FTO overexpression QGP-1 cells treated with everolimus. (G, H) Lipid droplets were detected using Nile red in QGP-1 cells from the indicated groups. (I-N) The cellular content of free fatty acids (FFA), triglycerides, and total cholesterol were detected in QGP-1 cells from the indicated groups. (O-P) The results of EdU were conducted in cells from the indicated groups. (Q-R) Calcein AM/PI fluorescein staining was conducted in cells from the indicated groups. (S-T) Transwell assays were conducted in cells from the indicated groups. (U-Z) The cellular content of free fatty acids (FFA), triglycerides, and total cholesterol was detected in cells from the indicated groups. *p < 0.01, **p < 0.01, ***p < 0.001, ****p < 0.0001.
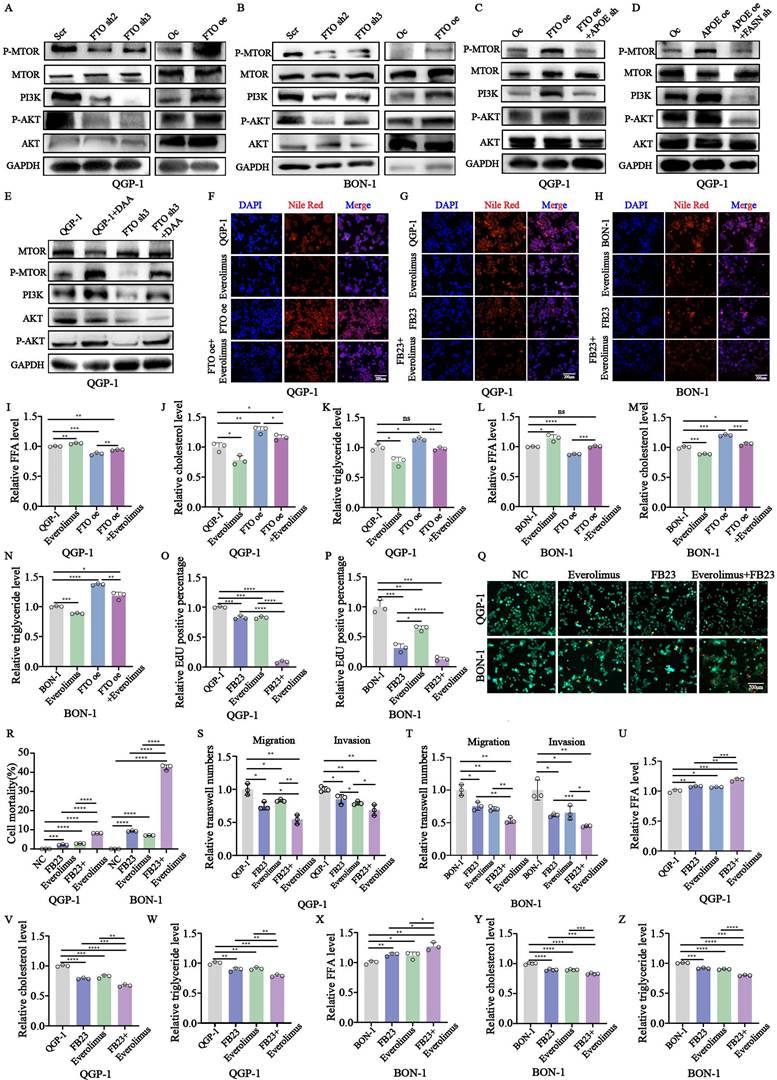
To further explore the interaction between FTO and lipid metabolism, the related index of lipid metabolism was also examined. The results showed that altered amounts of lipid droplets, cholesterols, and triglycerides could be rescued by the treatment of everolimus in cells with FTO overexpression (Fig. 9F,9I-N). Additionally, a significant decrease in cell proliferation, migration was induced by the combination compared to their respective FB23 and everolimus, showed by calcein AM/PI fluorescein staining, CCK-8, EdU assays, and transwell assays (Fig. 9Q-T; S3B-G).
However, we found the invasion of tumor do not indicate a significant change after the combination treatment (Fig. 9S-T; S3F-G). Moreover, the combination induced a more profound inhibitory effect of lipid metabolism than the respective FB23 and Everolimus (Fig. 9G-H, U-Z). Taken together, we found the PI3K/Akt/mTOR signaling pathway plays a crucial role in the development of pNENs and a combination between FB23 and everolimus led to more inhibition for the malignant role of pNENs which may provide an alternative therapeutic schedule for pNENs clinical therapeutics.
Discussion
According to the previous study, low levels of m6A expression, associated with highly malignant behavior, have been observed in pNENs [25]. In our study, we identified FTO as a highly upregulated m6A regulator in pNENs, suggesting its involvement in deregulated m6A modification driving oncogenic signaling. Notably, FTO exhibits carcinogenic effects by enhancing tumor proliferation, migration, and invasion during pNENs development. However, the role of m6A modification in cancer biology appears complex and contradictory. For instance, while FTO acts as an oncogene in pNENs, studies have demonstrated its anti-cancer role in other cancers. Silencing FTO inhibits cancer growth, cell motility, and invasion in hepatocellular carcinoma [26]. Similarly, FTO overexpression enhanced chemoresistance in colorectal cancer by modulating SIVA1-mediated apoptosis [27]. Beyond FTO, other m6A regulators, such as “writers”, also exhibit dual roles in cancer. For example, METTL3 promotes tumor progression in colorectal and gastric cancers [28,29]. Conversely, WTAP inhibits triple-negative breast cancer metastasis by downregulating COL3A1 in an m6A-dependent manner [30]. These discrepancies may stem from the heterogeneity of cell tissue samples, the distinct roles of m6A-related proteins, the different types of target genes (pro-cancer or anti-cancer), and other contributing factors [31]. Regarding pNENs, the roles of m6A writers and readers remain largely unexplored. Further investigation into the complex interplay of these regulators is essential to fully understand the significance of m6A modifications in pNENs pathogenesis.
The metabolic adaptations of cancer cells, which enable uncontrolled proliferation, are critical in tumor development. Therefore, it is crucial to unravel the intricate metabolic adaptations that occur when cancer cells undergo this switch. Such understanding may pave the way for identifying pharmacological targets and potential diagnostic or prognostic biomarkers. For lipid metabolism, it is associated with many kinds of organ dysfunction and disease development, particularly in cancer cells. In the present study, we have discovered the presence of altered lipid metabolism, regulated by m6A modification, during the development of pNENs, corroborating previous findings [25]. Moreover, mounting evidence suggests that modulating cell lipid metabolism could be an effective strategy for inhibiting cell proliferation in various cancers. For instance, CDKN2A deletion remodeled lipid metabolism in the development of prime glioblastoma [32]. The NFYAv1-lipogenesis axis exerted tumor-promoting effects, indicating that lipid metabolism may be a potential therapeutic target for triple-negative breast cancer [33]. In hepatocellular carcinoma, SREBP1c increased free fatty acids and promoted cell proliferation [34]. Apart from lipid metabolism, other types of metabolic changes also play an indispensable role in tumors. For glycolysis in cancers, targeting ACYP1-mediated glycolysis could reverse lenvatinib resistance and restrict hepatocellular carcinoma progression [35]. In glioblastoma, the mutation of GLUT1 Cys207 to serine impaired glycolysis and cell proliferation [36]. For amino acid metabolism in cancers, the transcription factor ATF3 regulated serine and nucleotide metabolism to maintain cell cycling, survival, and the blockade of differentiation in acute myeloid leukemia [37]. Phosphoglycerate dehydrogenase (PHGDH), the first rate-limiting enzyme of serine synthesis, was overexpressed and associated with the development of cancers [38]. However, the role of these metabolic adaptations in pNENs still requires further exploration.
In most recent studies, APOE was regarded as a cancer-promoting factor. For example, APOE is elevated in prostate cancers and correlates with a poor prognosis [39]. Conversely, APOE assumes an immunosuppressive role in the pancreatic cancer microenvironment by upregulating the expression of CXCL1 and CXCL5 [40]. A similar immune suppression role of APOE, through binding the LRP8 receptor on MDSCs, was also observed in melanoma [41]. Furthermore, APOE could also lead to the abnormal cell proliferation of ovarian cancer by inhibiting cell cycle arrest and apoptosis [42]. In our study, we found APOE could regulate lipid metabolism to further influence the pNENs progression. We revealed that the expression of APOE was dependent on an FTO-IGF2BP2 manner. However, the specific underlying mechanisms of m6A-modified APOE in pNENs, such as RNA stability, nuclear export, and precursor RNA splicing, remain largely unknown. Moreover, to gain further insight into the specific underlying mechanism of APOE in lipid metabolism, we found that APOE enhanced lipid metabolism by regulating the ubiquitination-mediated expression of FASN in pNENs. However, the specific regulatory mechanism of FASN ubiquitination regulated by APOE has not been elucidated.
APOE, a secreted protein, has traditionally been recognized for its role in regulating lipid metabolism. However, its emerging significance in shaping tumor microenvironment has drawn increasing attention in recent years. Many studies have highlighted how APOE influences immune cell behavior and tumor-immune interactions, suggesting that it plays a critical role in modulating the immune microenvironment. This newfound understanding is reshaping perspectives on APOE, not only as a regulator of metabolic processes but also as a key player in tumor immunology. For instance, prostate tumor cells secrete APOE, which binds to TREM2 on neutrophils to promote their senescence [39]. LXR/APOE activation therapy has been explored as a potential target to enhance cancer immunotherapy by modulating innate immune suppression [41]. Furthermore, APOE has also been identified as a prognostic biomarker correlated with immune infiltration in papillary thyroid carcinoma [43]. Although APOE plays an essential role in the immune microenvironment of various tumors, its contribution to immune regulation in pNENs remains largely unexplored and warrants further investigation.
In summary, we reveal that overexpressed FTO is responsible for increased expression of APOE in an m6A-dependent manner, thereafter aggravating lipid accumulation by inhibiting the ubiquitination degradation of FASN, which further promotes the malignant progression of pNENs. Our study demonstrates a novel regulating mechanism for lipid metabolism via epitranscriptomics, which provides an alternative elucidation for pNENs pathogenesis.
Abbreviations
pNENs: pancreatic neuroendocrine neoplasms; m6A: N6-methyladenosine; FTO: Fat-mass and obesity-associated protein; ALKBH5: AlkB homolog 5; METTL3: Methyltransferase-like 3; METTL14: Methyltransferase-like 14; WTAP: Wilms tumor 1 associated protein; IGF2BP: Insulin-like growth factor 2 mRNA-binding proteins; MeRIP: Methylated RNA immunoprecipitation; RIP: RNA Immunoprecipitation; DAA: 3-Deazaadenosine; CCK8: Cell counting kit-8; EdU: 5-Ethynyl-2'-deoxyuridine; qRT-PCR: Quantitative real-time polymerase chain reaction; KEGG: Kyoto Encyclopedia of Genes and Genomes; GO: Gene ontology; IHC: Immunohistochemistry; GAPDH: Glyceraldehyde-3-phosphate dehydrogenase.
Supplementary Material
Supplementary figures and tables.
Acknowledgements
Funding
This work was supported by the Science Foundation Project of Ili & Jiangsu Joint Institute of Health (Grant No. yl2020lhms05), the New Clinical TreatmentTechnology Research Fund BE2019753 (ZC19), China postdoctoral Science Foundation project (Grant No:2023M731414), and National Natural Science Foundation of China (no.82373180 and 82303453).
Availability of data and materials
The datasets used in current study are available from the corresponding author on reasonable request.
Ethics approval and consent to participate
The animal study was approved by the Institutional Animal Care and Use Committee (IACUC) of Nanjing Medical University.
Author contributions
QT, YT, JB, YW, JC designed the study; JC, MY, DG, PY performed experiments and collected all data; LX, BX, LY, FL, CH, YX, XS, LC analyzed and dealt with the data; JC, MY contributed to writing and figures making. QT, YT, JB, YW involved in critical reviewing of the manuscript. All authors read and approved the manuscript.
Competing Interests
The authors have declared that no competing interest exists.
References
1. Ma ZY, Gong YF, Zhuang HK, Zhou ZX, Huang SZ, Zou YP. et al. Pancreatic neuroendocrine tumors: A review of serum biomarkers, staging, and management. World J Gastroenterol. 2020May21;26:2305-22
2. Ito T, Sasano H, Tanaka M, Osamura RY, Sasaki I, Kimura W. et al. Epidemiological study of gastroenteropancreatic neuroendocrine tumors in Japan. J Gastroenterol. 2010Feb;45:234-43
3. Tai WM, Tan SH, Tan DMY, Loke KSH, Ng DCE, Yan SX. et al. Clinicopathologic Characteristics and Survival of Patients with Gastroenteropancreatic Neuroendocrine Neoplasm in a Multi-Ethnic Asian Institution. Neuroendocrinology. 2019;108:265-77
4. Gordon-Dseagu VL, Devesa SS, Goggins M, Stolzenberg-Solomon R. Pancreatic cancer incidence trends: evidence from the Surveillance, Epidemiology and End Results (SEER) population-based data. Int J Epidemiol. 2018Apr1;47:427-39
5. Tsilimigras DI, Pawlik TM. Pancreatic neuroendocrine tumours: conservative versus surgical management. Br J Surg. 2021Nov11;108:1267-9
6. Genç CG, Jilesen APJ, Nieveen van Dijkum EJM, Klümpen HJ, van Eijck CHJ, Drozdov I. et al. Measurement of circulating transcript levels (NETest) to detect disease recurrence and improve follow-up after curative surgical resection of well-differentiated pancreatic neuroendocrine tumors. J Surg Oncol. 2018Jul;118:37-48
7. Ferrone CR, Tang LH, Tomlinson J, Gonen M, Hochwald SN, Brennan MF. et al. Determining prognosis in patients with pancreatic endocrine neoplasms: can the WHO classification system be simplified? J Clin Oncol. 2007Dec10;25:5609-15
8. Masui T, Sato A, Nakano K, Uchida Y, Yogo A, Anazawa T. et al. Comparison of Recurrence Between Pancreatic and Duodenal Neuroendocrine Neoplasms After Curative Resection: A Single-Institution Analysis. Ann Surg Oncol. 2018Feb;25:528-34
9. Scott AT, Howe JR. Evaluation and Management of Neuroendocrine Tumors of the Pancreas. Surg Clin North Am. 2019Aug;99:793-814
10. Possemato R, Marks KM, Shaul YD, Pacold ME, Kim D, Birsoy K. et al. Functional genomics reveal that the serine synthesis pathway is essential in breast cancer. Nature. 2011Aug18;476:346-50
11. Faubert B, Solmonson A, DeBerardinis RJ. Metabolic reprogramming and cancer progression. Science. 2020Apr10;368:eaaw5473
12. Schulze A, Harris AL. How cancer metabolism is tuned for proliferation and vulnerable to disruption. Nature. 2012Nov15;491:364-73
13. Sun L, Zhang H, Gao P. Metabolic reprogramming and epigenetic modifications on the path to cancer. Protein Cell. 2022Dec;13:877-919
14. Chen XY, Zhang J, Zhu JS. The role of m6A RNA methylation in human cancer. Mol Cancer. 2019Dec;18:103
15. Zhou B, Bie F, Zang R, Zhang M, Song P, Liu L. et al. RNA modification writer expression profiles predict clinical outcomes and guide neoadjuvant immunotherapy in non-small cell lung cancer. EBioMedicine. 2022Oct;84:104268
16. Relier S, Rivals E, David A. The multifaceted functions of the Fat mass and Obesity-associated protein (FTO) in normal and cancer cells. RNA Biol. 2022;19:132-42
17. Zheng G, Dahl JA, Niu Y, Fedorcsak P, Huang CM, Li CJ. et al. ALKBH5 Is a Mammalian RNA Demethylase that Impacts RNA Metabolism and Mouse Fertility. Molecular Cell. 2013Jan;49:18-29
18. Dixit D, Prager BC, Gimple RC, Poh HX, Wang Y, Wu Q. et al. The RNA m6A Reader YTHDF2 Maintains Oncogene Expression and Is a Targetable Dependency in Glioblastoma Stem Cells. Cancer Discov. 2021Feb;11:480-99
19. Widagdo J, Anggono V, Wong JJL. The multifaceted effects of YTHDC1-mediated nuclear m6A recognition. Trends Genet. 2022Apr;38:325-32
20. Sun CY, Cao D, Du BB, Chen CW, Liu D. The role of Insulin-like growth factor 2 mRNA-binding proteins (IGF2BPs) as m6A readers in cancer. Int J Biol Sci. 2022;18:2744-58
21. Lu Y, Wang X, Gu Q, Wang J, Sui Y, Wu J. et al. Heterogeneous nuclear ribonucleoprotein A/B: an emerging group of cancer biomarkers and therapeutic targets. Cell Death Discov. 2022Jul25;8:337
22. Zhang K, Zhang T, Yang Y, Tu W, Huang H, Wang Y. et al. N6-methyladenosine-mediated LDHA induction potentiates chemoresistance of colorectal cancer cells through metabolic reprogramming. Theranostics. 2022;12:4802-17
23. Zhang C, Chen L, Liu Y, Huang J, Liu A, Xu Y. et al. Downregulated METTL14 accumulates BPTF that reinforces super-enhancers and distal lung metastasis via glycolytic reprogramming in renal cell carcinoma. Theranostics. 2021;11:3676-93
24. Zuo X, Chen Z, Gao W, Zhang Y, Wang J, Wang J. et al. M6A-mediated upregulation of LINC00958 increases lipogenesis and acts as a nanotherapeutic target in hepatocellular carcinoma. J Hematol Oncol. 2020Jan8;13:5
25. Chen J, Ye M, Bai J, Gong Z, Yan L, Gu D. et al. ALKBH5 enhances lipid metabolism reprogramming by increasing stability of FABP5 to promote pancreatic neuroendocrine neoplasms progression in an m6A-IGF2BP2-dependent manner. Journal of Translational Medicine. 2023Oct19;21:741
26. Liu L, Gu M, Ma J, Wang Y, Li M, Wang H. et al. CircGPR137B/miR-4739/FTO feedback loop suppresses tumorigenesis and metastasis of hepatocellular carcinoma. Mol Cancer. 2022Jul20;21:149
27. Lin Z, Wan AH, Sun L, Liang H, Niu Y, Deng Y. et al. N6-methyladenosine demethylase FTO enhances chemo-resistance in colorectal cancer through SIVA1-mediated apoptosis. Mol Ther. 2022 Oct 28;S1525-001600624-4
28. Li T, Hu PS, Zuo Z, Lin JF, Li X, Wu QN. et al. METTL3 facilitates tumor progression via an m6A-IGF2BP2-dependent mechanism in colorectal carcinoma. Mol Cancer. 2019Jun24;18:112
29. Wang Q, Chen C, Ding Q, Zhao Y, Wang Z, Chen J. et al. METTL3-mediated m6A modification of HDGF mRNA promotes gastric cancer progression and has prognostic significance. Gut. 2020Jul;69:1193-205
30. Shi Y, Zheng C, Jin Y, Bao B, Wang D, Hou K. et al. Reduced Expression of METTL3 Promotes Metastasis of Triple-Negative Breast Cancer by m6A Methylation-Mediated COL3A1 Up-Regulation. Front Oncol. 2020;10:1126
31. Chen J, Ye M, Bai J, Hu C, Lu F, Gu D. et al. Novel insights into the interplay between m6A modification and programmed cell death in cancer. Int J Biol Sci. 2023;19:1748-63
32. Minami JK, Morrow D, Bayley NA, Fernandez EG, Salinas JJ, Tse C. et al. CDKN2A deletion remodels lipid metabolism to prime glioblastoma for ferroptosis. Cancer Cell. 2023Jun12;41:1048-1060.e9
33. Okada N, Ueki C, Shimazaki M, Tsujimoto G, Kohno S, Muranaka H. et al. NFYA promotes malignant behavior of triple-negative breast cancer in mice through the regulation of lipid metabolism. Commun Biol. 2023Jun2;6:596
34. Jeong DW, Park JW, Kim KS, Kim J, Huh J, Seo J. et al. Palmitoylation-driven PHF2 ubiquitination remodels lipid metabolism through the SREBP1c axis in hepatocellular carcinoma. Nat Commun. 2023Oct12;14:6370
35. Wang S, Zhou L, Ji N, Sun C, Sun L, Sun J. et al. Targeting ACYP1-mediated glycolysis reverses lenvatinib resistance and restricts hepatocellular carcinoma progression. Drug Resist Updat. 2023Jul;69:100976
36. Zhang Z, Li X, Yang F, Chen C, Liu P, Ren Y. et al. DHHC9-mediated GLUT1 S-palmitoylation promotes glioblastoma glycolysis and tumorigenesis. Nat Commun. 2021Oct7;12:5872
37. Di Marcantonio D, Martinez E, Kanefsky JS, Huhn JM, Gabbasov R, Gupta A. et al. ATF3 coordinates serine and nucleotide metabolism to drive cell cycle progression in acute myeloid leukemia. Mol Cell. 2021Jul1;81:2752-2764.e6
38. Liu J, Zhang C, Wu H, Sun XX, Li Y, Huang S. et al. Parkin ubiquitinates phosphoglycerate dehydrogenase to suppress serine synthesis and tumor progression. J Clin Invest. 2020Jun1;130:3253-69
39. Bancaro N, Calì B, Troiani M, Elia AR, Arzola RA, Attanasio G. et al. Apolipoprotein E induces pathogenic senescent-like myeloid cells in prostate cancer. Cancer Cell. 2023Mar13;41:602-619.e11
40. Kemp SB, Carpenter ES, Steele NG, Donahue KL, Nwosu ZC, Pacheco A. et al. Apolipoprotein E Promotes Immune Suppression in Pancreatic Cancer through NF-κB-Mediated Production of CXCL1. Cancer Res. 2021Aug15;81:4305-18
41. Tavazoie MF, Pollack I, Tanqueco R, Ostendorf BN, Reis BS, Gonsalves FC. et al. LXR/ApoE Activation Restricts Innate Immune Suppression in Cancer. Cell. 2018Feb8;172:825-840.e18
42. Chen YC, Pohl G, Wang TL, Morin PJ, Risberg B, Kristensen GB. et al. Apolipoprotein E is required for cell proliferation and survival in ovarian cancer. Cancer Res. 2005Jan1;65:331-7
43. Lin X, Zhang J, Zhao RH, Zhang WJ, Wu JF, Xue G. APOE Is a Prognostic Biomarker and Correlates with Immune Infiltrates in Papillary Thyroid Carcinoma. J Cancer. 2022;13:1652-63
Author contact
![]() Corresponding authors: Qiyun Tang, Department of Geriatric Gastroenterology, Neuroendocrine Tumor Center, Jiangsu Province Hospital, The First Affiliated Hospital of Nanjing Medical University, Institute of Neuroendocrine Tumor, Nanjing Medical University, No. 300 Guangzhou Road, Nanjing, 210029, China. Email: tqy831com. Ye Tian, Department of Geriatric Gastroenterology, Neuroendocrine Tumor Center, Jiangsu Province Hospital, The First Affiliated Hospital of Nanjing Medical University, Institute of Neuroendocrine Tumor, Nanjing Medical University, NO. 300 Guangzhou Road, Nanjing, China. Email: tianye6626com. Jianan Bai, Department of Geriatric Gastroenterology, Neuroendocrine Tumor Center, Jiangsu Province Hospital, The First Affiliated Hospital of Nanjing Medical University, Institute of Neuroendocrine Tumor, Nanjing Medical University, No. 300 Guangzhou Road, Nanjing, 210029, China. Yan Wang, The First Affiliated Hospital of Nanjing Medical University, Department of Gastroenterology, The Friendship Hospital of Ili Kazakh Autonomous Prefecture, Ili State 835000, China. Email: wy_797com.
Corresponding authors: Qiyun Tang, Department of Geriatric Gastroenterology, Neuroendocrine Tumor Center, Jiangsu Province Hospital, The First Affiliated Hospital of Nanjing Medical University, Institute of Neuroendocrine Tumor, Nanjing Medical University, No. 300 Guangzhou Road, Nanjing, 210029, China. Email: tqy831com. Ye Tian, Department of Geriatric Gastroenterology, Neuroendocrine Tumor Center, Jiangsu Province Hospital, The First Affiliated Hospital of Nanjing Medical University, Institute of Neuroendocrine Tumor, Nanjing Medical University, NO. 300 Guangzhou Road, Nanjing, China. Email: tianye6626com. Jianan Bai, Department of Geriatric Gastroenterology, Neuroendocrine Tumor Center, Jiangsu Province Hospital, The First Affiliated Hospital of Nanjing Medical University, Institute of Neuroendocrine Tumor, Nanjing Medical University, No. 300 Guangzhou Road, Nanjing, 210029, China. Yan Wang, The First Affiliated Hospital of Nanjing Medical University, Department of Gastroenterology, The Friendship Hospital of Ili Kazakh Autonomous Prefecture, Ili State 835000, China. Email: wy_797com.